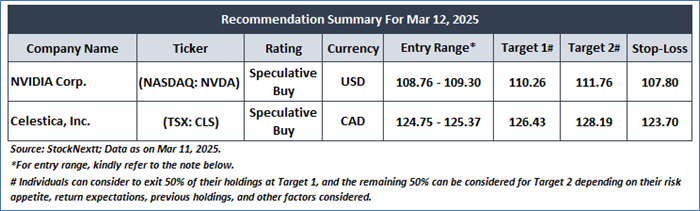
Company Overview: NVIDIA Corp. (NASDAQ: NVDA) engages in the design and manufacture of computer graphics processors, chipsets, and related multimedia software. Celestica, Inc. (TSX: CLS) engages in the provision of supply chain solutions globally to equipment manufacturers and service providers. This Report covers the Price Action, Technical Indicators Analysis along with the Target Levels, Stop Loss Level, and Recommendations on these two stocks.

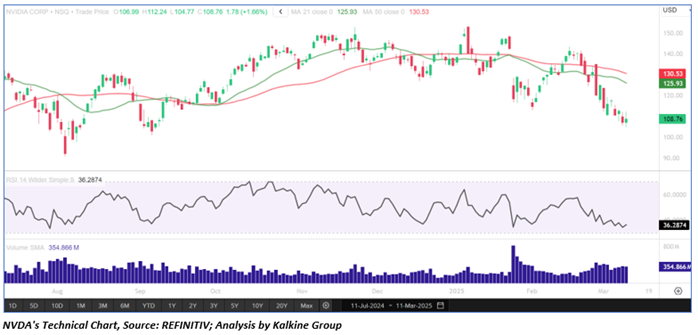
NVDA’s Technical Observation
NVDA's stock price is hovering close to important support levels, which suggests the potential for a rise in the near term. The 14-period RSI is currently below the midpoint, indicating a possible upward pullback. However, the stock is trading below its 21-day Simple Moving Average, which could act as a resistance level going forward.
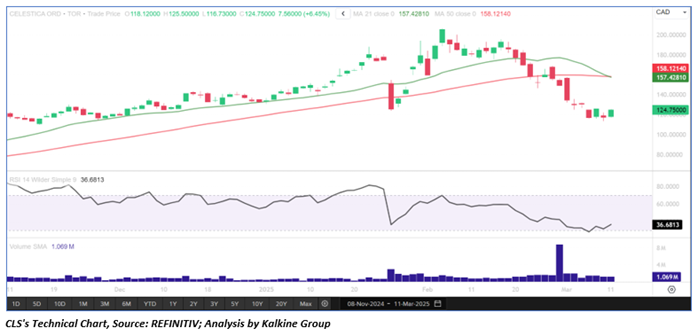
CLS’s Technical Observation
CLS's stock price has established support at key levels and ended the previous trading day on an upward note, signaling a possible rise in the near future. The 14-period RSI is currently below the midpoint, indicating a potential upward pullback. However, the stock is trading beneath its 50-day Simple Moving Average, which may serve as a resistance level in the short term.
Markets are trading in a highly volatile zone currently due to certain macroeconomic issues and prevailing geopolitical tensions. Therefore, it is prudent to follow a cautious approach while investing.
Related Risks: This report may be looked at from a high-risk perspective and recommendations are provided only for day trading purposes. Recommendations provided in this report are solely based on technical parameters, and the fundamental performance of the stocks has not been considered in the decision-making process. Other factors which could impact stock prices include market risks, regulatory risks, interest rates risks, currency risks, social and political instability risks etc.
Note 1: Entry Range: For the given recommendation(s), the Entry Range is based on considering a certain range (0.5% - 2%) above (in speculative buy case) or below (in sell case) of the previous day close price. A recommendation will be considered void if the prices do not test the given range levels for the particular day.
Note 2: This report's recommendation(s) is purely for day trading purposes and position(s) will be considered closed automatically at the close price of the day in case no target or stop loss level is hit. It is advisable to follow the targets and stop-loss levels strictly and exit the position accordingly, as it may lead to limitless loss if the position is not taken care of with due diligence.
How to Read the Charts?
The green color line reflects the 21-period moving average, while the red line indicates the 50- period moving average. SMA helps to identify existing price trends. If the prices are trading above the 21-period and 50-period moving averages, then it shows prices are currently trading in a bullish trend.
The black color line in the chart’s lower segment reflects the Relative Strength Index (14-Period), which indicates the strength of the price trend. A reading above 50 indicates a positive momentum, while below 50 indicates a negative momentum. A reading of 70 or above suggests overbought status, while a reading of 30 or below suggests an oversold status.
The blue bars in the chart’s lower segment show the volume of the stock. The volume is the number of shares that changed hands during a given day. Stocks with high volumes are more liquid than stocks with lesser volumes, and higher liquidity in stocks helps in easier and faster execution of the order.
Stop-loss: It is a level to protect further losses in case of unfavourable movement in the stock prices.
The reference date for all price data, currency, technical indicators, support, and resistance levels March 11, 2025. The reference data in this report has been partly sourced from REFINITIV.
Abbreviations
CMP: Current Market Price
SMA: Simple Moving Average
RSI: Relative Strength Index
USD: United States dollar
Note: Trading decisions require a thorough analysis by individuals. The technical analysis reports generally chart out metrics that individuals may assess before any stock evaluation. The above are illustrative analytical factors used for evaluating the stocks; other parameters can be looked at along with additional risks per se. Past performance is neither an indicator nor a guarantee of future performance.
Disclaimer-
This report has been issued by Kalkine Limited (Company number 07903332), a private limited company, incorporated in England and Wales ("Kalkine”). Kalkine.co.uk and associated pages are published by Kalkine. Kalkine is authorised and regulated by the Financial Conduct Authority under reference number 579414.
The information in this report and on the Kalkine website has been prepared from a wide variety of sources, which Kalkine, to the best of its knowledge and belief, considers accurate. Kalkine has made every effort to ensure the reliability of information contained in its reports, newsletters and websites. All information represents our views at the date of publication and may change without notice. The information in this report does not constitute an offer to sell securities or other financial products or a solicitation of an offer to buy securities or other financial products. Our reports contain non personalized recommendations to invest in securities and other financial products.
Kalkine does not offer financial advice based upon your personal financial situation or goals, and we shall not be held liable for any investment or trading losses you may incur by using the opinions expressed in our reports, publications, market updates, news alerts and corporate profiles. Kalkine does not intend to exclude any liability which it is not permitted to exclude under applicable law or regulation. Kalkine’s non-personalised advice does not in any way endorse or recommend individuals, investment products or services for your personal financial situation. You should discuss your portfolios and the risk tolerance level appropriate for your personal financial situation, with a professional authorised financial planner and adviser. You should be aware that the value of any investment and the income from it can go down as well as up and you may not get back the amount invested.
Please also read our Terms & Conditions for further information. Employees and/or associates of Kalkine and its related entities may hold interests in the securities or other financial products covered in this report or on the Kalkine website. Any such employees and associates are required to comply with certain safeguards, procedures and disclosures as required by law.
Kalkine Media Limited, an affiliate of Kalkine, may have received, or be entitled to receive, financial consideration in connection with providing information about certain entity(s) covered on its website including entities covered in this report.
Past performance is not a reliable indicator of future performance.
 Please wait processing your request...