Company Overview: Tesla, Inc. (NASDAQ: TSLA) designs, develops, manufactures, sells and leases high-performance fully electric vehicles and energy generation and storage systems, and offers services related to its products. Its segments include automotive, and energy generation and storage. Lundin Gold Inc. (TSX: LUG) is a mining company. The Company owns the Fruta del Norte (FDN) gold mine in southeast Ecuador. The Company also owns a portfolio of highly prospective exploration properties close to FDN. The deposit is hosted in the La Zarza concession, located in the 38 square kilometer (km2) Suarez Pull-Apart Basin.
This Report covers the Price Action, Technical Indicators Analysis along with the Target Levels, Stop Loss Level, and Recommendations on these two stocks.

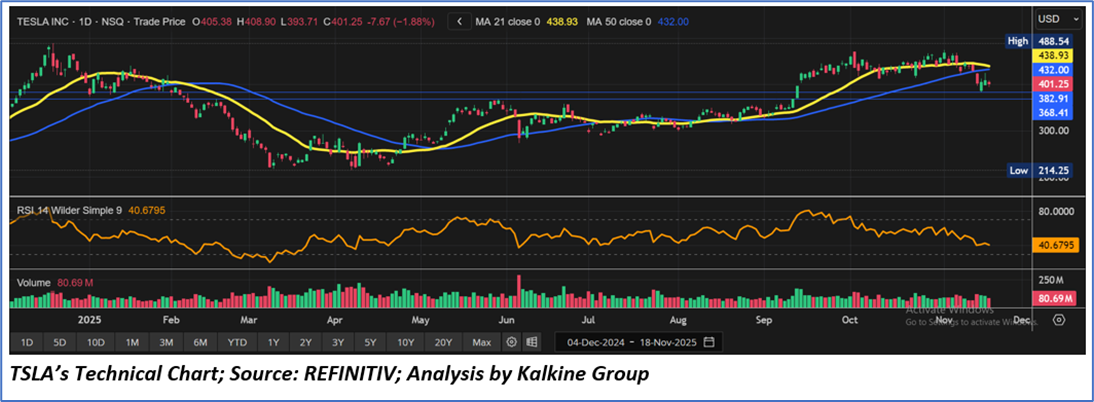
TSLA’s Technical Observation
Tesla Inc. (TSLA) is showing early signs of stabilization, holding above the key USD 382–384 support zone despite the recent pullback. The stock is attempting to base near USD 401, and the medium-term trend remains constructive as the 50-day moving average continues to slope upward. The RSI near 41 suggests the stock is approaching oversold territory, indicating weakening selling pressure and potential for a rebound. With no major distribution spikes in volume, the decline appears technical rather than structural. If TSLA maintains support in the USD 382–401 region, it could stage a recovery toward USD 432 and potentially retest the recent highs, supported by an improving momentum backdrop.
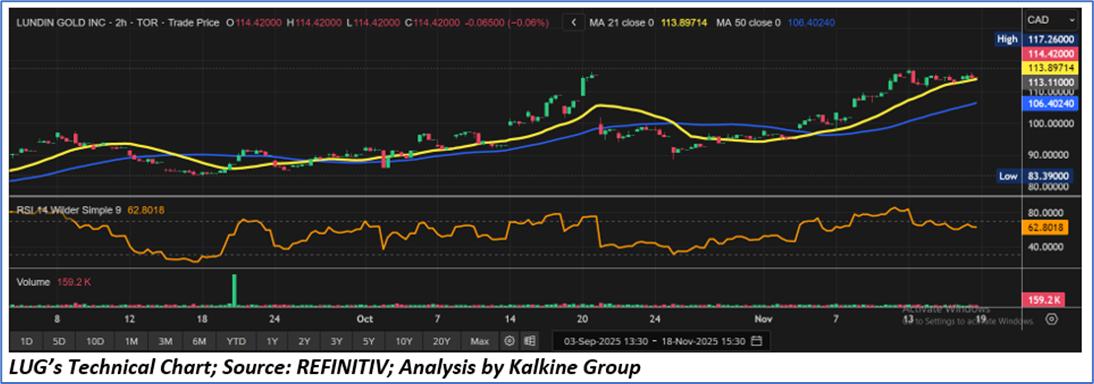
LUG’s Technical Observation
Lundin Gold Inc. (LUG) maintains a constructive technical outlook, with the price consolidating near CAD 114 after a strong prior uptrend, supported by the 21-day moving average around CAD 113.9, which continues to act as dynamic support and reflects sustained bullish momentum. The 50-day moving average at CAD 106.4 is trending upward and remains well below current price levels, reinforcing a medium-term positive structure. The RSI at approximately 63 indicates healthy momentum without yet entering overbought territory, suggesting additional upside potential if buying interest persists. Volume patterns remain stable, and the stock’s ability to hold above the CAD 110–112 support band further strengthens the bullish bias, positioning LUG favorably for a potential retest of the recent high near CAD 117 should broader sentiment and commodity trends remain supportive.
Markets are trading in a highly volatile zone currently due to certain macroeconomic issues and prevailing geopolitical tensions. Therefor it is prudent to follow a cautious approach while investing.
Related Risks: This report may be looked at from a high-risk perspective, and recommendations are provided only for day trading purposes. Recommendations provided in this report are solely based on technical parameters, and the fundamental performance of the stocks has not been considered in the decision-making process. Other factors which could impact stock prices include market risks, regulatory risks, interest rates risks, currency risks, social and political instability risks etc.
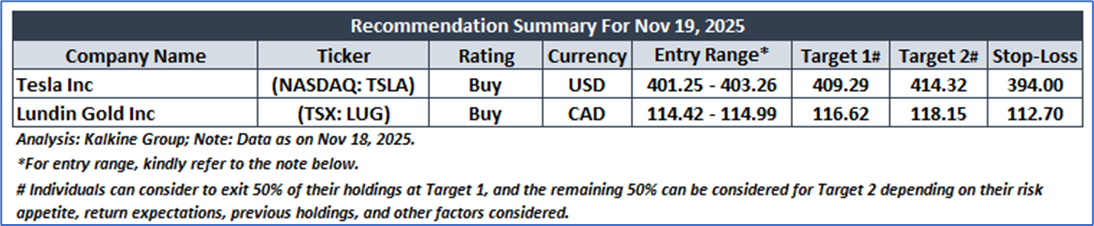
Note 1: Entry Range: For the given recommendation(s), the Entry Range is based on considering a certain range (0.5% - 2%) above (in speculative buy case) or below (in sell case) of the previous day close price. A recommendation will be considered void if the prices do not test the given range levels for the particular day.
Note 2: This report's recommendation(s) is purely for day trading purposes and position(s) will be considered closed automatically at the close price of the day in case no target or stop loss level is hit. It is advisable to follow the targets and stop-loss levels strictly and exit the position accordingly, as it may lead to limitless loss if the position is not taken care of with due diligence.
How to Read the Charts?
The green colour line reflects the 21-period moving average, while the red line indicates the 50- period moving average. SMA helps to identify existing price trends. If the prices are trading above the 21-period and 50-period moving averages, then it shows prices are currently trading in a bullish trend.
The black colour line in the chart’s lower segment reflects the Relative Strength Index (14-Period), which indicates the strength of the price trend. A reading above 50 indicates a positive momentum, while below 50 indicates a negative momentum. A reading of 70 or above suggests overbought status, while a reading of 30 or below suggests an oversold status.
The blue bars in the chart’s lower segment show the volume of the stock. The volume is the number of shares that changed hands during a given day. Stocks with high volumes are more liquid than stocks with lesser volumes, and higher liquidity in stocks helps in easier and faster execution of the order.
Stop-loss: It is a level to protect further losses in case of unfavorable movement in the stock prices.
The reference date for all price data, currency, technical indicators, support, and resistance levels as on November 18, 2025. The reference data in this report has been partly sourced from REFINITIV.
Abbreviations
CMP: Current Market Price
SMA: Simple Moving Average
RSI: Relative Strength Index
USD: United States dollar
CAD: Canadian dollar
Note: Trading decisions require a thorough analysis by individuals. The technical analysis reports generally chart out metrics that individuals may assess before any stock evaluation. The above are illustrative analytical factors used for evaluating the stocks; other parameters can be looked at along with additional risks per se. Past performance is neither an indicator nor a guarantee of future performance.
Disclaimer-
Disclosure: Any research report published by Kalkine Limited with respect to Tesla, Inc. will contain a disclosure in the report: "Kalkine Limited's (Kalkine) director Kunal Sawhney owns shares of Tesla, Inc. since March 2024. Kalkine has recommended Tesla, Inc. in its report as non-personalized advice only (under FCA Firm Reference Number 579414). The advice given by Kalkine is provided for general informational purposes and should not be considered as personalized investment advice. Investors should conduct their own research and seek professional advice before making any investment decisions."
This report has been issued by Kalkine Limited (Company number 07903332), a private limited company, incorporated in England and Wales ("Kalkine”). Kalkine.co.uk and associated pages are published by Kalkine. Kalkine is authorised and regulated by the Financial Conduct Authority under reference number 579414.
The information in this report and on the Kalkine website has been prepared from a wide variety of sources, which Kalkine, to the best of its knowledge and belief, considers accurate. Kalkine has made every effort to ensure the reliability of information contained in its reports, newsletters and websites. All information represents our views at the date of publication and may change without notice. The information in this report does not constitute an offer to sell securities or other financial products or a solicitation of an offer to buy securities or other financial products. Our reports contain non personalized recommendations to invest in securities and other financial products.
Kalkine does not offer financial advice based upon your personal financial situation or goals, and we shall not be held liable for any investment or trading losses you may incur by using the opinions expressed in our reports, publications, market updates, news alerts and corporate profiles. Kalkine does not intend to exclude any liability which it is not permitted to exclude under applicable law or regulation. Kalkine’s non-personalised advice does not in any way endorse or recommend individuals, investment products or services for your personal financial situation. You should discuss your portfolios and the risk tolerance level appropriate for your personal financial situation, with a professional authorised financial planner and adviser. You should be aware that the value of any investment and the income from it can go down as well as up and you may not get back the amount invested.
Please also read our Terms & Conditions for further information. Employees and/or associates of Kalkine and its related entities may hold interests in the securities or other financial products covered in this report or on the Kalkine website. Any such employees and associates are required to comply with certain safeguards, procedures and disclosures as required by law.
Kalkine Media Limited, an affiliate of Kalkine, may have received, or be entitled to receive, financial consideration in connection with providing information about certain entity(s) covered on its website including entities covered in this report.
Past performance is not a reliable indicator of future performance.
 Please wait processing your request...