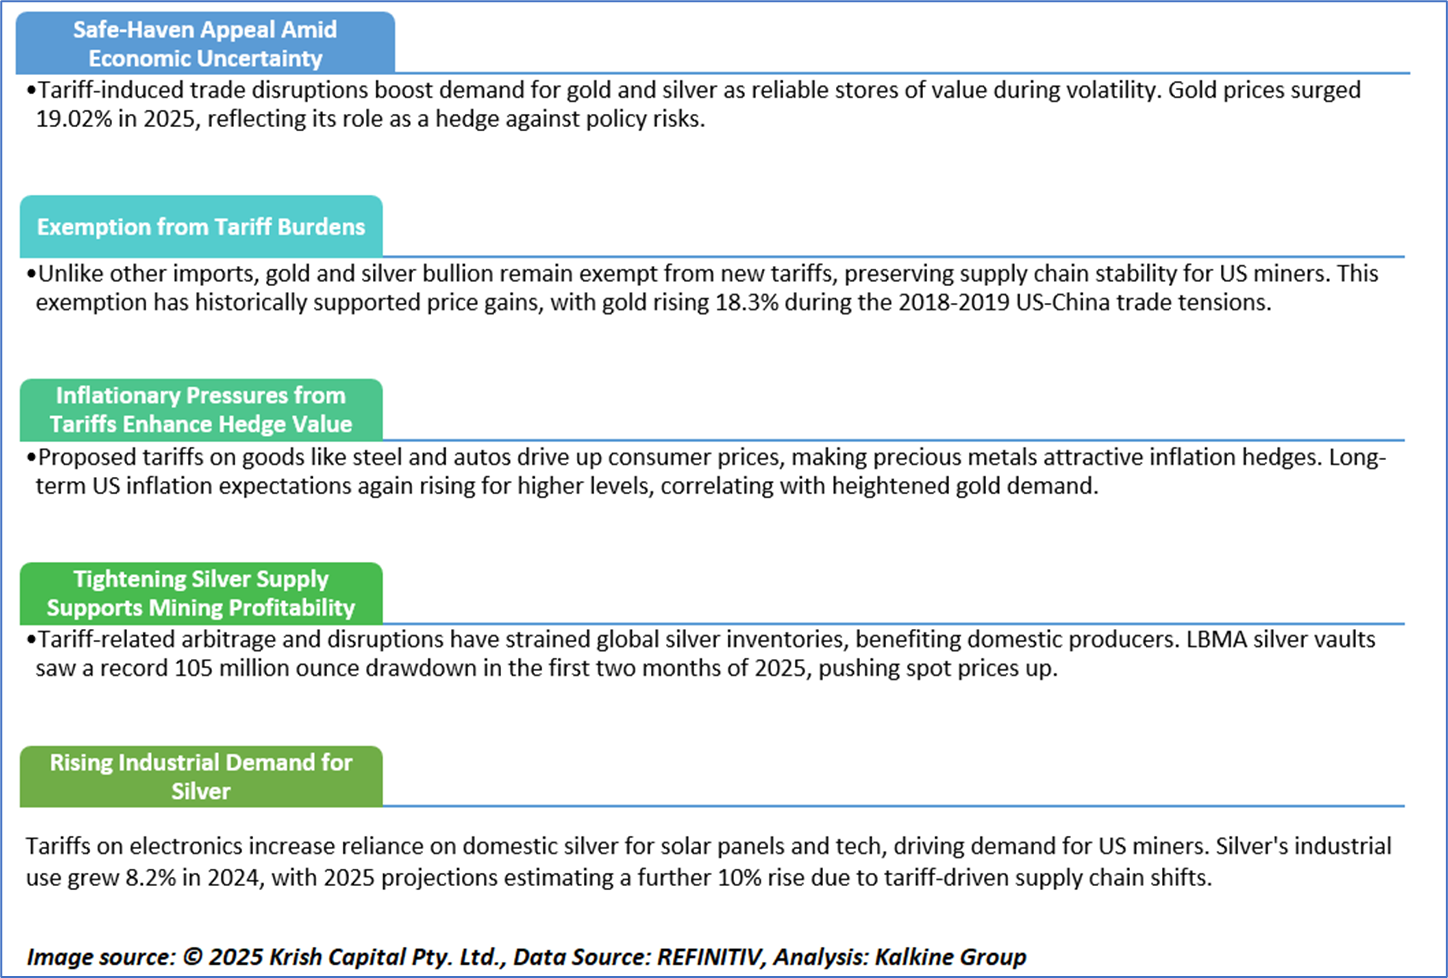
Kalkine’s Global Tariff Report provides fully independent analysis and data-driven analysis of major global sectors affected by tariff changes, evaluating the implications these shifts may have on equity valuations across those industries. The report concentrates on trade-sensitive sectors that typically experience heightened investor scrutiny during periods of tariff uncertainty. It also identifies defensive and countercyclical segments that demonstrate relative resilience or may even outperform, amid disruptions to global trade flows.
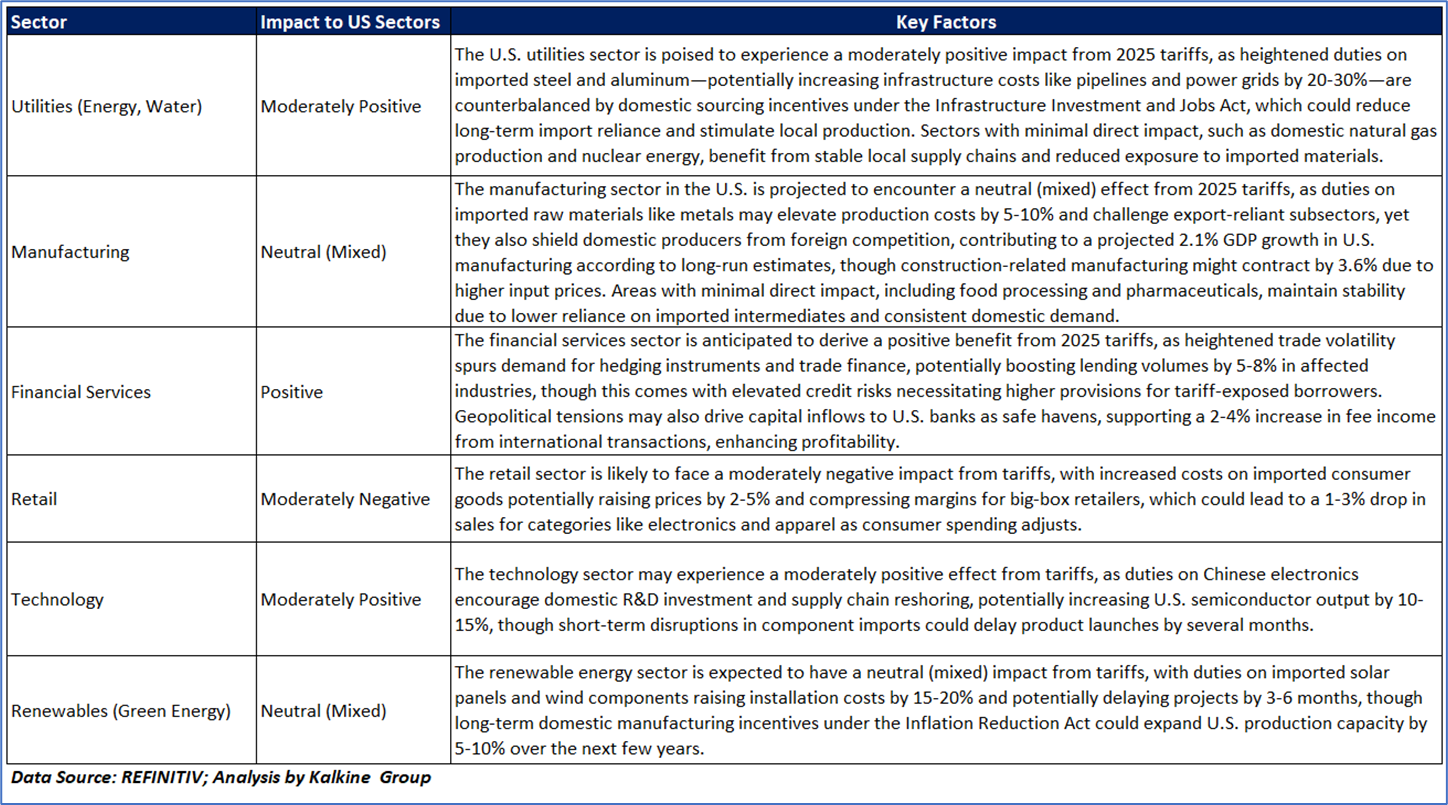
As illustrated in the table below, several key sectors in different countries are directly impacted by the recent tariff announcement from President Trump.


Key Developments (as of September 29, 2025)
Canada
- Tariff Increase: On July 31, President Trump signed an executive order increasing tariffs on non-USMCA-compliant Canadian imports from approximately 25% to 35%, effective August 1; exemptions for USMCA-compliant goods cover ~85-95% of trade, including energy exports.
- Canada’s Response: Effective September 1, Canada removed retaliatory tariffs on most US imports qualifying under USMCA, but maintains ~25% tariffs on US steel, aluminum, and autos; a 6-month remission process for certain US goods in manufacturing and public health remains active until October 15.
- Diplomatic Efforts: Canada launched the "Canada–Mexico Action Plan" on September 15 to deepen cooperation in infrastructure, energy, and agriculture, reducing US dependency; provincial budgets (e.g., Alberta's doubled USD 1.5 billion contingency fund) support tariff mitigation, with ongoing USMCA review consultations starting September 2025.
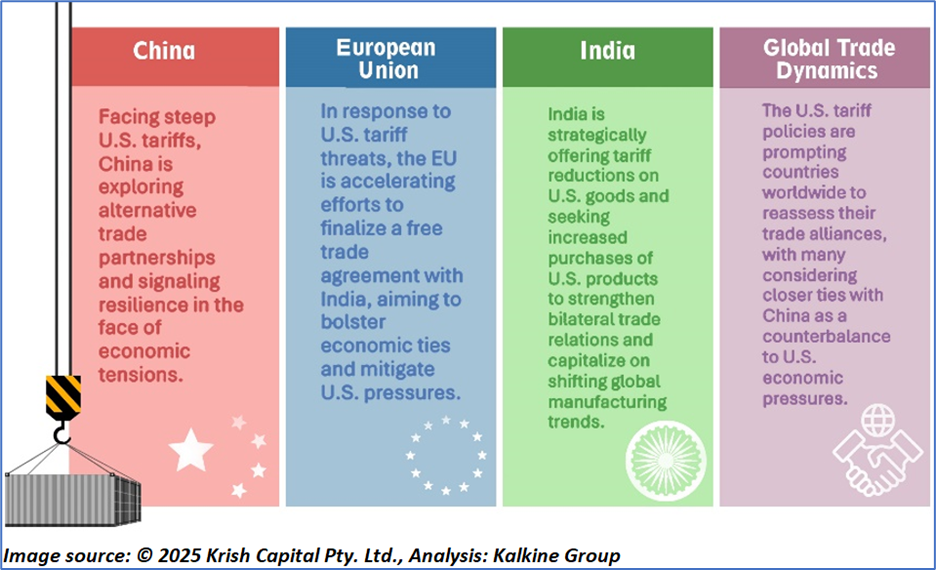
India
- Tariff Increase: Effective August 27, the US imposed an additional ~25% punitive tariff on Indian goods (total ~50%) under IEEPA for continued Russian oil imports, affecting ~USD 48.2 billion in exports; on September 18, Chief Economic Adviser V. Anantha Nageswaran indicated potential US easing to 10-15% reciprocal + removal of punitive levy via ongoing talks.
- Scope: Targets labor-intensive sectors like textiles, gems/jewelry, agriculture, and autos/auto components; exemptions for pharma, IT services, and defense.
- Strategic Pushback: India reduced GST on consumer goods on September 3 to boost domestic demand; Vice President Vance confirmed "secondary tariffs" on September 23 to pressure Russia; trade talks with US (Sep 22-24) aim for partial deal by autumn, amid thawing India-China relations and BRICS focus.
- Economic Impact: Exports to US declined further in September (first full month under 50% tariffs), potentially erasing 1% GDP growth; unemployment risks rise in affected sectors, with Nomura likening it to a "trade embargo."
China
- Tariff Truce Extension: On August 11, the US extended the tariff truce with China for another 90 days until November 10, 2025, avoiding escalation to ~145% US duties; current rates remain at ~30% on Chinese imports and 10% on US goods.
- Current Tariffs: No new hikes; truce includes export controls relief on rare earths and US chips, with negotiations focusing on trade imbalances and fentanyl; analysts note it prevents holiday-season disruptions but underscores ongoing national emergency declaration.
European Union
- Tariff Framework Agreement: As of August 21, the US-EU Framework capped total tariffs (MFN + reciprocal + Section 232) at ~15% on most EU goods; implemented September 25 via Federal Register notice and Executive Order 14346 (Sep 5), with retroactive 15% on autos/auto parts from August 1.
- Cars and Quotas: US maintains ~27.5% on European cars/parts pending EU legislation to lower its tariffs on US goods; exemptions for unavailable natural resources (e.g., cork), aircraft/parts, and generic pharma/ingredients effective September 1.
- Most EU Goods: Flat ~15% maximum under new framework; EU eliminates tariffs on all US industrial goods and provides preferential access for US seafood/agriculture (e.g., tree nuts, dairy); deal expands 2020 lobster agreement to processed lobster.


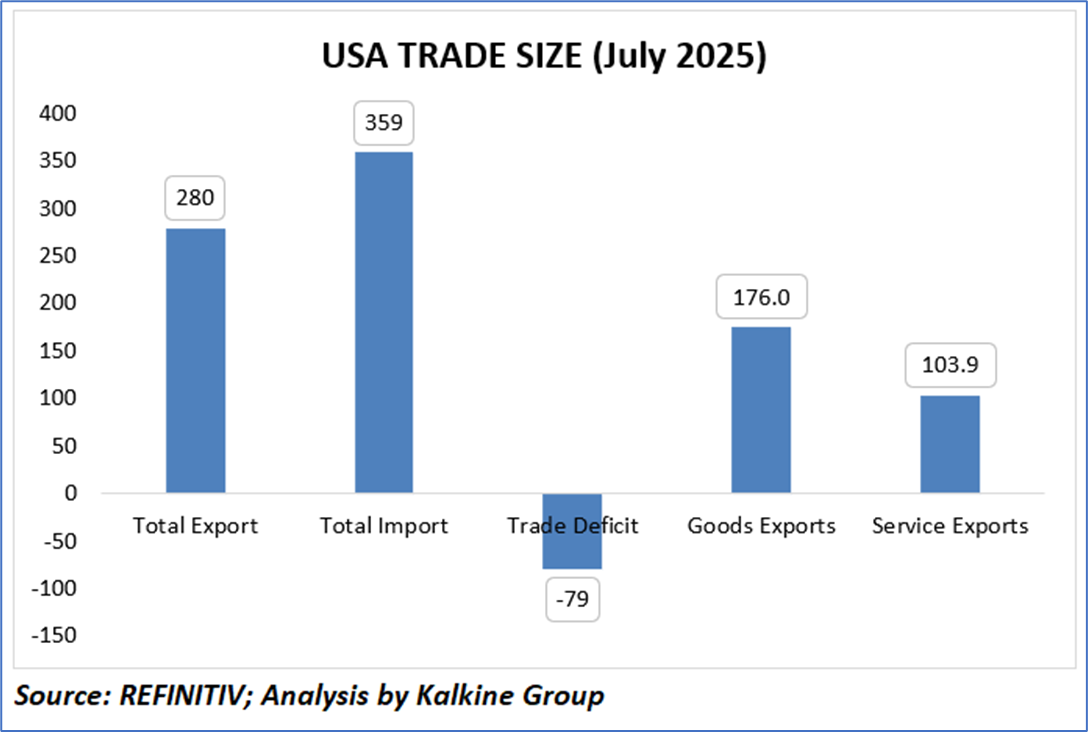
In July 2025, the United States recorded a total export value of USD 280 billion, comprising USD 176.07 billion in goods exports and USD 103.93 billion in services exports, reflecting a modest 1% month-over-month increase from June's USD 277 billion total exports, driven primarily by a 5% rise in services amid resilient demand for US tech and financial offerings. However, imports surged to USD 359 billion, up 6.5% from June's USD 337 billion, exacerbating the trade deficit to USD -79 billion—a 32% widening from the previous month's USD -60 billion deficit—potentially fueled by heightened consumer and industrial demand, tariff-induced stockpiling, or supply chain shifts amid ongoing global trade tensions. This imbalance highlights structural vulnerabilities in US goods trade, with goods exports declining 1% sequentially, underscoring challenges in manufacturing sectors exposed to retaliatory tariffs, while the services surplus provides a partial offset, emphasizing the need for policy measures to bolster export competitiveness and address inflationary pressures from elevated imports.

The U.S. economy is currently grappling with significant challenges, including high inflation, supply chain disruptions, and the effects of aggressive monetary policy from the Federal Reserve. Key sectors such as manufacturing, agriculture, and technology are feeling strain, particularly due to their dependence on global supply chains and export markets, with trade policies like tariffs on steel, aluminum, and electronics driving up costs for businesses and consumers alike. Despite these pressures, there’s cautious optimism in some quarters about market stabilization within the next year, though this is tempered by ongoing issues like labor shortages, energy price volatility, and political divisions. The Federal Reserve’s interest rate hikes aimed at curbing inflation—still above target levels—have slowed economic growth, raising recession risks, while strategic efforts such as trade agreements and supply chain diversification remain critical to fostering stability and mitigating prolonged uncertainty across these vital sectors.

Amid elevated Market Volatility and Tariff pressures, First Majestic Silver Corp. (NYSE: AG) stands out as our defensive pick within the Industrial Machinery Industry, supported by rigorous fundamental and technical research
Kalkine’s Global Tariff Report covers the Investment Highlights, Key Financial Metrics, Risks, Technical Analysis along with the Valuation, Target Price, and Recommendation on First Majestic Silver Corp. (NYSE: AG).
Section 1: Company Overview and Fundamental Insights
1.1 Company Overview:
First Majestic Silver Corp. (NYSE: AG) is a mining company. The Company is focused on silver and gold production in Mexico and the United States. It owns and operates approximately 350,000 hectares of land package, which include the San Dimas Silver/Gold Mine, the Santa Elena Silver/Gold Mine, the La Encantada Silver Mine, and a 70% joint venture interest in the Cerro Los Gatos Silver Mine as well as a portfolio of development and exploration assets, including the Jerritt Canyon Gold project located in northeastern Nevada, United States.
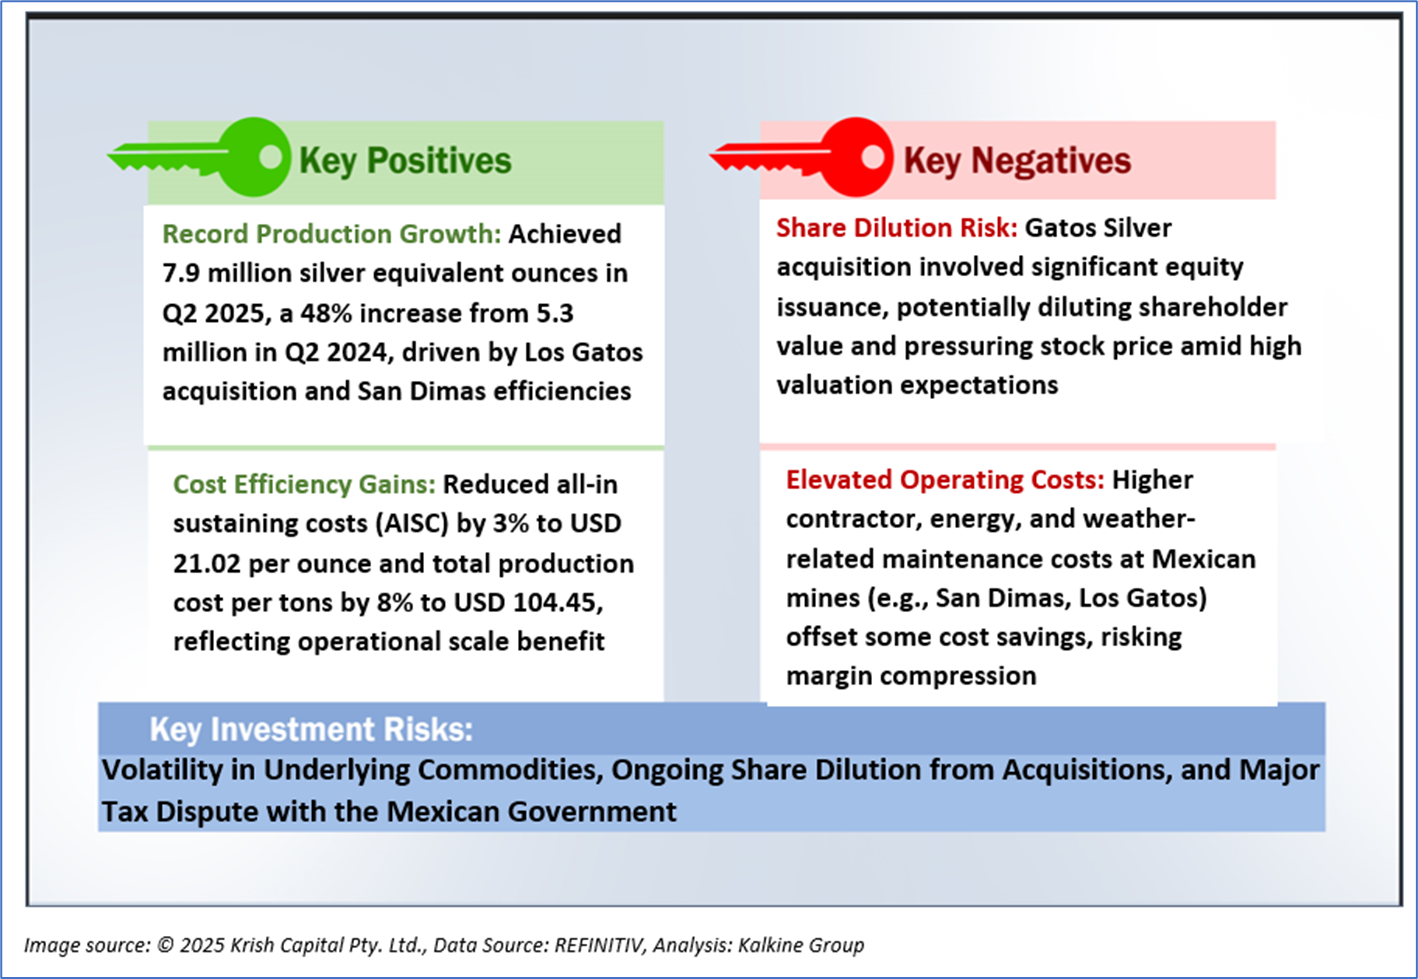
1.2 The Key Positives, Negatives, Investment Highlights and Risks
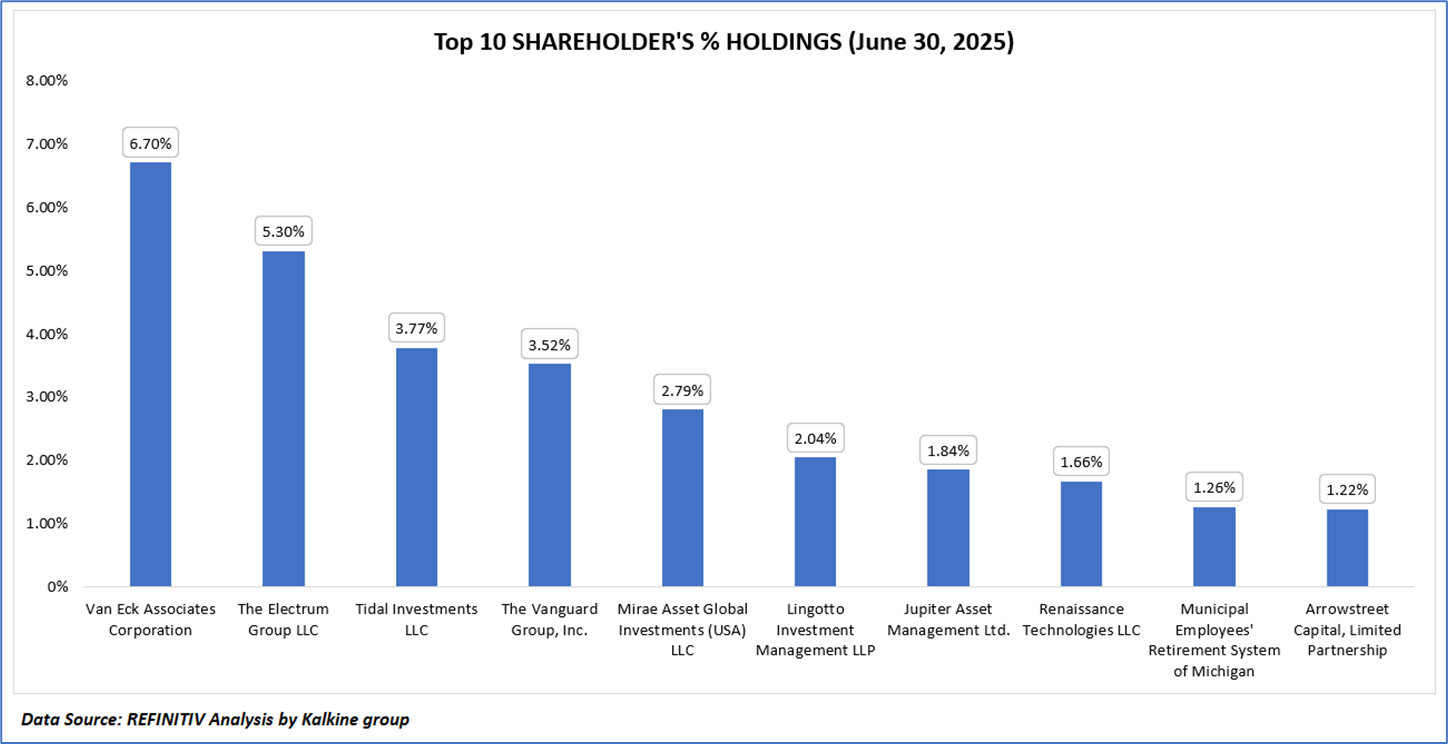
1.3 Top 10 Shareholders:
The top 10 shareholders together form ~30.09% of the total shareholding, indicating concentrated holding. Van Eck Associates Corporation The Electrum Group LLC hold a maximum stake in the company at ~6.70% and ~5.30%, respectively.
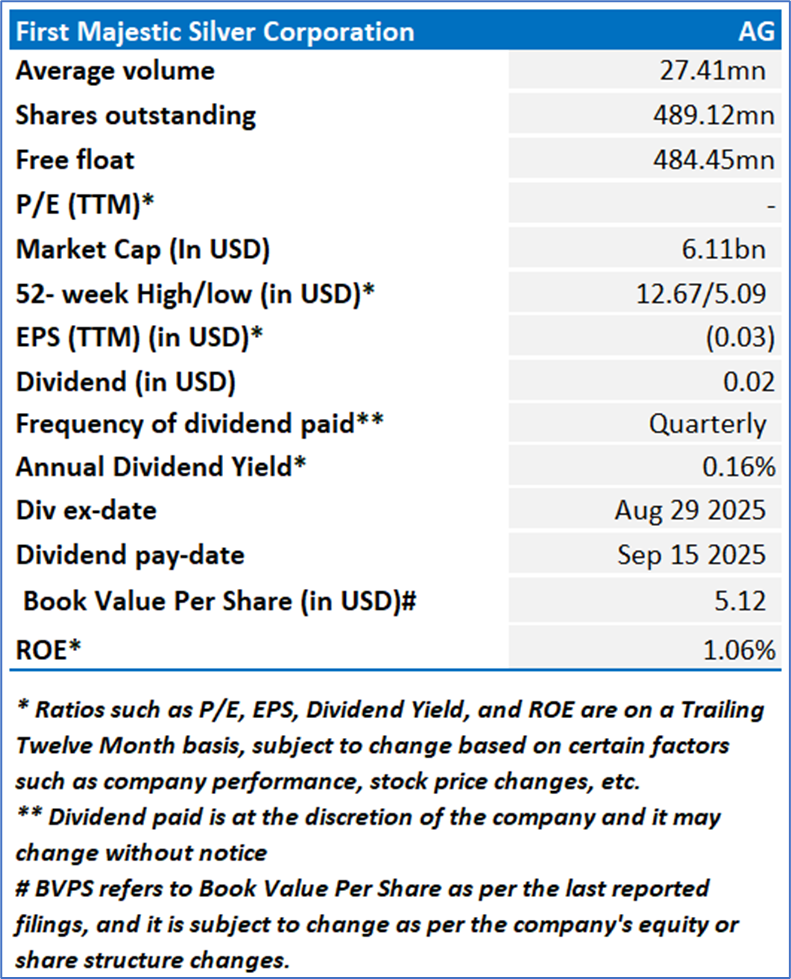
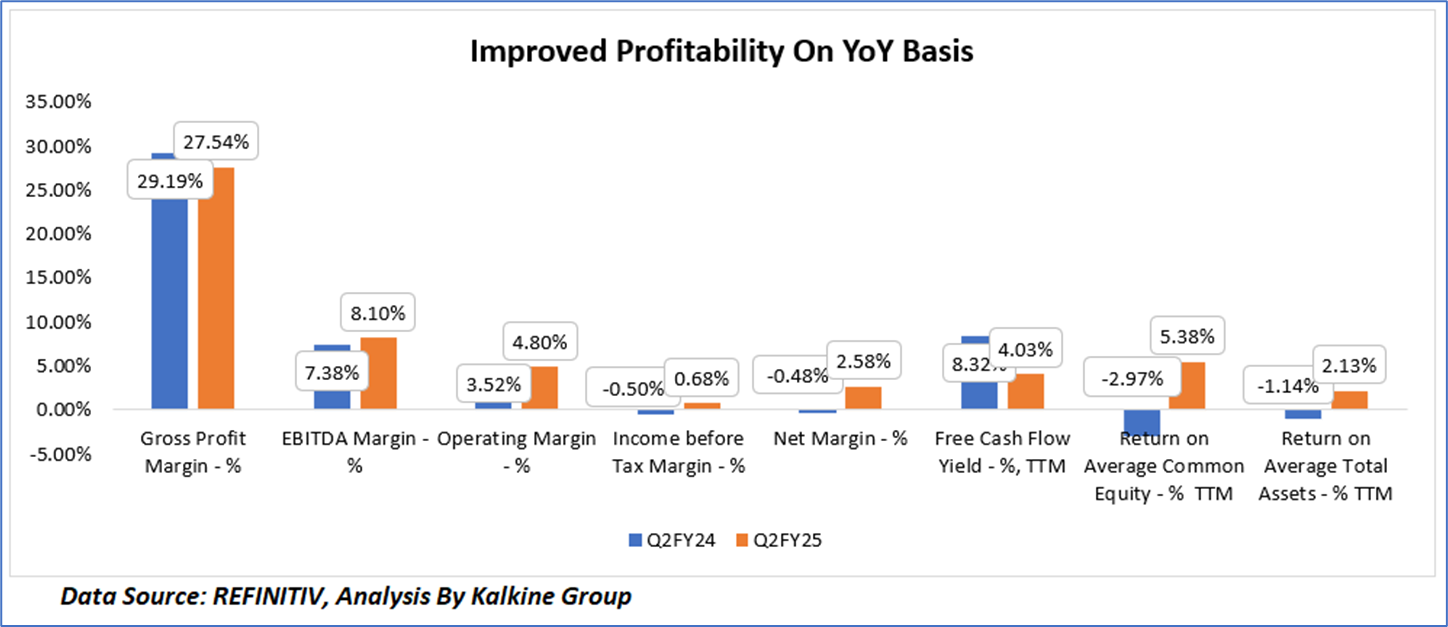
1.4 Key Metrics:
In the second quarter of fiscal year 2025, First Majestic Silver Corp. demonstrated a marked improvement in profitability compared to the same period in fiscal year 2024, reflecting enhanced operational efficiency and favorable commodity prices. The gross profit margin expanded from 12.65% to 19.72%, driven by higher silver equivalent production and cost controls, while the EBITDA margin surged from 22.63% to 39.56%, underscoring stronger earnings before interest, taxes, depreciation, and amortization amid revenue growth of 94%. Operating margins shifted from a negative -1.05% to a positive 11.53%, and income from before tax margins improved dramatically from -13.03% to 14.39%, indicating a transition from operational losses to pre-tax profitability supported by the Los Gatos acquisition and a 24% rise in realized silver prices. Net margins reversed from -35.44% to 21.41%, bolstered by a USD 39.6 million deferred tax recovery, while trailing twelve-month metrics showed positive momentum: free cash flow yield turned from -3.32% to 3.01%, return on average common equity from -5.73% to 0.76%, and return on average total assets from -3.94% to 0.75%, collectively signaling improved asset utilization, cash generation, and shareholder returns despite ongoing risks like commodity volatility and integration costs.
Section 2: Business Updates and Financial Highlights
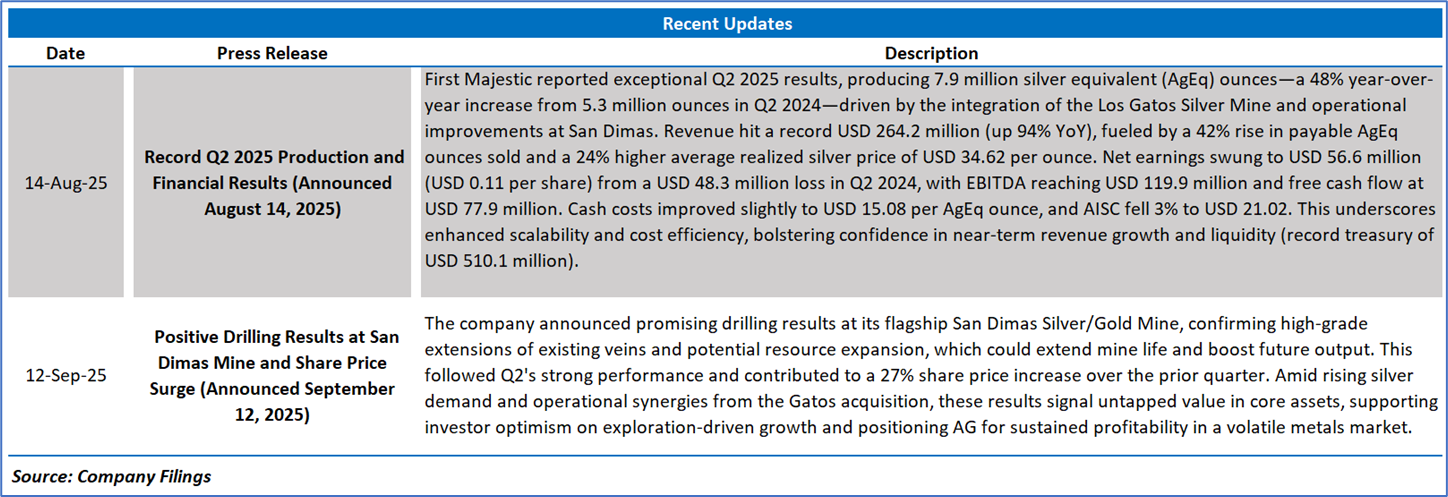
2.1 Recent Updates: The below picture gives an overview of the company’s recent activities, such as an announcement regarding dividend distribution.
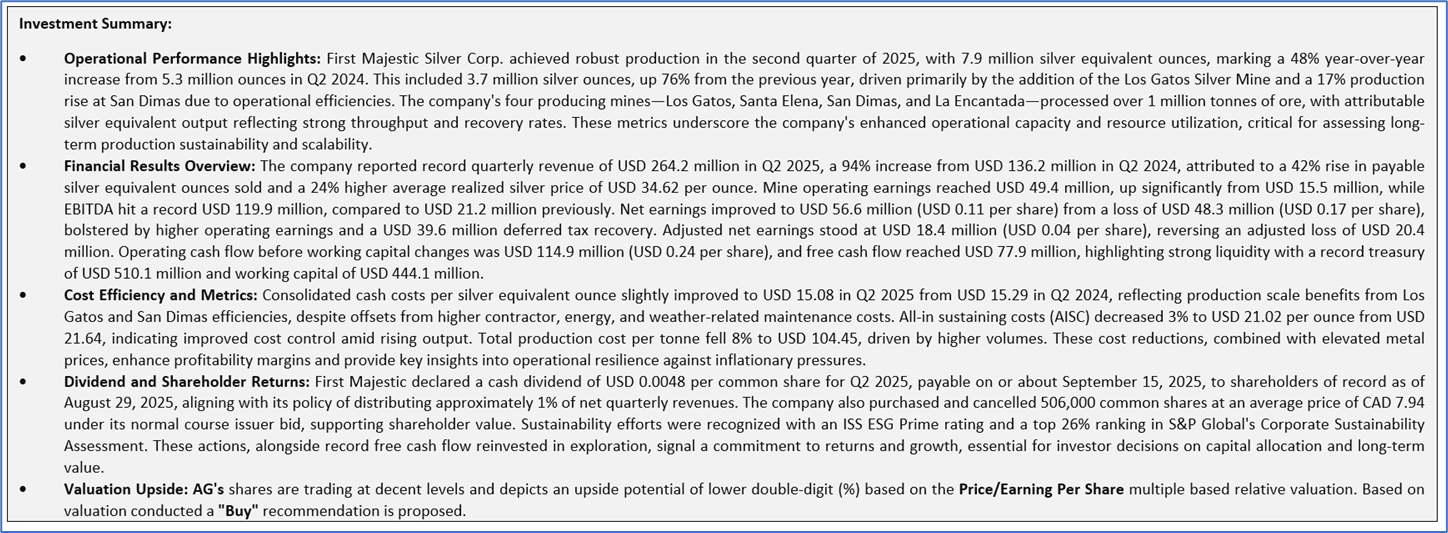
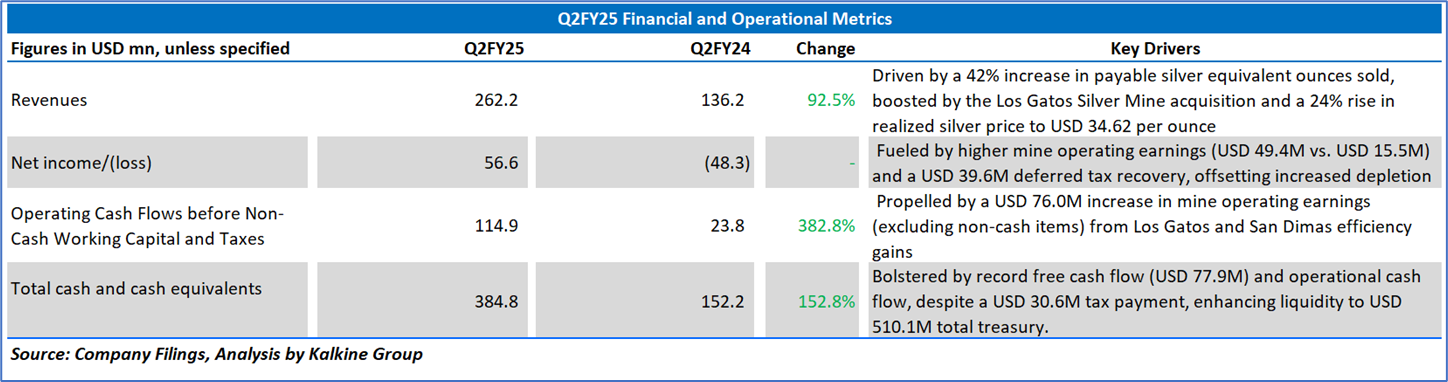
2.2 Insights into Q2FY25 Financial Performance:
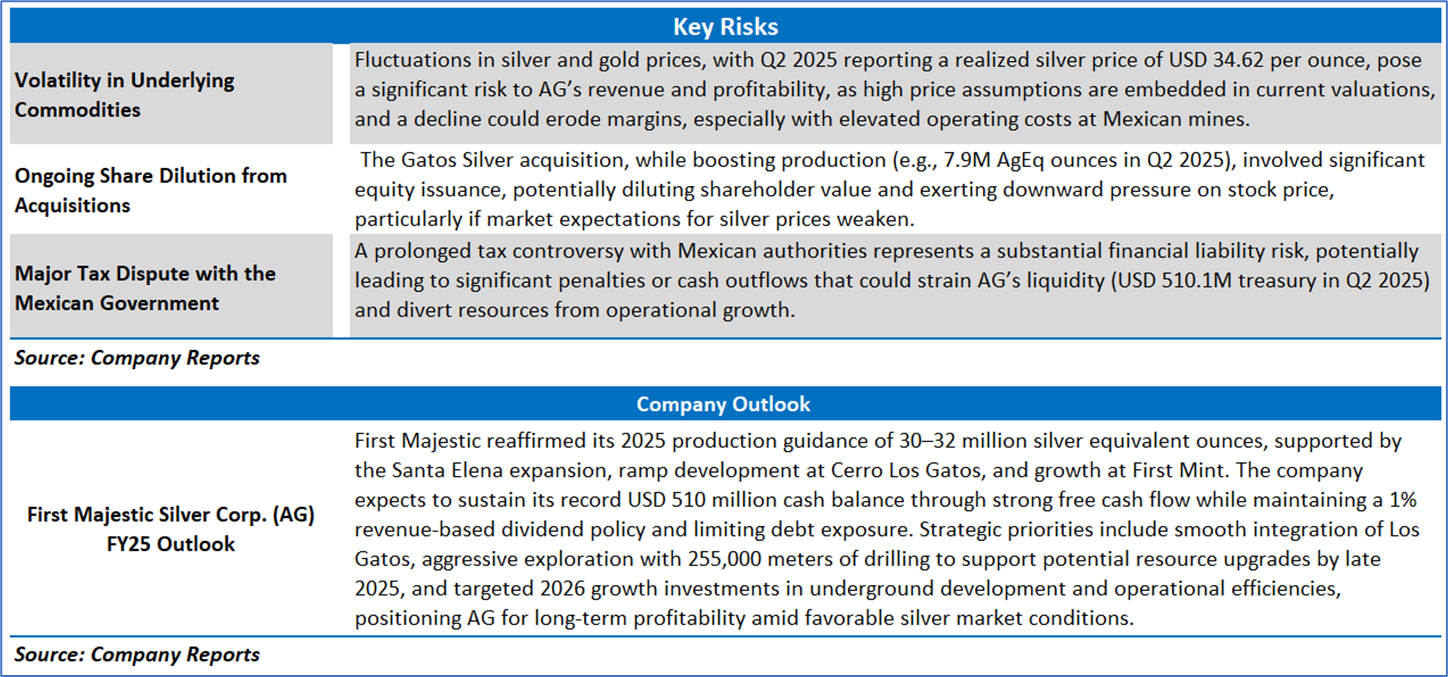
Section 3: Key Risks, Company Outlook:
Section 4: Stock Recommendation Summary:
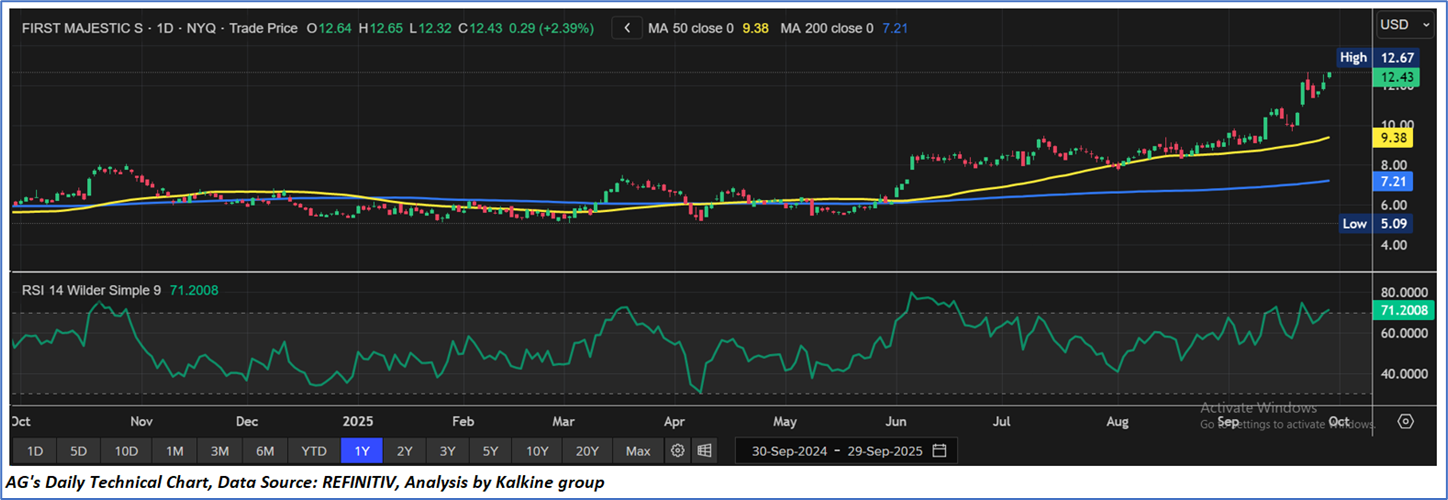
4.1 Price Performance and Technical Summary:
- AG has generated a return of approx. 50% in past three months. Similarly, a return of approx. 85.42% in past six months.
- The stock is around the higher end of its 52-week range of USD12.67 and 52-week low price of USD 5.09. Post the announcement of Q2FY25 revenue results the stock has given a return of almost 39.12%, with the current price broken above an important resistance of 11.50-USD 12.00.
- The price is currently trading between its long-term (200-day) SMA and its short-term (50-day) SMA, with the current RSI of 71.20.
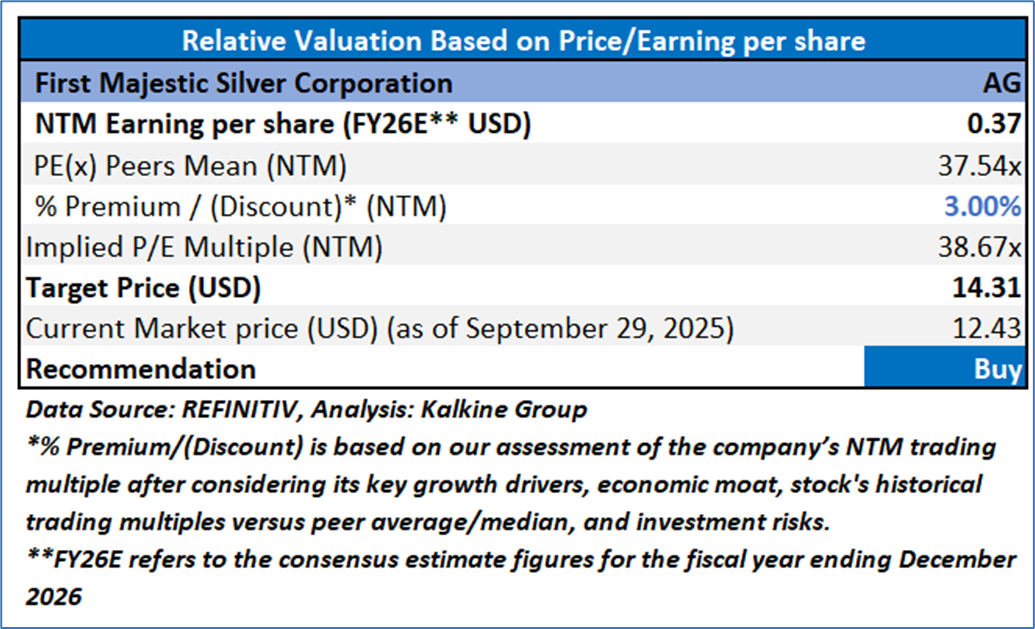
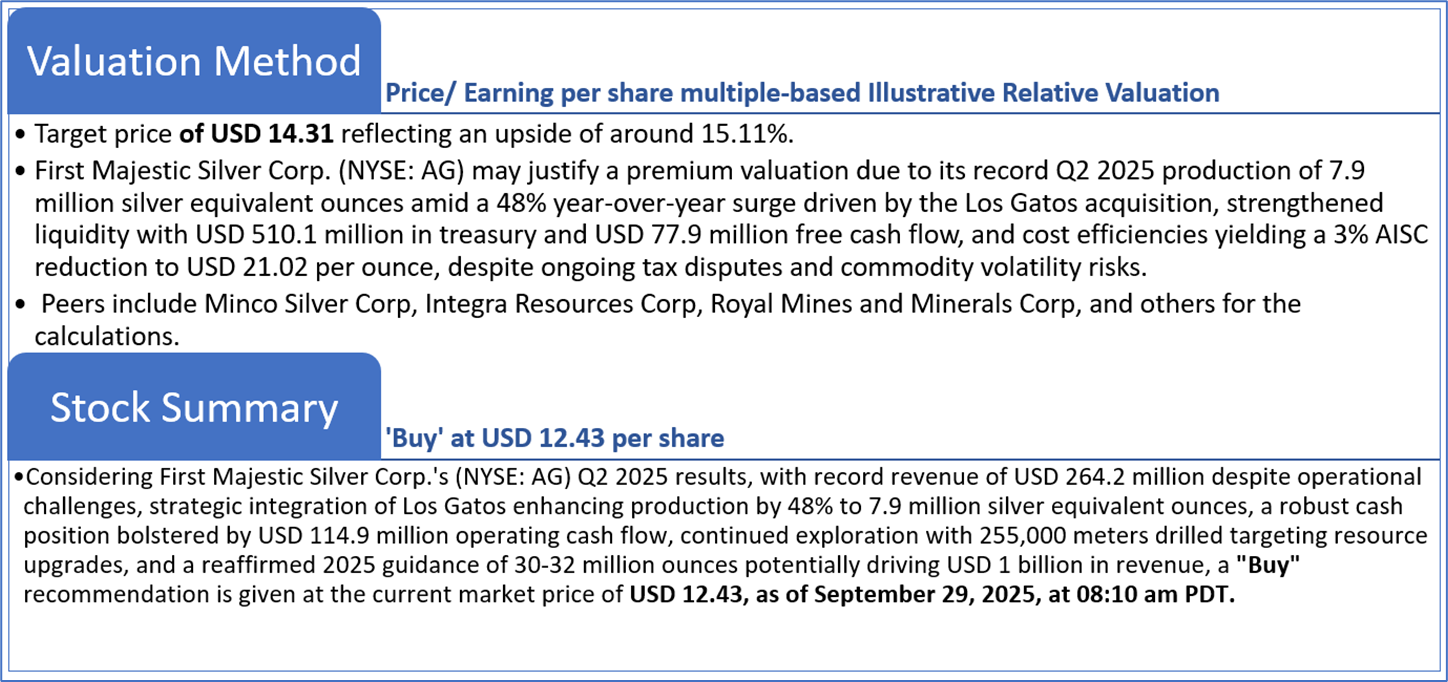
4.2 Fundamental Valuation
Valuation Methodology: Price/ Earnings Per Share Multiple Based Relative Valuation (Illustrative)
Note 1: Past performance is not a reliable indicator of future performance.
Note 2: The reference date for all price data, currency, technical indicators, support, and resistance levels as on September 29, 2025. The reference data in this report has been partly sourced from REFINITIV.
Note 3: Investment decisions should be made depending on an individual's appetite for upside potential, risks, holding duration, and any previous holdings. An 'Exit' from the stock can be considered if the Target Price mentioned as per the Valuation and or the technical levels provided has been achieved and is subject to the factors discussed above.
Note 4: Dividend Yield may vary as per the stock price movement.
Note 5: Kalkine reports are prepared based on the stock prices captured either from REFINITIV or Trading View. Typically, REFINITIV or Trading View may reflect stock prices with a delay which could be a lag of 25-30 minutes. There can be no assurance that future results or events will be consistent with the information provided in the report. The information is subject to change without any prior notice.
Technical Indicators Defined: -
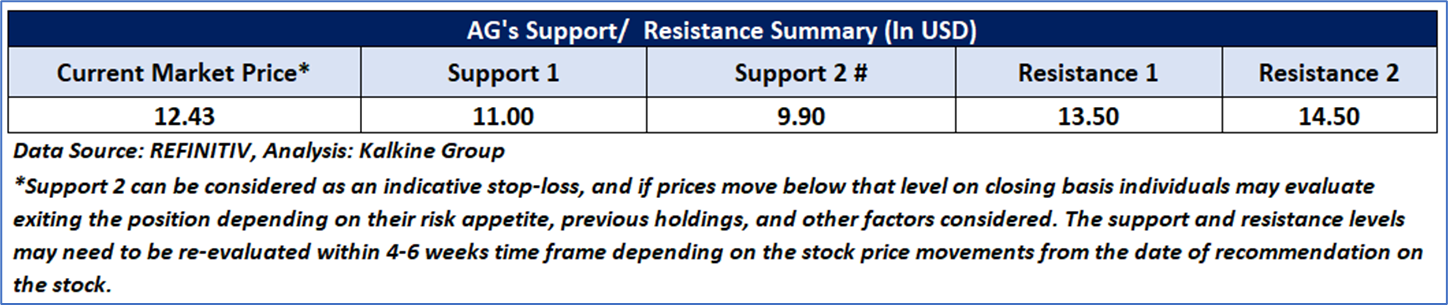
Support: A level at which the stock prices tend to find support if they are falling, and a downtrend may take a pause backed by demand or buying interest.
Resistance: A level at which the stock prices tend to find resistance when they are rising, and the uptrend may take a pause due to profit booking or selling interest.
Stop-loss: In general, it is a level to protect further losses in case of any unfavorable movement in the stock prices.
Disclaimer-
This report has been issued by Kalkine Limited (Company number 07903332), a private limited company, incorporated in England and Wales ("Kalkine”). Kalkine.co.uk and associated pages are published by Kalkine. Kalkine is authorised and regulated by the Financial Conduct Authority under reference number 579414.
The information in this report and on the Kalkine website has been prepared from a wide variety of sources, which Kalkine, to the best of its knowledge and belief, considers accurate. Kalkine has made every effort to ensure the reliability of information contained in its reports, newsletters and websites. All information represents our views at the date of publication and may change without notice. The information in this report does not constitute an offer to sell securities or other financial products or a solicitation of an offer to buy securities or other financial products. Our reports contain non personalized recommendations to invest in securities and other financial products.
Kalkine does not offer financial advice based upon your personal financial situation or goals, and we shall not be held liable for any investment or trading losses you may incur by using the opinions expressed in our reports, publications, market updates, news alerts and corporate profiles. Kalkine does not intend to exclude any liability which it is not permitted to exclude under applicable law or regulation. Kalkine’s non-personalised advice does not in any way endorse or recommend individuals, investment products or services for your personal financial situation. You should discuss your portfolios and the risk tolerance level appropriate for your personal financial situation, with a professional authorised financial planner and adviser. You should be aware that the value of any investment and the income from it can go down as well as up and you may not get back the amount invested.
Please also read our Terms & Conditions for further information. Employees and/or associates of Kalkine and its related entities may hold interests in the securities or other financial products covered in this report or on the Kalkine website. Any such employees and associates are required to comply with certain safeguards, procedures and disclosures as required by law.
Kalkine Media Limited, an affiliate of Kalkine, may have received, or be entitled to receive, financial consideration in connection with providing information about certain entity(s) covered on its website including entities covered in this report.
Past performance is not a reliable indicator of future performance.

 Please wait processing your request...