Company Overview: Mitchells & Butlers PLC (LON: MAB) is a United Kingdom-based company that operates restaurants, pubs, and bars. The Company provides a choice of eating and drinking-out experiences through its brands. It has approximately 1,700 businesses, including restaurant and pub brands, such as All Bar One, Browns, Castle, Ember Inns, Harvester, High St, Innkeeper's Collection, Miller & Carter, Nicholson's, O'Neill's, Premium Country Pubs, Sizzling Pubs, Stonehouse Pizza & Carvery, Toby Carvery, ALEX, and Vintage Inns. INTERNATIONAL WORKPLACE GROUP PLC (LON: IWG) is a Switzerland based Company operating in the real estate industry. The Company operates under the Regus, Signature, Spaces, HQ, Basepoint, Stop&Work, Too, The Clubhouse, Bizdojo, OpenOffice, No18, Central Working and Copernic brands. This Report covers the Price Action and Technical Indicators Analysis along with the Target Levels, Stop Loss, Support Levels, Resistance Levels, and Recommendations on these two stocks.
FTSE All-Share Index (.FTAS) Market Round-Up
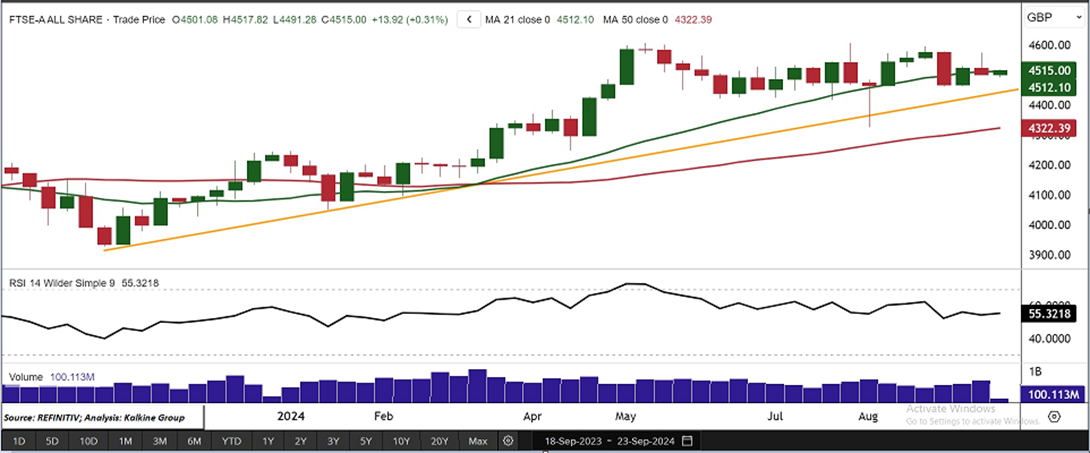
Last week the FTSE All-Share Index (.FTAS) settled on a negative note, despite the bullish move from the US equity markets. Notably, FTAS settled at 4501.80 with loss of -0.47% for the week ending September 20, 2024. The recent move in the domestic indices is majorly led by the positive indications from the global equity markets.
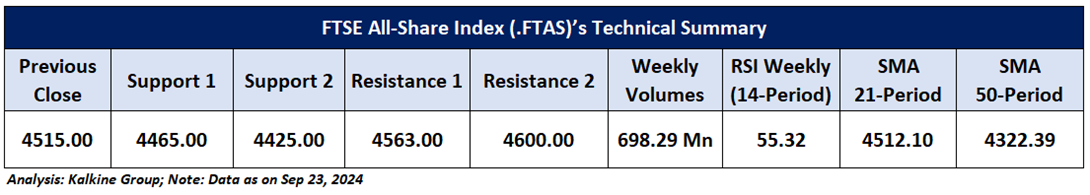
From a technical perspective, the index maintains a bullish trend, trading above a key ascending trend line and a significant horizontal support level. This positioning indicates a strong possibility of further upward movement. The 14-period RSI (Relative Strength Index) is also rising, currently at 55.32, which supports the bullish sentiment. Furthermore, with the current market price (CMP) above the 50-period SMA, these levels will likely serve as crucial support zones, enhancing the overall positive outlook.
Global Markets Wrap-Up
Wall Street indices inched higher in the last week and settled on a positive note. Notably, the S&P 500 settled at 5702.55 with a gain of ~1.36%, while NASDAQ Composite Index settled at 17948.32 with a gain of ~1.49% for the week ending September 20, 2024.
Having understood the US market performance over the past week, taking cues from major global news, and based on technical analysis of the FTSE All-Share Index (.FTAS) for the upcoming week, now have a look at the two LSE-listed.
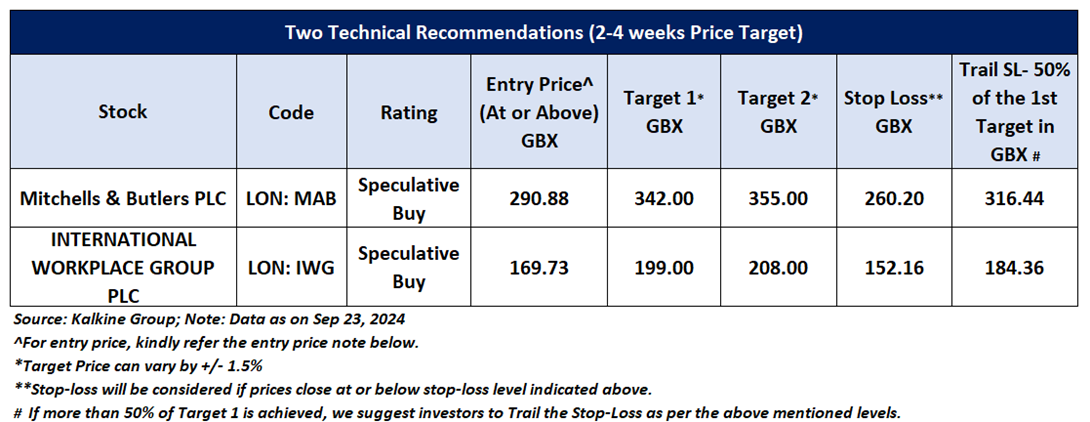
stocks pick from the technical analysis standpoint. Noted below are the recommendations based on entry price, target prices, and stop-loss Mitchells & Butlers PLC (LON: MAB) and INTERNATIONAL WORKPLACE GROUP PLC (LON: IWG) for the next 2-4 weeks duration:
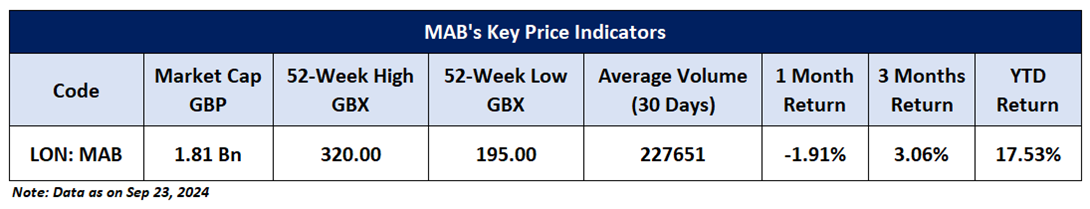
Mitchells & Butlers PLC (LON: MAB) Noted below are the key price indicators for the recommended stock:
Price Action Analysis (on the Weekly Chart)
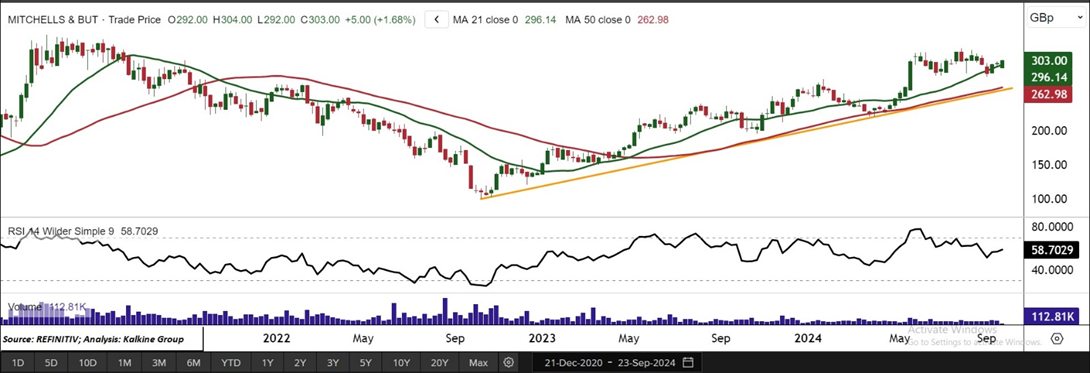
On the weekly chart, MAB is displaying strong bullish signals. The stock is trading above a critical horizontal support zone and an ascending trendline, indicating significant upward momentum. Prices have consistently held above these support levels, suggesting further potential for gains. The stock is now nearing its next resistance level at GBX 342.00, which could be tested in the short term (2-4 weeks). A sustained breakout above GBX 342.00, supported by rising volumes, may drive the stock towards the next resistance at GBX 355.00.
Technical Indicators Analysis (On the Weekly Chart)
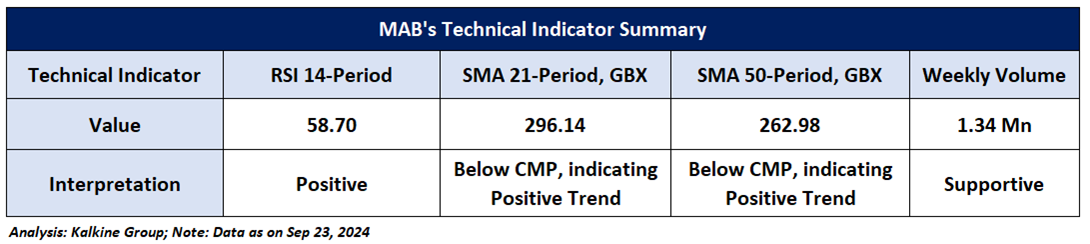
The RSI moving in the positive zone with a reading of 58.70 suggests that the stock has some bullish momentum, supported by volumes indicating increased trading activity. The CMP is trading above the trend-following indicators 21-period & 50-period SMAs and may act as a small support level.
General Recommendation:
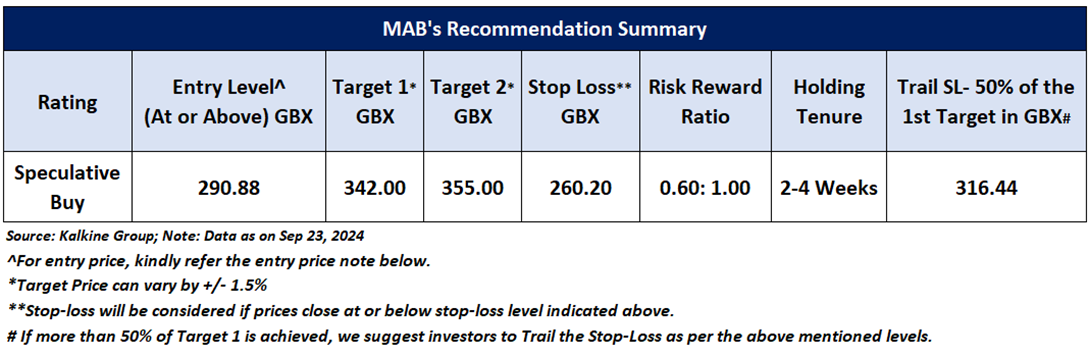
As per the above-mentioned price action and technical indicators analysis, Mitchells & Butlers PLC (LON: MAB) is looking technically well-placed on the chart, and a ‘Speculative Buy’ recommendation has been given on the stock. Investment decisions should be made depending on an individual’s appetite for upside potential, risks, and any previous holdings. This recommendation is purely based on technical analysis, and fundamental analysis has not been considered in this report. The summary of recommendation is as follow:
INTERNATIONAL WORKPLACE GROUP PLC (LON: IWG)
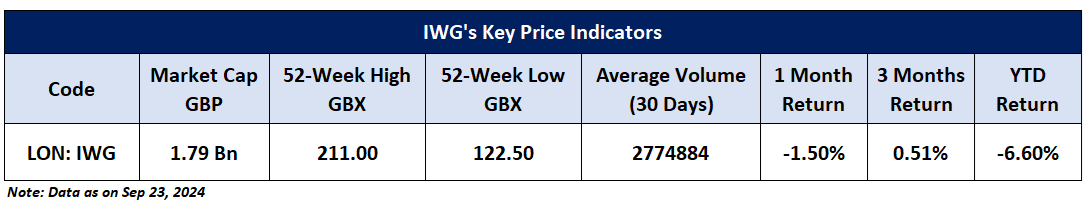
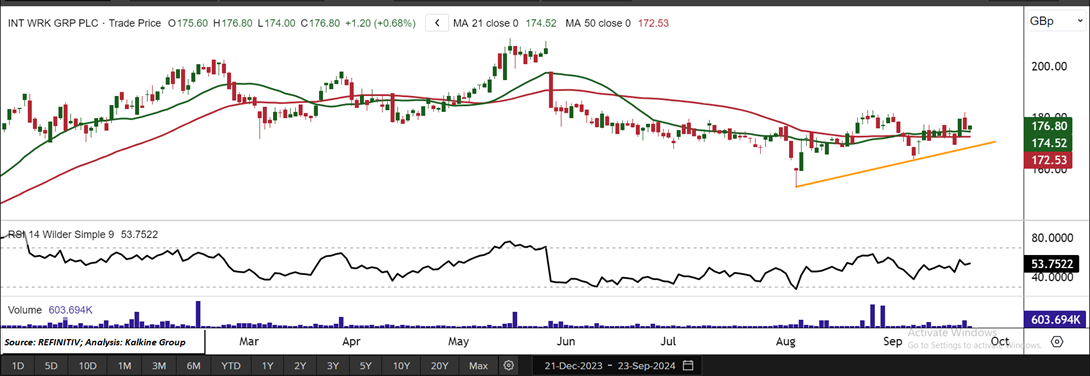
Price Action Analysis (on the Daily Chart)
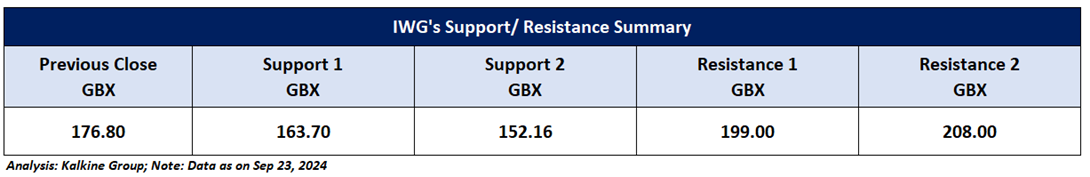
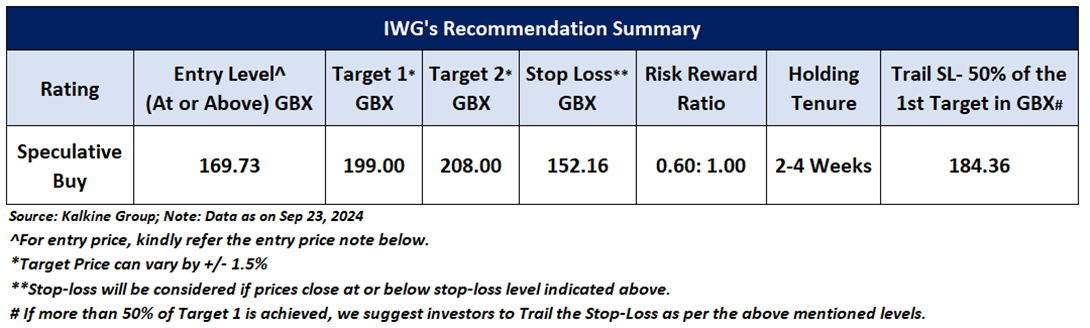
On the daily chart, IWG is trading above an ascending trendline, demonstrating strong upward momentum. The stock has consistently held above this support level, signalling the potential for additional gains. Currently, IWG is nearing its next resistance level at GBX 199.00, which may be tested in the short term (2-4 weeks). If the stock breaks above GBX 199.00 with increasing volumes, it could drive prices toward the next resistance at GBX 208.00.Top of Form
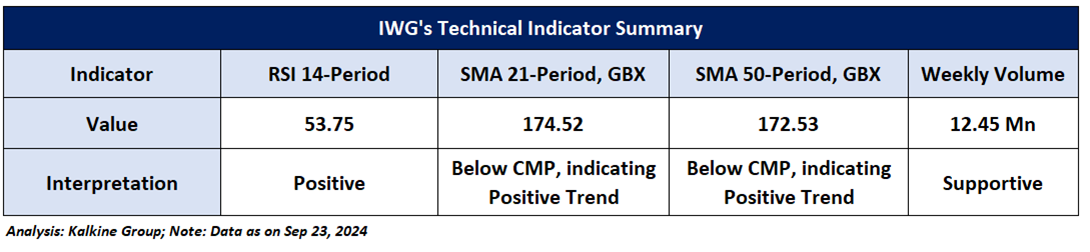
Technical Indicators Analysis (On the Daily Chart)
The RSI moving in the positive zone with a reading of 53.75 suggests that the stock has some bullish momentum, supported by volumes indicating increased trading activity. The CMP is trading above the trend-following indicators 21-period & 50-period SMAs and may act as a small support level.
General Recommendation:
As per the above-mentioned price action and technical indicators analysis, INTERNATIONAL WORKPLACE GROUP PLC looking technically well-placed on the chart, and a ‘Speculative Buy’ recommendation has been given on the stock. Investment decisions should be made depending on an individual’s appetite for upside potential, risks, and any previous holdings. This recommendation is purely based on technical analysis, and fundamental analysis has not been considered in this report. The summary of recommendation is as follow:
Markets are trading in a highly volatile zone currently due to certain macro-economic and geopolitical tensions prevailing. Therefore, it is prudent to follow a cautious approach while investing.
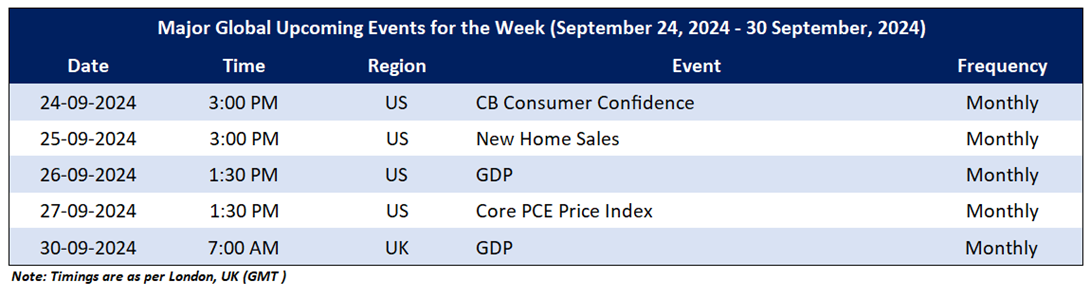
Upcoming Major Global Economic Events
Market events occur on a day-to-day basis depending on the frequency of the data and generally include an update on employment, inflation, GDP, consumer sentiments, etc. Noted below are the upcoming week's major global economic events that could impact the FTSE All-Share Index and listed stocks’ prices.
Related Risks: This report may be looked at from a high-risk perspective and recommendations are provided for a short duration. Recommendations provided in this report are solely based on technical parameters, and the fundamental performance of the stocks has not been considered in the decision-making process. Other factors which could impact stock prices include market risks, regulatory risks, interest rates risks, currency risks, social and political instability risks, etc.
Note 1: Individuals can consider exiting from the stock if the Target Price mentioned as per the technical analysis has been achieved and subject to the factors discussed above.
Note 2: How to Read the Charts?
The Green colour line reflects the 21-period moving average while the red line indicates the 50-period moving average. SMA helps to identify existing price trends. If the prices are trading above the 21-period and 50-period moving average, then it shows prices are currently trading in a bullish trend.
The Black colour line in the chart’s lower segment reflects the Relative Strength Index (14-Period) which indicates price momentum and signals momentum in trend. A reading of 70 or above suggests overbought status while a reading of 30 or below suggests an oversold status.
The Blue colour bars in the chart’s lower segment show the volume of the stock. The volume is the number of shares that changed hands during a given day. Stocks with high volumes are more liquid than stocks with lesser volume and liquidity in stocks helps in easier and faster execution of the order.
The Orange colour lines are the trend lines drawn by connecting two or more price points and used for trend identification purposes. The trend line also acts as a line of support and resistance.
Technical Indicators Defined: -
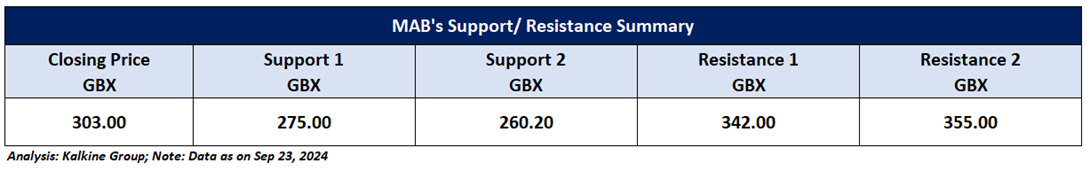
Support: A level at which the stock prices tend to find support if they are falling, and a downtrend may take a pause backed by demand or buying interest. Support 1 refers to the nearby support level for the stock and if the price breaches the level, then Support 2 may act as the crucial support level for the stock.
Resistance: A level at which the stock prices tend to find resistance when they are rising, and an uptrend may take a pause due to profit booking or selling interest. Resistance 1 refers to the nearby resistance level for the stock and if the price surpasses the level, then Resistance 2 may act as the crucial resistance level for the stock.
Stop-loss: In general, it is a level to protect further losses in case of unfavorable movement in the stock prices.
Risk Reward Ratio: Risk reward ratio is the difference between an entry point to a stop loss and profit level. This report is based on ~60% Stop Loss of the Target 1 from the entry point.
A trailing stop-loss is a modification of stop-loss in case of favourable movement in the price to protect the gains. Individuals can Trail the Stop-Loss as per the aforementioned levels if the stock price achieves more than 50% of the Target 1. Individuals should consider exiting from the position as per the Trailing Stop-Loss level if the price starts moving downwards after achieving more than 50% of the Target 1.
The reference date for all price data, currency, technical indicators, support, and resistance levels is September 23, 2024. The reference data in this report has been partly sourced from REFINITIV.
Abbreviations
CMP: Current Market Price
SMA: Simple Moving Average
GBP: British pound sterling
GBX: British pence sterling
RSI: Relative Strength Index
Note: Trading decisions require a thorough analysis by individuals. Technical reports in general chart out metrics that may be assessed by individuals before any stock evaluation. The above are illustrative analytical factors used for evaluating stocks; other parameters can be looked at along with additional risks per se. Past performance is neither an indicator nor a guarantee of future performance.
Past performance is not a reliable indicator of future performance.

 Please wait processing your request...