Company Overview: Marks and Spencer Group PLC (LON: MKS) is a United Kingdom-based holding company. The company is engaged in clothing and home and food company. The company operates through five segments: UK clothing & home, UK food, international, ocado, and all other segments. J Sainsbury PLC (LON: SBRY) is a UK-based retail company listed at the FTSE 100. It operates across three core sectors: food retail, general merchandise and clothing, and financial services. This Report covers the Price Action and Technical Indicators Analysis along with the Target Levels, Stop Loss, Support Levels, Resistance Levels, and Recommendations on these two stocks.
FTSE All-Share Index (.FTAS) Market Round-Up
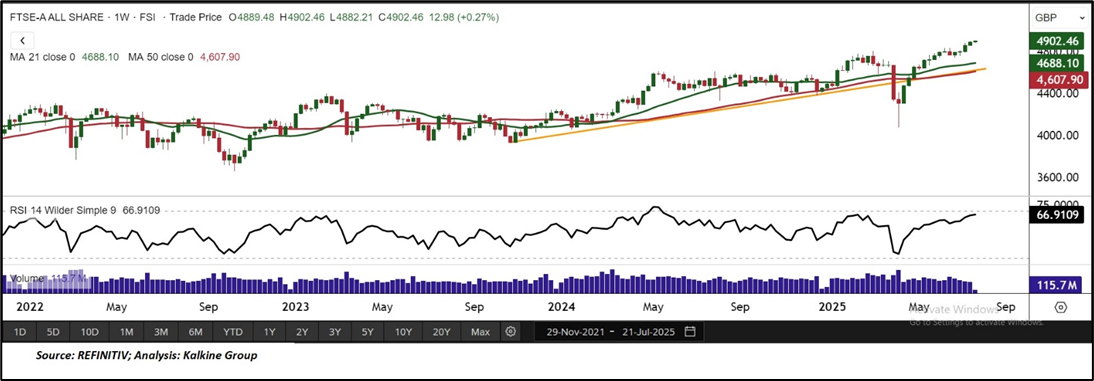
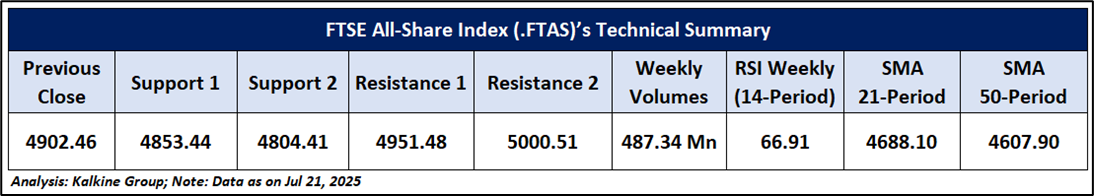
Last week, the FTSE All-Share Index (.FTAS) closed higher at 4889.48, marking a weekly increase of approximately 0.65% for the period ending July 18th, 2025. The gains were largely supported by robust performance in U.S. stock markets, which boosted global investor confidence and positively influenced sentiment among UK traders, sustaining the ongoing optimistic momentum for British equities.
From a technical perspective, the index continues to exhibit a bullish tone, trading above a key ascending trendline and strong horizontal support, indicating room for further upside. The 14-period RSI at 66.91 remains in positive territory, highlighting persistent bullish momentum. Price action above both the 21-period and 50-period Simple Moving Averages reinforces the presence of solid dynamic support. This technical alignment suggests buyers remain in control, with dips likely to be bought into. If current support zones are respected, the index may extend its gains, and a breakout above immediate resistance could trigger the next leg of the rally, further strengthening the bullish structure.
Global Markets Wrap-Up
Wall Street ended the week on a positive note, with major indices extending their recent upward momentum. For the week ending July 18th, 2025, the S&P 500 rose 0.45% to close at 6,296.79, while the NASDAQ Composite advanced 1.51% to finish at 20,895.65.
Having understood the US market performance over the past week, taking cues from major global news, and based on technical analysis of the FTSE All-Share Index (.FTAS) for the upcoming week, now have a look at the two LSE-listed.
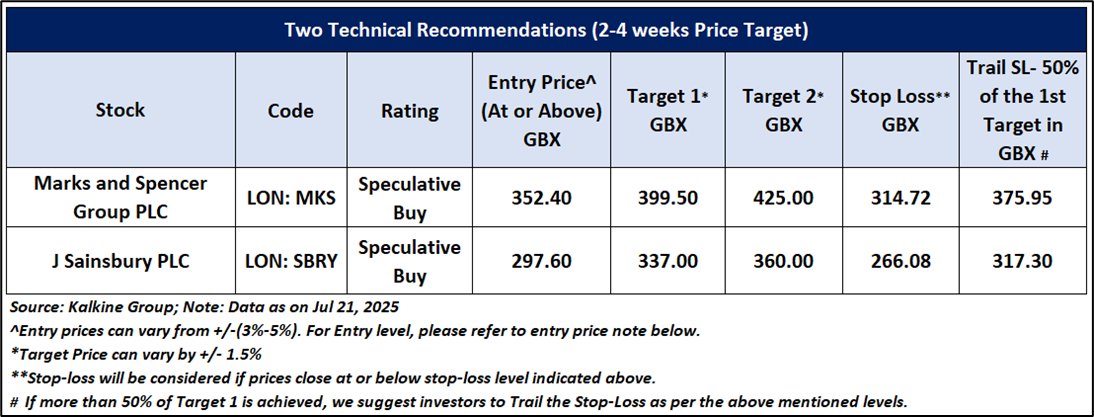
stocks pick from the technical analysis standpoint. Noted below are the recommendations based on entry price, target prices, and stop-loss MARKS AND SPENCER GROUP PLC (LON: MKS) and J Sainsbury PLC (LON: SBRY) for the next 2-4-week duration:
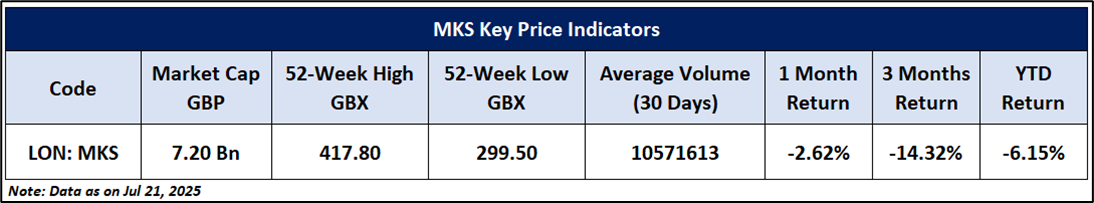
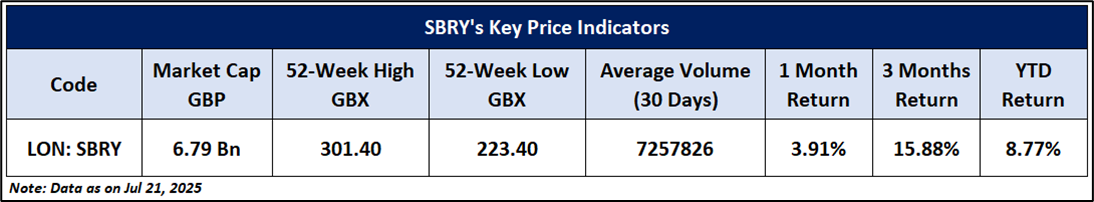
MARKS AND SPENCER GROUP PLC (LON: MKS) Noted: below are the key price indicators for the recommended stock:
Price Action Analysis (on the Daily Chart)
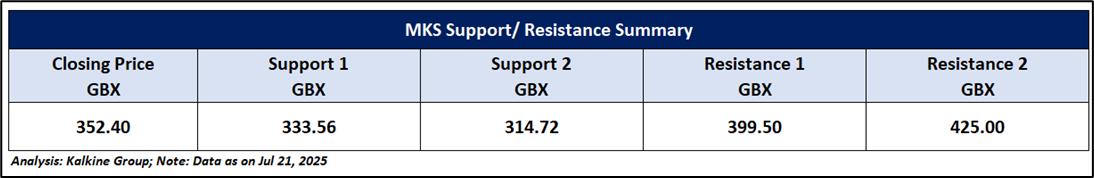
On the daily chart, MKS maintains a strong bullish trend, holding above a crucial horizontal support level. A series of positive candlesticks and a bounce from the 21-period Simple Moving Average indicate renewed buying interest and growing market confidence. The stock’s ability to stay above this support reflects solid momentum with no immediate signs of reversal. Attention now turns to the key resistance at GBX 399.50. A decisive breakout above this level, particularly if accompanied by high volume, could propel the stock toward the next target around GBX 425.00. Overall, the technical outlook remains positive for the week.
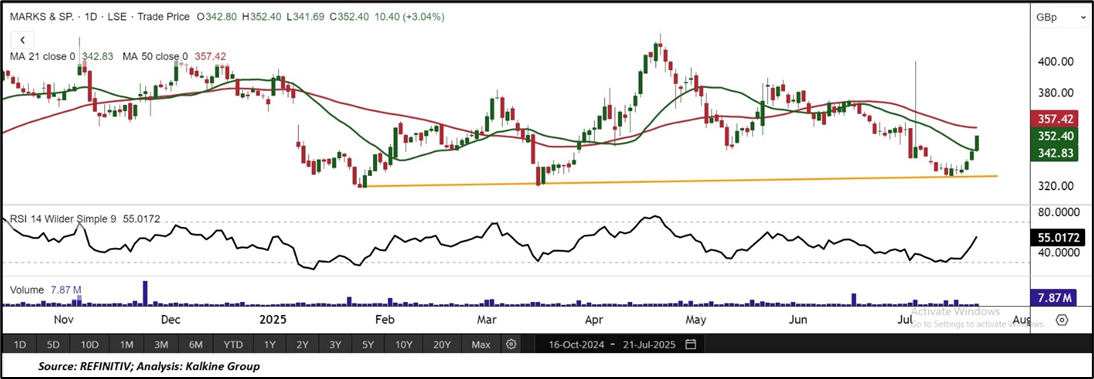
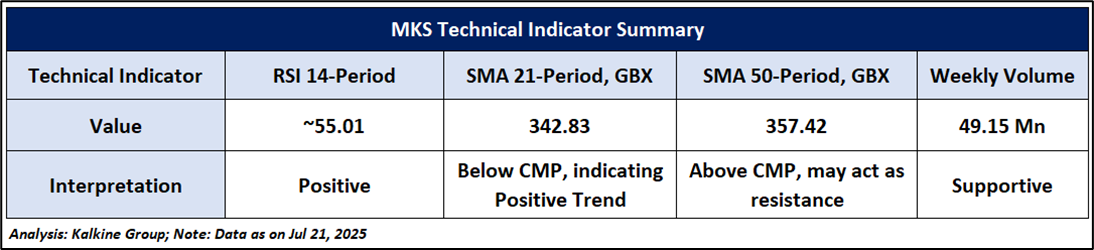
Technical Indicators Analysis (On the Daily Chart)
The RSI moving in the positive zone with a reading of 55.01 suggests that the stock has some bullish momentum, supported by volumes indicating increased trading activity. The CMP is trading above the trend-following indicators 21-periods (SMA) may act as a small support level.
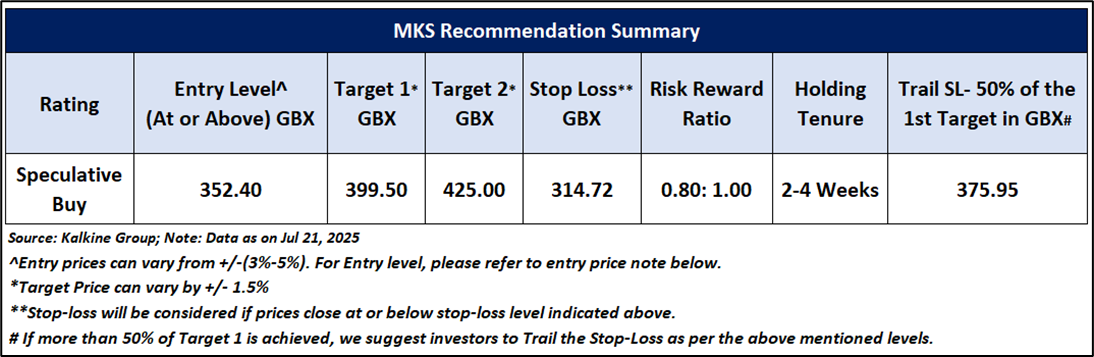
General Recommendation:
As per the above-mentioned price action and technical indicators analysis, MARKS AND SPENCER GROUP PLC (LON: MKS) is looking technically well-placed on the chart, and a ‘Speculative Buy’ recommendation has been given on the stock. Investment decisions should be made depending on an individual’s appetite for upside potential, risks, and any previous holdings. This recommendation is purely based on technical analysis, and fundamental analysis has not been considered in this report. The summary of recommendation is as follow:
J Sainsbury PLC (LON: SBRY)
Price Action Analysis (on the Daily Chart)
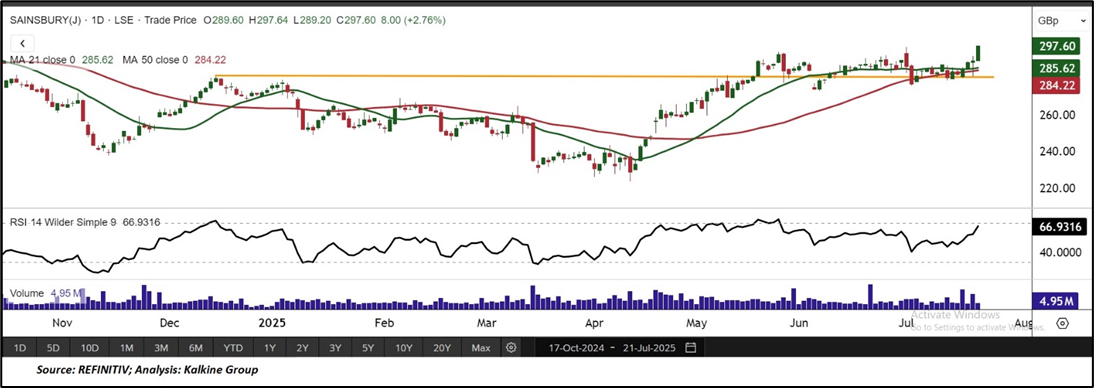
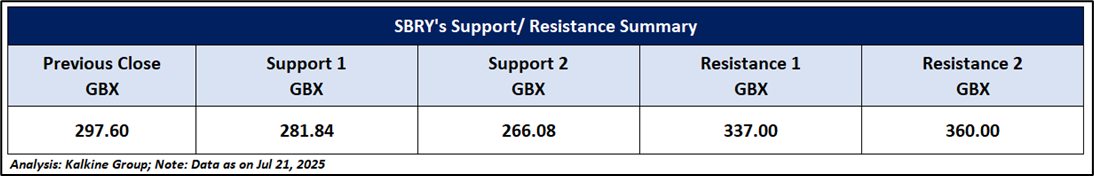
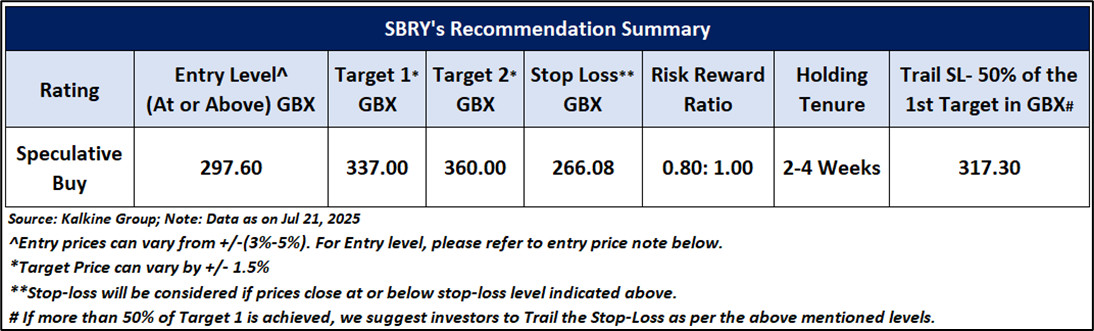
On the daily chart, SBRY exhibits continued bullish strength, trading above a key horizontal support level and an ascending trendline, which confirms its solid uptrend. Bullish divergence combined with recent positive candlestick formations signals increasing buying pressure and confidence in the rally. The stock is approaching a significant resistance level at GBX 337.00, likely to be challenged within the next 2 to 4 weeks. A clear breakout above this zone, especially on higher volume, could drive the price toward the next target at GBX 360.00. Overall, the technical outlook remains strong, indicating promising upside potential in the near term.
Technical Indicators Analysis (On the Daily Chart)
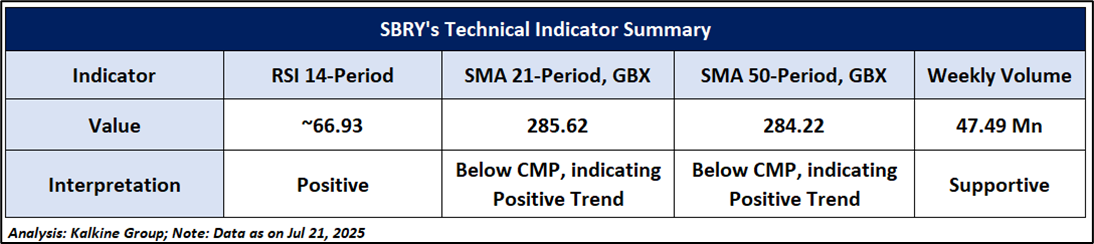
The RSI moving in the positive zone with a reading of 66.93 suggests that the stock has some bullish momentum, supported by volumes indicating increased trading activity. The CMP is trading above the trend-following indicators 21-period and 50-periods SMAs and may act as a small support level.
General Recommendation:
As per the above-mentioned price action and technical indicators analysis, J Sainsbury PLC (LON: SBRY) looking technically well-placed on the chart, and a ‘Speculative Buy’ recommendation has been given on the stock. Investment decisions should be made depending on an individual’s appetite for upside potential, risks, and any previous holdings. This recommendation is purely based on technical analysis, and fundamental analysis has not been considered in this report. The summary of recommendation is as follow:
Markets are trading in a highly volatile zone currently due to certain macro-economic and geopolitical tensions prevailing. Therefore, it is prudent to follow a cautious approach while investing.
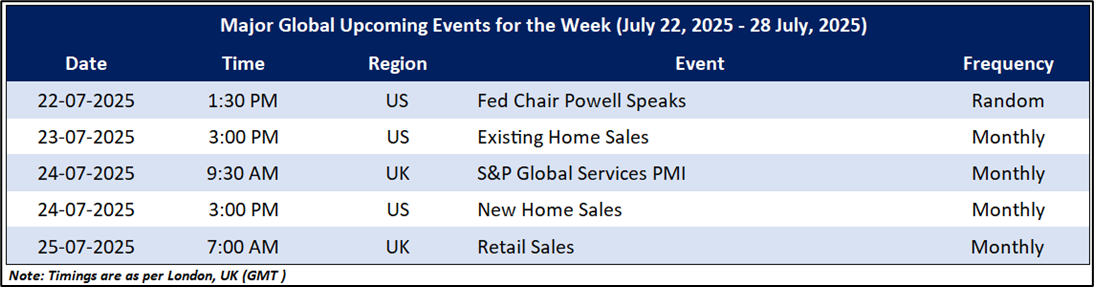
Upcoming Major Global Economic Events
Market events occur on a day-to-day basis depending on the frequency of the data and generally include an update on employment, inflation, GDP, consumer sentiments, etc. Noted below are the upcoming week's major global economic events that could impact the FTSE All-Share Index and listed stocks’ prices.
Related Risks: This report may be looked at from a high-risk perspective and recommendations are provided for a short duration. Recommendations provided in this report are solely based on technical parameters, and the fundamental performance of the stocks has not been considered in the decision-making process. Other factors which could impact stock prices include market risks, regulatory risks, interest rates risks, currency risks, social and political instability risks, etc.
Note 1: Past performance is not a reliable indicator of future performance.
Note 2: Individuals can consider existing from the stock if the Target Price mentioned as per the technical analysis has been achieved and subject to the factors discussed above.
Note 3: Kalkine reports are prepared based on the stock prices captured either from the London Stock Exchange (LSE) and or REFINITIV. Typically, both sources (LSE and or REFINITIV) may reflect stock prices with a delay which could be a lag of 15-20 minutes. There can be no assurance that future results or events will be consistent with the information provided in the report. The information is subject to change without any prior notice.
Note 4: How to Read the Charts?
The Green colour line reflects the 21-period moving average while the red line indicates the 50-period moving average. SMA helps to identify existing price trends. If the prices are trading above the 21-period and 50-period moving average, then it shows prices are currently trading in a bullish trend.
The Black colour line in the chart’s lower segment reflects the Relative Strength Index (14-Period) which indicates price momentum and signals momentum in trend. A reading of 70 or above suggests overbought status while a reading of 30 or below suggests an oversold status.
The Blue colour bars in the chart’s lower segment show the volume of the stock. The volume is the number of shares that changed hands during a given day. Stocks with high volumes are more liquid than stocks with lesser volume and liquidity in stocks helps in easier and faster execution of the order.
The Orange colour lines are the trend lines drawn by connecting two or more price points and used for trend identification purposes. The trend line also acts as a line of support and resistance.
Technical Indicators Defined: -
Support: A level at which the stock prices tend to find support if they are falling, and a downtrend may take a pause backed by demand or buying interest. Support 1 refers to the nearby support level for the stock and if the price breaches the level, then Support 2 may act as the crucial support level for the stock.
Resistance: A level at which the stock prices tend to find resistance when they are rising, and an uptrend may take a pause due to profit booking or selling interest. Resistance 1 refers to the nearby resistance level for the stock and if the price surpasses the level, then Resistance 2 may act as the crucial resistance level for the stock.
Stop-loss: In general, it is a level to protect further losses in case of unfavorable movement in the stock prices.
Risk Reward Ratio: Risk reward ratio is the difference between an entry point to a stop loss and profit level. This report is based on ~80% Stop Loss of the Target 1 from the entry point.
A trailing stop-loss is a modification of stop-loss in case of favourable movement in the price to protect the gains. Individuals can Trail the Stop-Loss as per the aforementioned levels if the stock price achieves more than 50% of the Target 1. Individuals should consider exiting from the position as per the Trailing Stop-Loss level if the price starts moving downwards after achieving more than 50% of the Target 1.
The reference date for all price data, currency, technical indicators, support, and resistance levels is July 21st, 2025. The reference data in this report has been partly sourced from REFINITIV.
Abbreviations
CMP: Current Market Price
SMA: Simple Moving Average
GBP: British pound sterling
GBX: British pence sterling
RSI: Relative Strength Index
Note: Trading decisions require a thorough analysis by individuals. Technical reports in general chart out metrics that may be assessed by individuals before any stock evaluation. The above are illustrative analytical factors used for evaluating stocks; other parameters can be looked at along with additional risks per se. Past performance is neither an indicator nor a guarantee of future performance.
Past performance is not a reliable indicator of future performance.

 Please wait processing your request...