Company Overview: CAB Payments Holdings PLC (LON: CABP) is an FTSE All-Share index listed United Kingdom-based holding company for crown agent’s bank. The company is engaged in business-to-business cross-border payments and foreign exchange (FX), specializing in hard-to-reach markets. GENinCode PLC (LON: GENI) is a United Kingdom-based predictive genetics company focused on the prevention of cardiovascular disease and ovarian cancer. The company operates business units in the United Kingdom, Europe through GENinCode S.L.U, and in the United States through GENinCode U.S. Inc. Its predictive technology provides patients and physicians with preventive care and treatment strategies. This Report covers the Price Action and Technical Indicators Analysis along with the Target Levels, Stop Loss, Support Levels, Resistance Levels, and Recommendations on these two stocks.
FTSE All-Share Index (.FTAS) Market Round-Up
Last week, the FTSE All-Share Index (.FTAS) closed at 5,213.58, slipping 0.53% for the week ended December 05th, 2025. Despite the supportive backdrop from strong U.S. markets, global sentiment remained measured, keeping investors cautious but still engaged in selective opportunities. This tempered tone helped the British indices ease slightly while preserving an underlying sense of resilience, with the market holding its ground rather than showing any signs of deeper weakness.
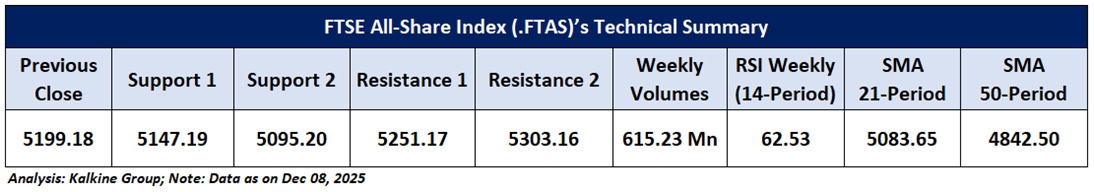
From a technical perspective, the index continues to display a constructive upward bias, trading comfortably above a key ascending trendline and horizontal support zone. The 14-period RSI at 62.53 reflects healthy momentum, while the price staying above both the 21-period and 50-period SMAs reinforces strength across short- and medium-term timeframes. Overall, the setup remains supportive of further upside as long as the index respects its current support structure. A firm break above the immediate resistance zone could open the door to additional gains, with any near-term pullbacks likely to draw buyers around established support levels.
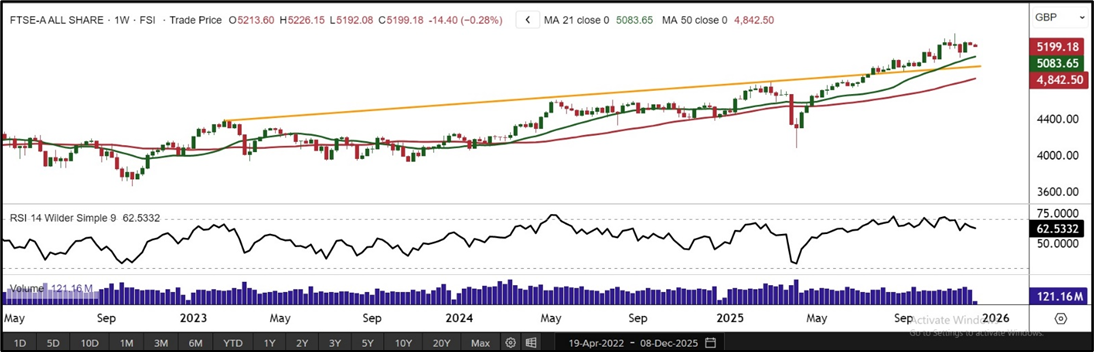
Source: REFINITIV; Analysis: Kalkine Group
Global Markets Wrap-Up
Wall Street closed the week on a positive note, with major benchmarks extending their upside momentum. For the week ending December 05th, 2025, the S&P 500 advanced 0.31% to settle at 6,870.40, while the NASDAQ Composite gained 0.91% to close at 23,578.13.
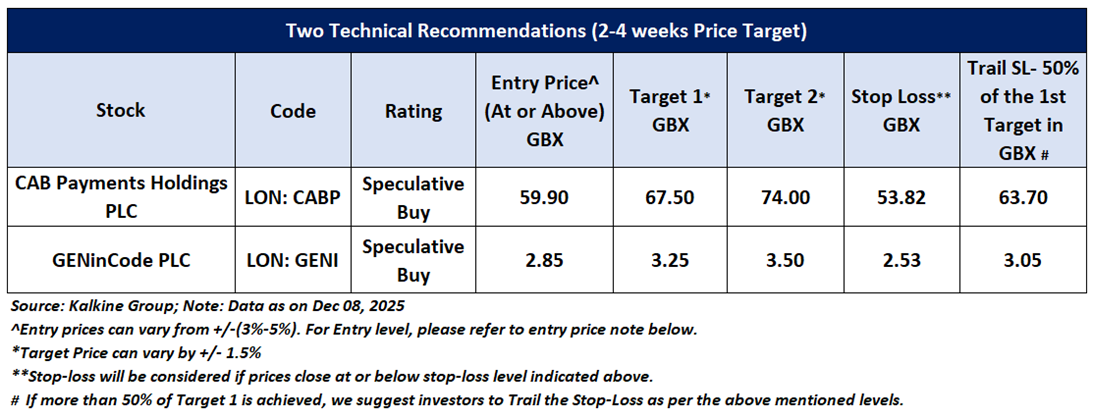
Having understood the US market performance over the past week, taking cues from major global news, and based on technical analysis of the FTSE All-Share Index (.FTAS) for the upcoming week, now have a look at the two LSE-listed. stocks pick from the technical analysis standpoint. Noted below are the recommendations based on entry price, target prices, and stop-loss CAB PAYMENTS HOLDINGS PLC (LON: CABP) and GENinCode PLC (LON: GENI) for the next 2-4-week duration:
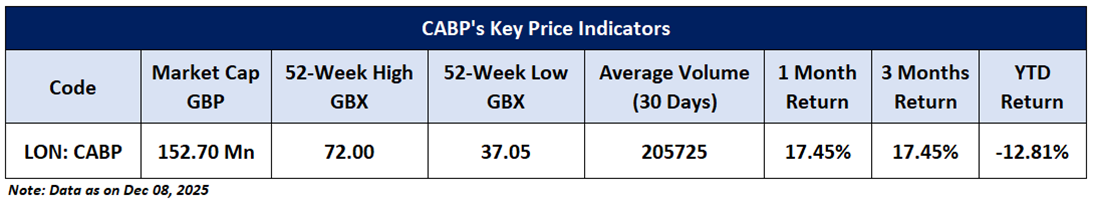
CAB PAYMENTS HOLDINGS PLC (LON: CABP) Noted: below are the key price indicators for the recommended stock:
Price Action Analysis (on the Daily Chart)
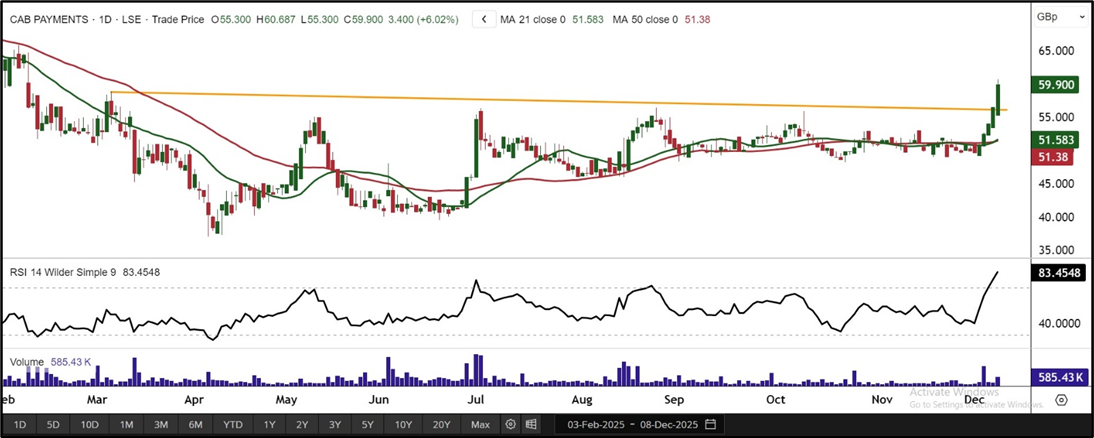
On the daily chart, CABP is showing continued upward momentum, holding firm above a key horizontal support zone. The stock’s sustained position above the 50-period Simple Moving Average underscores the ongoing bullish structure. Remaining above this level suggests that the prevailing trend is intact, with potential for a measured upside move. Attention now turns to the resistance area around GBX 67.50, where a breakout could pave the way toward GBX 74.00. Overall, the technical setup reflects steady strength within a well-supported uptrend.
Source: REFINITIV; Analysis: Kalkine Group
Technical Indicators Analysis (On the Daily Chart)
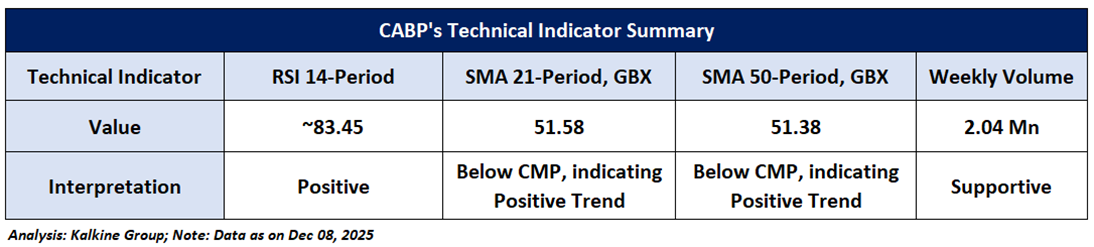
The RSI moving in the positive zone with a reading of 83.45 suggests that the stock has some bullish momentum, supported by volumes indicating increased trading activity. The CMP is trading above the trend-following indicators 21-periods (SMA) and 50-periods (SMA) may act as a small support level.
General Recommendation:
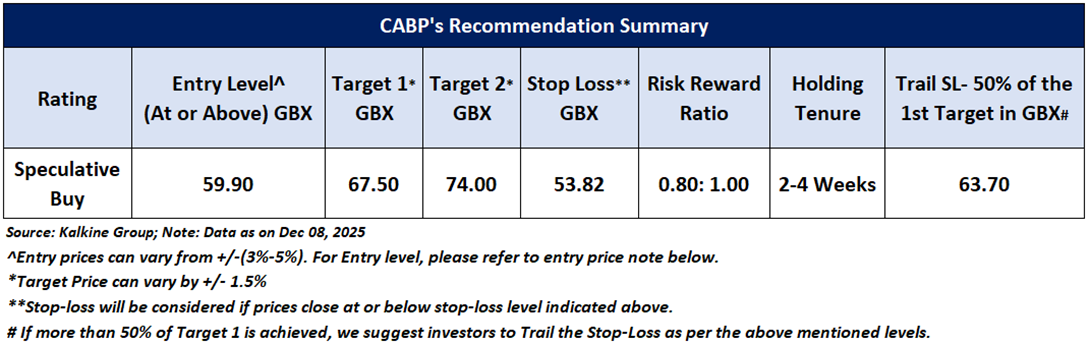
As per the above-mentioned price action and technical indicators analysis, CAB PAYMENTS HOLDINGS PLC (LON: CABP) is looking technically well-placed on the chart, and a ‘Speculative Buy’ recommendation has been given on the stock. Investment decisions should be made depending on an individual’s appetite for upside potential, risks, and any previous holdings. This recommendation is purely based on technical analysis, and fundamental analysis has not been considered in this report. The summary of recommendation is as follow:
GENinCode PLC (LON: GENI)
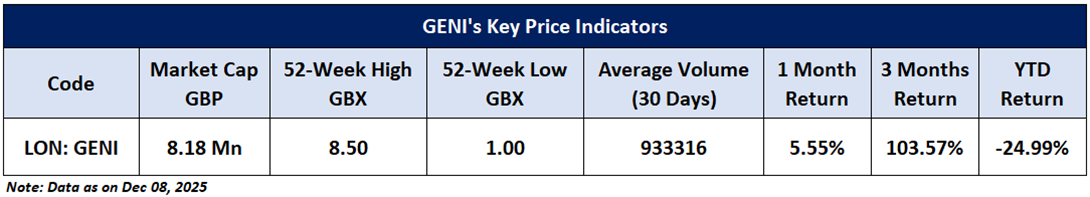
Price Action Analysis (on the daily Chart)
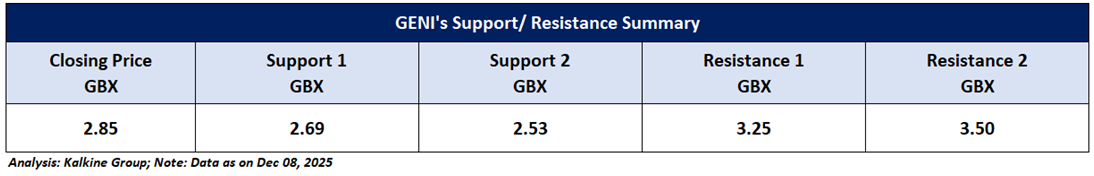
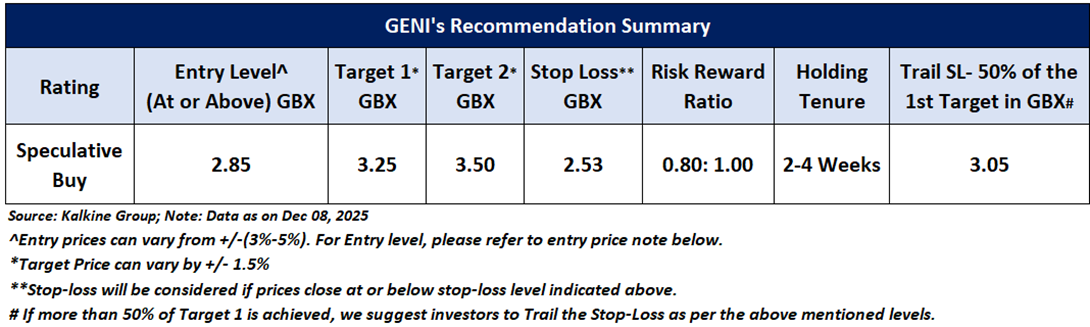
GENI continues to show firm upward momentum on the daily chart, holding above important horizontal support and a rising trendline, which reflects solid underlying strength. The presence of bullish divergence adds confidence that the broader uptrend remains intact. The stock is approaching a key resistance zone near GBX 3.25, which could be tested over the next 2–4 weeks. A sustained move above this area, supported by improving volumes, may open the way toward GBX 3.50. Overall, the short- to medium-term outlook remains constructive.
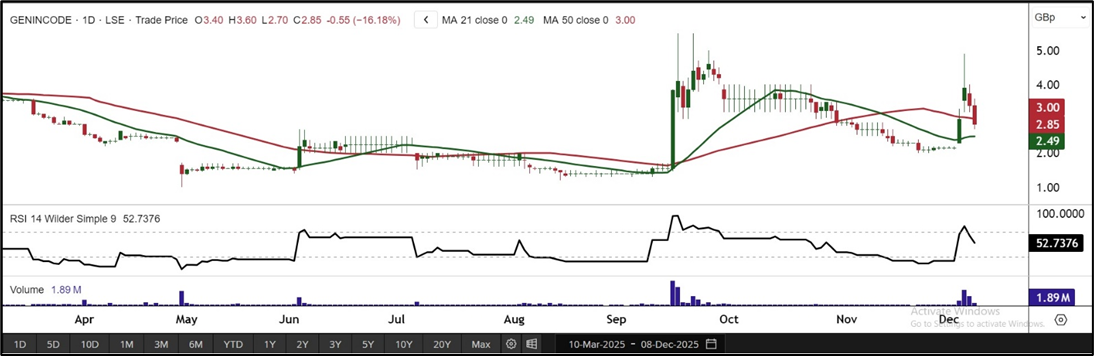
Source: REFINITIV; Analysis: Kalkine Group
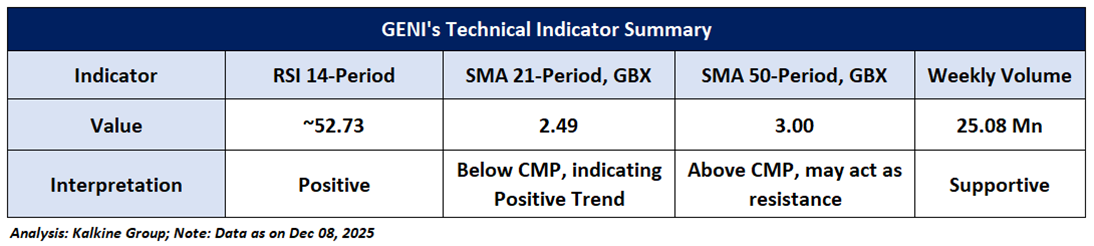
Technical Indicators Analysis (On the Daily Chart)
The RSI moving in the positive zone with a reading of 52.73 suggests that the stock has some bullish momentum, supported by volumes indicating increased trading activity. The CMP is trading above the trend-following indicators 21-period may act as a small support level.
General Recommendation:
As per the above-mentioned price action and technical indicators analysis, GENinCode PLC (LON: GENI) looking technically well-placed on the chart, and a ‘Speculative Buy’ recommendation has been given on the stock. Investment decisions should be made depending on an individual’s appetite for upside potential, risks, and any previous holdings. This recommendation is purely based on technical analysis, and fundamental analysis has not been considered in this report. The summary of recommendation is as follow:
Markets are trading in a highly volatile zone currently due to certain macro-economic and geopolitical tensions prevailing. Therefore, it is prudent to follow a cautious approach while investing.
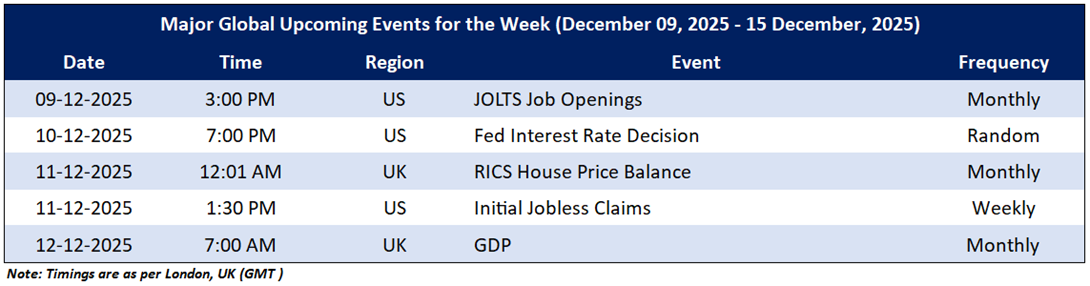
Upcoming Major Global Economic Events
Market events occur on a day-to-day basis depending on the frequency of the data and generally include an update on employment, inflation, GDP, consumer sentiments, etc. Noted below are the upcoming week's major global economic events that could impact the FTSE All-Share Index and listed stocks’ prices.
Related Risks: This report may be looked at from a high-risk perspective and recommendations are provided for a short duration. Recommendations provided in this report are solely based on technical parameters, and the fundamental performance of the stocks has not been considered in the decision-making process. Other factors which could impact stock prices include market risks, regulatory risks, interest rates risks, currency risks, social and political instability risks, etc.
Note 1: Past performance is not a reliable indicator of future performance.
Note 2: Individuals can consider existing from the stock if the Target Price mentioned as per the technical analysis has been achieved and subject to the factors discussed above.
Note 3: Kalkine reports are prepared based on the stock prices captured either from the London Stock Exchange (LSE) and or REFINITIV. Typically, both sources (LSE and or REFINITIV) may reflect stock prices with a delay which could be a lag of 15-20 minutes. There can be no assurance that future results or events will be consistent with the information provided in the report. The information is subject to change without any prior notice.
Note 4: How to Read the Charts?
The Green colour line reflects the 21-period moving average while the red line indicates the 50-period moving average. SMA helps to identify existing price trends. If the prices are trading above the 21-period and 50-period moving average, then it shows prices are currently trading in a bullish trend.
The Black colour line in the chart’s lower segment reflects the Relative Strength Index (14-Period) which indicates price momentum and signals momentum in trend. A reading of 70 or above suggests overbought status while a reading of 30 or below suggests an oversold status.
The Blue colour bars in the chart’s lower segment show the volume of the stock. The volume is the number of shares that changed hands during a given day. Stocks with high volumes are more liquid than stocks with lesser volume and liquidity in stocks helps in easier and faster execution of the order.
The Orange colour lines are the trend lines drawn by connecting two or more price points and used for trend identification purposes. The trend line also acts as a line of support and resistance.
Technical Indicators Defined: -
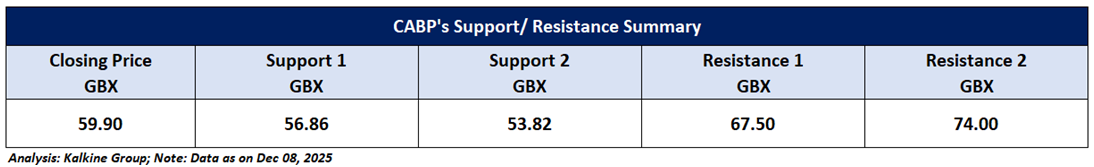
Support: A level at which the stock prices tend to find support if they are falling, and a downtrend may take a pause backed by demand or buying interest. Support 1 refers to the nearby support level for the stock and if the price breaches the level, then Support 2 may act as the crucial support level for the stock.
Resistance: A level at which the stock prices tend to find resistance when they are rising, and an uptrend may take a pause due to profit booking or selling interest. Resistance 1 refers to the nearby resistance level for the stock and if the price surpasses the level, then Resistance 2 may act as the crucial resistance level for the stock.
Stop-loss: In general, it is a level to protect further losses in case of unfavorable movement in the stock prices.
Risk Reward Ratio: Risk reward ratio is the difference between an entry point to a stop loss and profit level. This report is based on ~80% Stop Loss of the Target 1 from the entry point.
A trailing stop-loss is a modification of stop-loss in case of favourable movement in the price to protect the gains. Individuals can Trail the Stop-Loss as per the aforementioned levels if the stock price achieves more than 50% of the Target 1. Individuals should consider exiting from the position as per the Trailing Stop-Loss level if the price starts moving downwards after achieving more than 50% of the Target 1.
The reference date for all price data, currency, technical indicators, support, and resistance levels is December 08th, 2025. The reference data in this report has been partly sourced from REFINITIV.
Abbreviations
CMP: Current Market Price
SMA: Simple Moving Average
GBP: British pound sterling
GBX: British pence sterling
RSI: Relative Strength Index
Note: Trading decisions require a thorough analysis by individuals. Technical reports in general chart out metrics that may be assessed by individuals before any stock evaluation. The above are illustrative analytical factors used for evaluating stocks; other parameters can be looked at along with additional risks per se. Past performance is neither an indicator nor a guarantee of future performance.
Past performance is not a reliable indicator of future performance.

 Please wait processing your request...