0R15 7953.0 -2.8463% 0R1E None None% 0M69 None None% 0R2V 216.5 -3.9911% 0QYR None None% 0QYP 374.0 -4.1026% 0RUK None None% 0RYA 1666.0 -3.588% 0RIH 166.8 0.0% 0RIH 163.7 -1.8585% 0R1O 196.75 10041.7526% 0R1O None None% 0QFP 5040.0 0.0% 0M2Z 260.5986 -0.9696% 0VSO 40.5 13.7481% 0R1I None None% 0QZI 641.0 0.0% 0QZ0 220.0 0.0% 0NZF None None% 0YXG 189.72 0.0543%
This report is an updated version of the report published on 30 August 2024 at 09:13 AM GMT+1.
Section 1: Company Overview and Fundamental Insights
1.1 Company Overview:
GB Group PLC (LSE: GBG) is an FTSE AIM UK 50 Index listed UK-based firm offering identity data intelligence solutions, assisting organizations in identifying and verifying various aspects of an individual's identity during crucial business interactions. The company operates in three main areas: location, identity, and fraud prevention. Kalkine’s Technology Report covers the Investment Highlights, Key Financial Metrics, Risks, Recent Business Updates along with the Valuation, Target Price, and Recommendation on the stock.
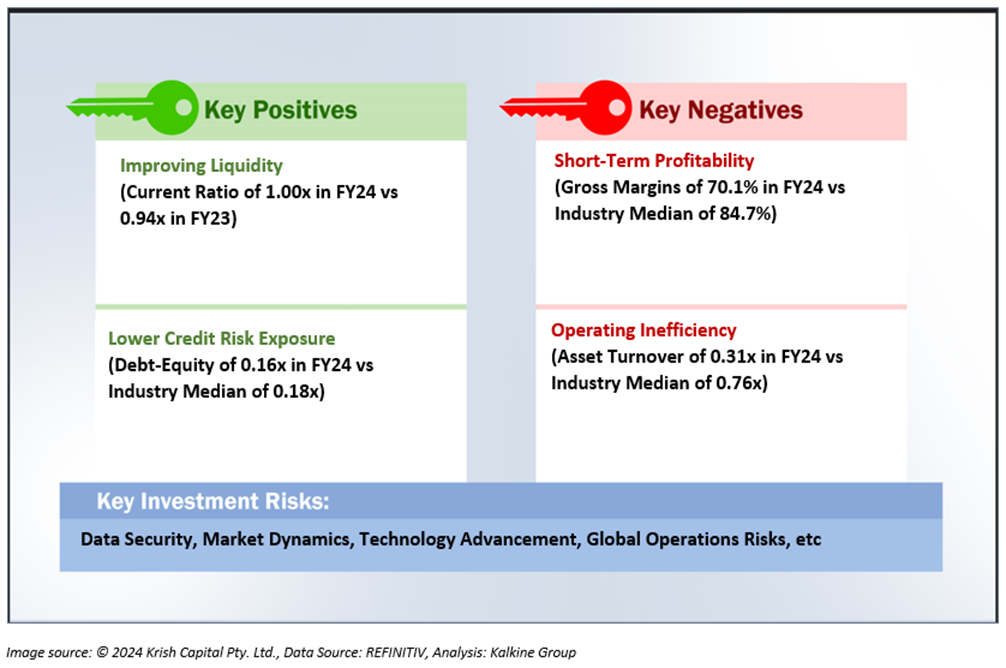
1.2 The Key Positives, Negatives, Highlights and Risks
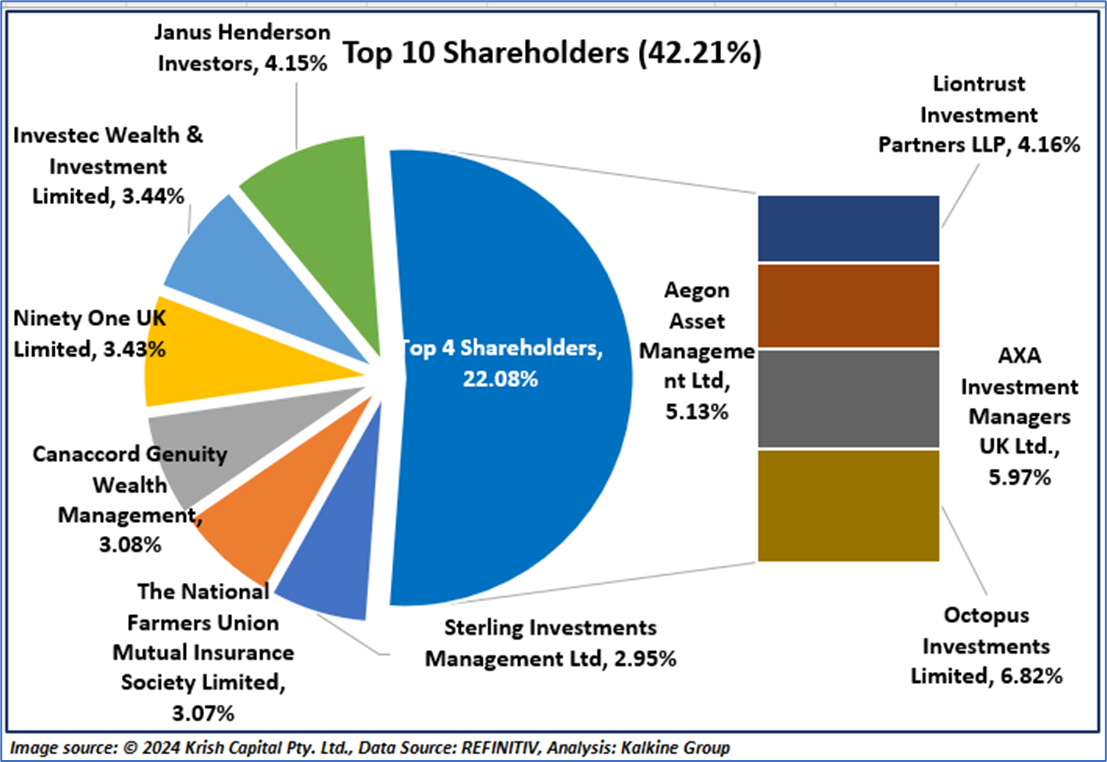
1.3 Top 10 Shareholders:
The top 10 shareholders collectively form ~42.21% of the total shareholdings. Octopus Investments Limited holds the maximum number of shares with ~6.82% shareholding, followed by AXA Investment Managers UK Ltd. with ~5.97% shareholding, as depicted in the chart below:
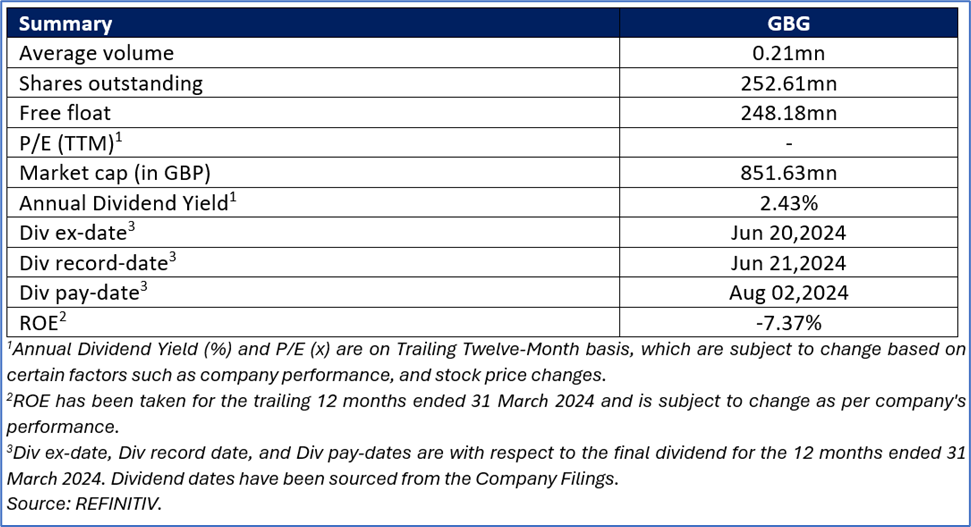
1.4 Key Metrics:
Section 2: Financial Highlights
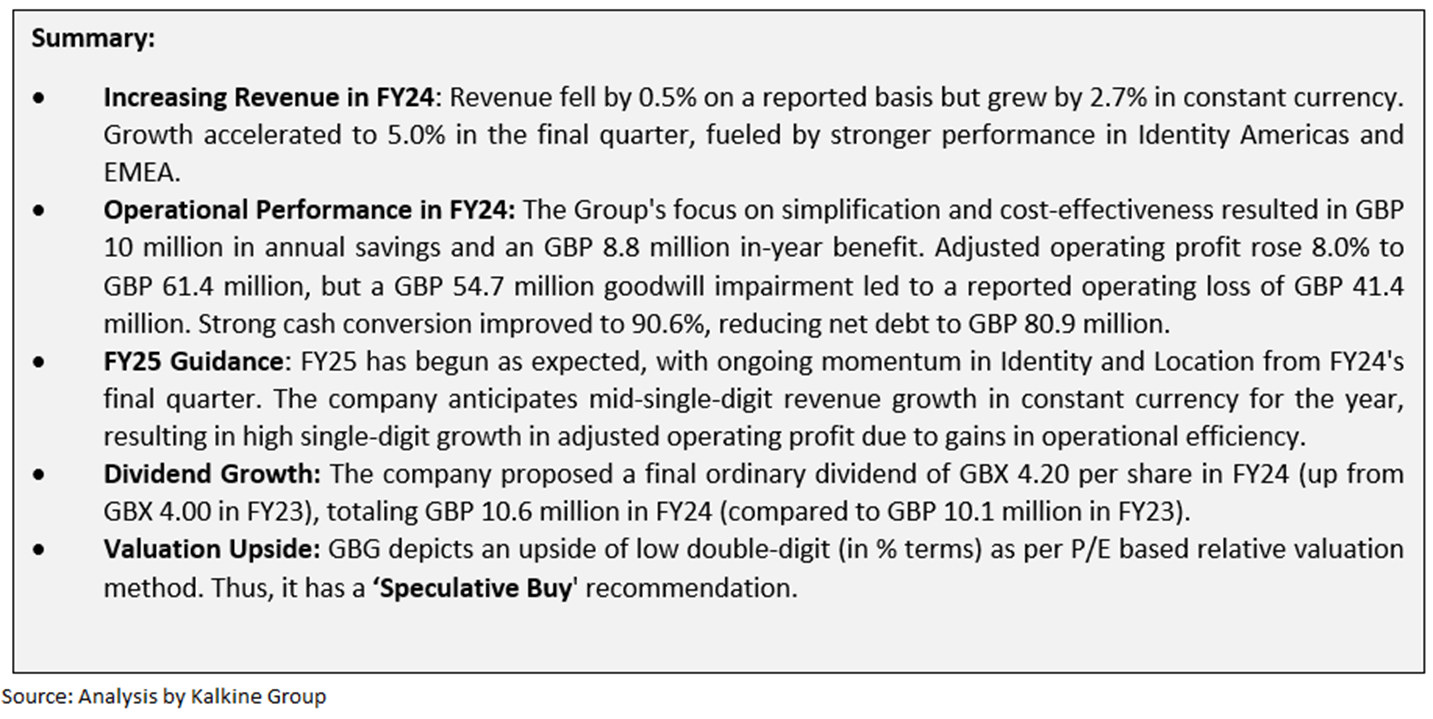
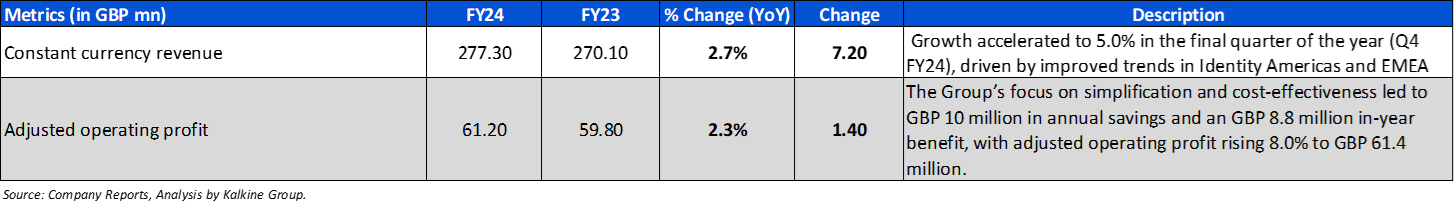
2.1 FY24 Financial Highlights
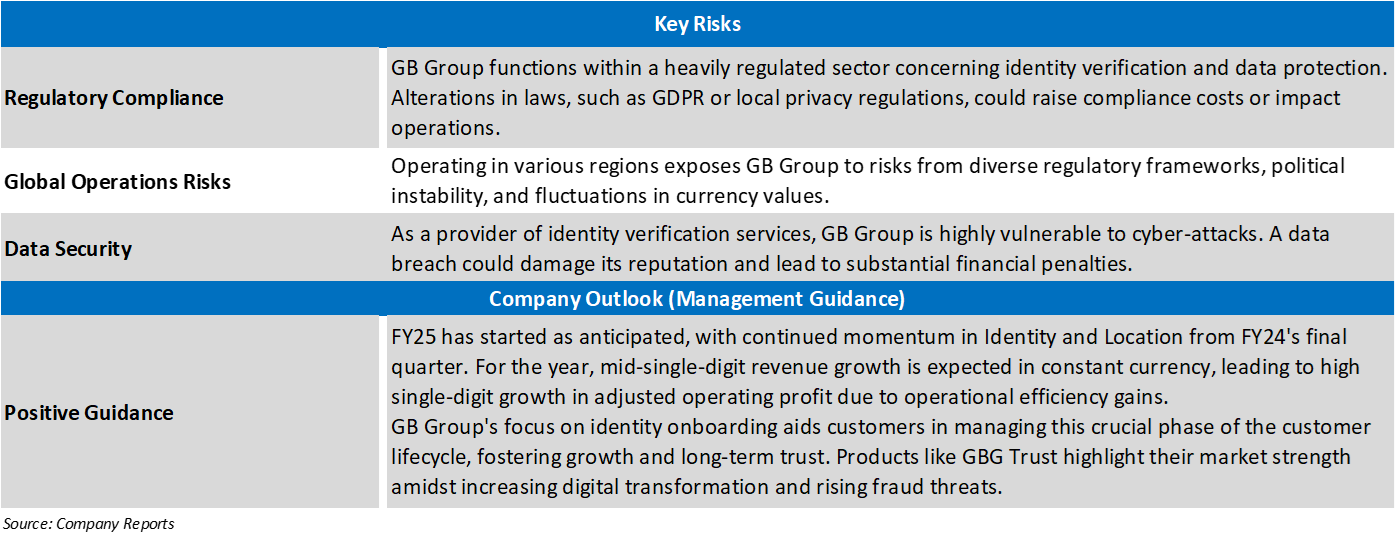
Section 3: Key Risks and Outlook
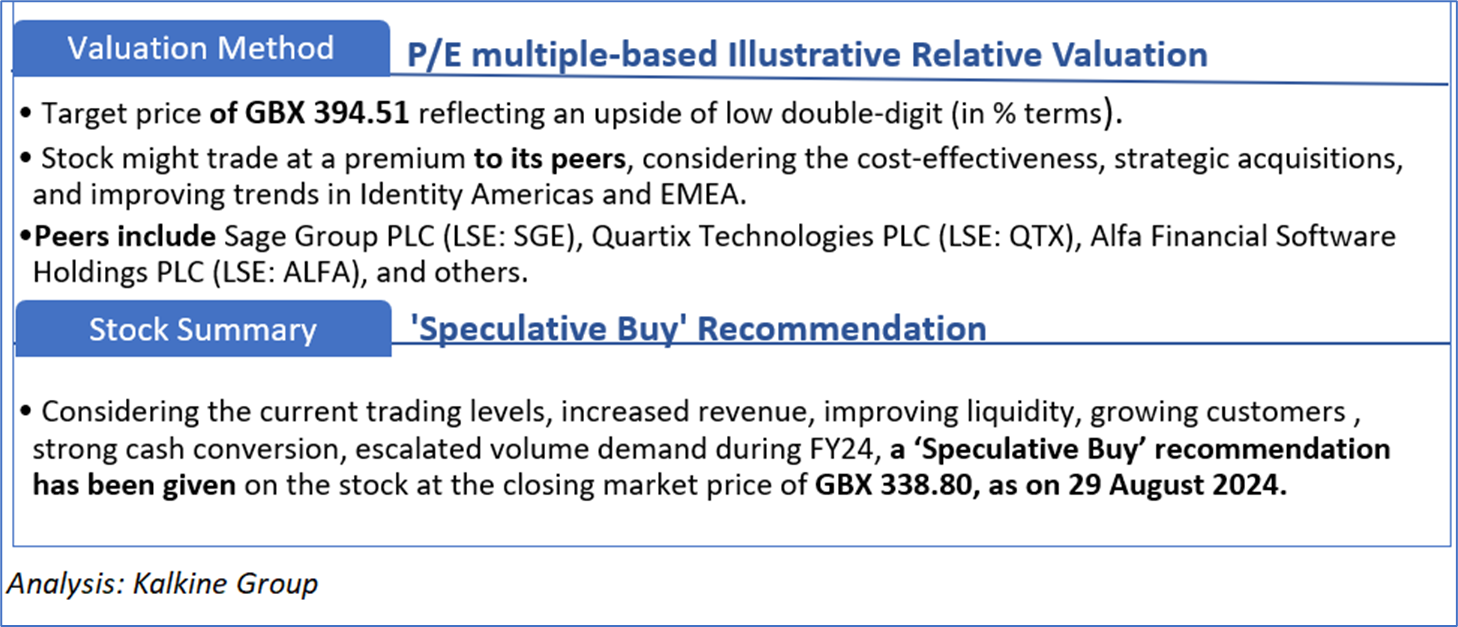
Section 4: Stock Recommendation Summary
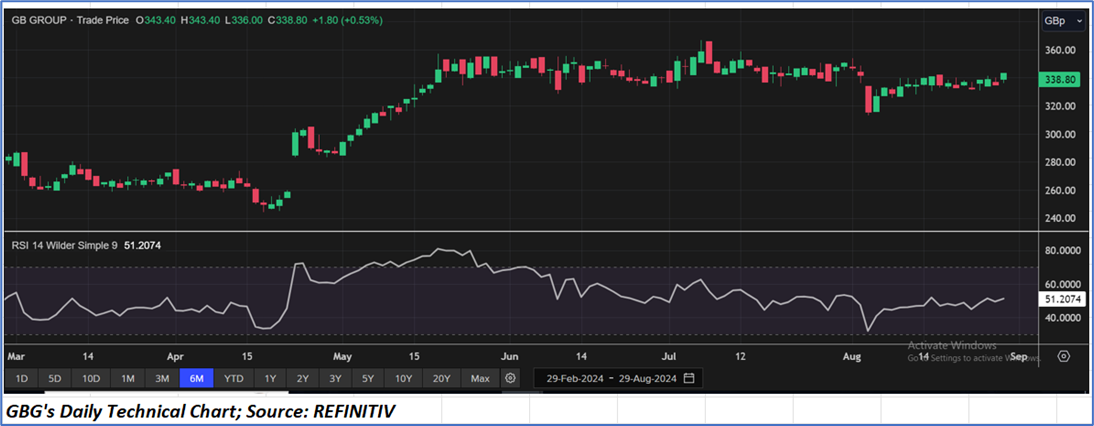
4.1 Price Performance and Technical Summary:
The stock has witnessed a decline of ~2.41% in the last one month and over the last 6 months, it has increased by ~18.47%. The stock has a 52-week low and 52-week high of GBX 202.80 & GBX 366.80, respectively and is currently trading above the average of 52-week high-low.

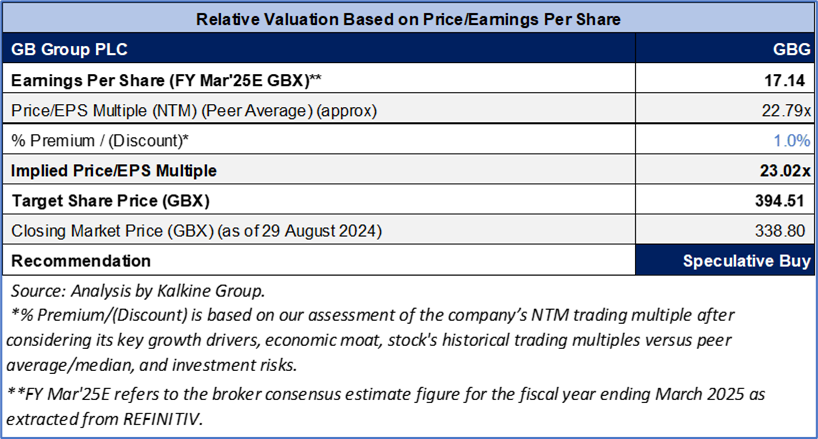
4.2 Fundamental Valuation
Valuation Methodology: Price/Earnings Approach
Please note markets are trading in a highly volatile zone currently due to certain macro-economic and geopolitical tensions prevailing. Therefore, it is prudent to follow a cautious approach while investing.
Note 1: Past performance is not a reliable indicator of future performance.
Note 2: The reference data for all price data, currency, technical indicators, support, and resistance levels is 29 August 2024. The reference data in this report has been partly sourced from REFINITIV.
Note 3: Investment decisions should be made depending on an individual's appetite for upside potential, risks, holding duration, and any previous holdings. An 'Exit' from the stock can be considered if the Target Price mentioned as per the Valuation and or the technical levels provided has been achieved and is subject to the factors discussed above.
Note 4: Target Price refers to a price level that the stock is expected to reach as per the relative valuation method and or technical analysis taking into consideration both short-term and long-term scenarios.
Note 5: Kalkine reports are prepared based on the stock prices captured either from the London Stock Exchange (LSE) and or REFINITIV. Typically, both sources (LSE and or REFINITIV) may reflect stock prices with a delay which could be a lag of 15-20 minutes. There can be no assurance that future results or events will be consistent with the information provided in the report. The information is subject to change without any prior notice.
Technical Indicators Defined: -
Support: A level at which the stock prices tend to find support if they are falling, and a downtrend may take a pause backed by demand or buying interest. Support 1 refers to the nearby support level for the stock and if the price breaches the level, then Support 2 may act as the crucial support level for the stock.
Resistance: A level at which the stock prices tend to find resistance when they are rising, and an uptrend may take a pause due to profit booking or selling interest. Resistance 1 refers to the nearby resistance level for the stock and if the price surpasses the level, then Resistance 2 may act as the crucial resistance level for the stock.
Stop-loss: It is a level to protect further losses in case of unfavourable movement in the stock prices.
 UK
UK  AU
AU CA
CA US
US NZ
NZ Please wait processing your request...