Section 1: Company Overview and Fundamentals
1.1 Company Overview:
Himax Technologies Inc (NASDAQ: HIMX) is mainly engaged in the fabless semiconductor solution. The Company offers comprehensive automotive integrated circuit (IC) solutions, including traditional driver ICs, in-cell touch and display driver integration, large touch and display driver integration and local dimming timing controllers.
Kalkine’s Dividend Income Report covers the Company Overview, Key positives & negatives, Investment summary, Key investment metrics, Top 10 shareholding, Business updates and insights into company recent financial results, Key Risks & Outlook, Price performance and technical summary, Target Price, and Recommendation on the stock.
Price Performance:
- HIMX's share price has given a return of 56.36% in the past three months. Similarly, in the long term, the stock has given by return of 13.00% over the past six months.
- The stock is leaning towards the upper band of its 52-week range of USD 13.91 and 52-week low price of USD 5.12, with the current price near an important support zone of USD8.50-USD 9.00, therefore expectations of upward movement in case these levels hold.
- The price is currently above its short-term (50-day) SMA and long-term (200-day) SMA, with the current RSI of 55.41, near mid-levels, with expectations and potential of upward movement.

1.2 The Key Positives, Negatives, and Investment summary


1.3 Top 10 shareholders:
The top 10 shareholders together form ~41.48% of the total shareholding, signifying concentrated shareholding. BW Group Limited and Hemen Holding Limited, are the biggest shareholders, holding the maximum stake in the company at ~21.98% and ~6.53%, respectively.

1.4 Dividend payments with impressive dividend yield:
Himax Technologies, Inc. (Nasdaq: HIMX) announced the declaration of a cash dividend for fiscal year 2024, set at 37.0 cents per American Depositary Share (ADS), equivalent to 18.5 cents per ordinary share, to be disbursed on July 11, 2025, to shareholders of record as of June 30, 2025, with the ADS book closed for transactions from June 23, 2025, to June 30, 2025. This dividend, reflecting a payout ratio of 81.1% of the previous year’s profit, aligns with the company’s established practice of distributing annual dividends mid-year based on prior financial performance, a tradition upheld since its initial public offering in 2006, as emphasized by President and CEO Mr. Jordan Wu, who underscored the company’s commitment to rewarding shareholders while maintaining a robust balance sheet and pursuing sustainable long-term growth through dividends and share repurchases.

1.5 Key Metrics
Himax Technologies, Inc. (Nasdaq: HIMX) demonstrates a notable improvement in financial efficiency from Q1 FY24 to Q1 FY25, as evidenced by an increase in gross profit margin from 29.3% to 30.5%, reflecting enhanced profitability through a favorable product mix and cost optimization. Key profitability metrics also advanced significantly, with EBITDA margin rising from 7.5% to 11.6%, operating margin from 4.8% to 9.2%, income before tax margin from 5.9% to 11.2%, and net margin from 5.9% to 9.4%, indicating stronger operational performance and effective expense management. However, the free cash flow yield declined from 12.8% to 8.9% over the trailing twelve months (TTM), suggesting a potential reduction in cash generation efficiency, while returns on average common equity (from 5.4% to 9.8%), average total assets (from 2.8% to 5.4%), and invested capital (from 4.1% to 6.5%) all improved, highlighting a robust enhancement in capital utilization and overall financial health as of the latest reporting period.

Section 2: Business Updates and Financial Highlights
2.1 Recent Updates:
The below picture gives an overview of the recent updates:

2.2 Insights of Q1FY25:

Section 3: Key Risks and Outlook:


Section 4: Stock Recommendation Summary:
4.1 Technical Summary:
Price Performance:
- HIMX's share price has given a return of 56.36% in the past three months. Similarly, in the long term, the stock has given by return of 13.00% over the past six months.
- The stock is leaning towards the upper band of its 52-week range of USD 13.91 and 52-week low price of USD 5.12, with the current price near an important support zone of USD8.50-USD 9.00, therefore expectations of upward movement in case these levels hold.
- The price is currently above its short-term (50-day) SMA and long-term (200-day) SMA, with the current RSI of 55.41, near mid-levels, with expectations and potential of upward movement.


4.2 Fundamental Valuation
Valuation Methodology: Price/Earnings Per Share Multiple Based Relative Valuation
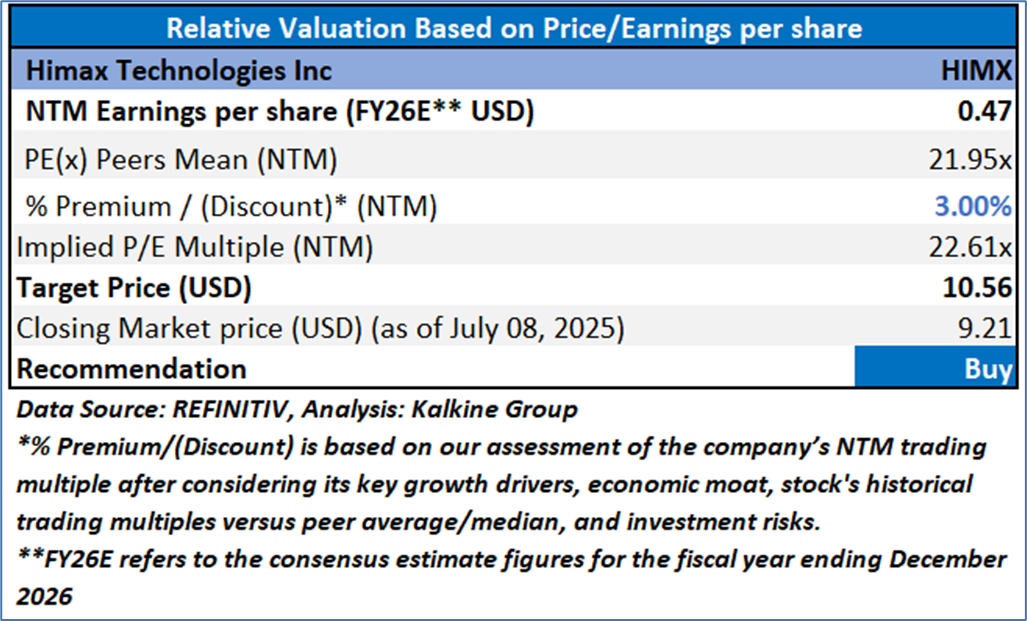

Markets are trading in a highly volatile zone currently due to certain macroeconomic issues and geopolitical tensions prevailing. Therefore, it is prudent to follow a cautious approach while investing.
Note 1: Past performance is not a reliable indicator of future performance.
Note 2: The reference date for all price data, currency, technical indicators, support, and resistance levels is July 08, 2025. The reference data in this report has been partly sourced from REFINITIV.
Note 3: Investment decisions should be made depending on an individual's appetite for upside potential, risks, holding duration, and any previous holdings. An 'Exit' from the stock can be considered if the Target Price mentioned as per the Valuation and or the technical levels provided has been achieved and is subject to the factors discussed above.
Note 4: The report publishing date is as per the Pacific Time Zone.
Technical Indicators Defined: -
Support: A level at which the stock prices tend to find support if they are falling, and a downtrend may take a pause backed by demand or buying interest. Support 1 refers to the nearby support level for the stock and if the price breaches the level, then Support 2 may act as the crucial support level for the stock.
Resistance: A level at which the stock prices tend to find resistance when they are rising, and an uptrend may take a pause due to profit booking or selling interest. Resistance 1 refers to the nearby resistance level for the stock and if the price surpasses the level, then Resistance 2 may act as the crucial resistance level for the stock.
Stop-loss: It is a level to protect against further losses in case of unfavorable movement in the stock prices.
Disclaimer-
This report has been issued by Kalkine Limited (Company number 07903332), a private limited company, incorporated in England and Wales ("Kalkine”). Kalkine.co.uk and associated pages are published by Kalkine. Kalkine is authorised and regulated by the Financial Conduct Authority under reference number 579414.
The information in this report and on the Kalkine website has been prepared from a wide variety of sources, which Kalkine, to the best of its knowledge and belief, considers accurate. Kalkine has made every effort to ensure the reliability of information contained in its reports, newsletters and websites. All information represents our views at the date of publication and may change without notice. The information in this report does not constitute an offer to sell securities or other financial products or a solicitation of an offer to buy securities or other financial products. Our reports contain non personalized recommendations to invest in securities and other financial products.
Kalkine does not offer financial advice based upon your personal financial situation or goals, and we shall not be held liable for any investment or trading losses you may incur by using the opinions expressed in our reports, publications, market updates, news alerts and corporate profiles. Kalkine does not intend to exclude any liability which it is not permitted to exclude under applicable law or regulation. Kalkine’s non-personalised advice does not in any way endorse or recommend individuals, investment products or services for your personal financial situation. You should discuss your portfolios and the risk tolerance level appropriate for your personal financial situation, with a professional authorised financial planner and adviser. You should be aware that the value of any investment and the income from it can go down as well as up and you may not get back the amount invested.
Please also read our Terms & Conditions for further information. Employees and/or associates of Kalkine and its related entities may hold interests in the securities or other financial products covered in this report or on the Kalkine website. Any such employees and associates are required to comply with certain safeguards, procedures and disclosures as required by law.
Kalkine Media Limited, an affiliate of Kalkine, may have received, or be entitled to receive, financial consideration in connection with providing information about certain entity(s) covered on its website including entities covered in this report.
Past performance is not a reliable indicator of future performance.
 Please wait processing your request...