Section 1: Company Fundamentals
1.1 Company Overview and Performance summary
Company Overview:
Arm Holdings plc (NASDAQ: ARM) is engaged in operating a global computing platform. It architects, develops, and licenses high-performance and energy-efficient Arm Compute platforms. The Company’s principal operations and activities are the licensing, marketing, research and development of central processing unit (CPU) design intellectual property (IP), graphics processors, system IP, market optimized platform IP, and associated software, tools and other related services.
This Global AI and Emerging Market Report covers the Company Overview & Price performance, Summary table, Key positives & negatives, Key metrics, Company details, technical guidance & Stock recommendation, and Price chart.
1.2 Summary Table

1.3 The Key Positives & Negatives


1.4 Key metrics
Arm Holdings (Nasdaq: ARM) exhibited a mixed financial performance in the first quarter of fiscal 2026 compared to the same period in 2025, with gross profit margin improving from 96.49% to 97.15%, reflecting enhanced cost efficiency and pricing power amid a 12% revenue increase to USD 1.053 billion, though profitability metrics weakened as EBITDA margin declined from 23.96% to 16.52%, operating margin dropped from 19.38% to 10.83%, and income before tax margin fell from 25.99% to 13.87%, primarily due to a 33% rise in non-GAAP operating expenses to USD 619 million driven by R&D investments. The net margin decreased from 23.75% to 12.35%, influenced by an income tax rate increase from 8.61% to 10.96%, yet return metrics showed strength with return on average common equity rising from 8.58% to 11.03%, return on average total assets improving from 5.82% to 8.09%, and return on invested capital advancing from 8.58% to 11.01%, indicating robust capital utilization despite lower free cash flow yield slipping from 0.44% to 0.38%. This analysis suggests that while Arm maintains a solid foundation for growth with higher returns and a record revenue quarter, the reduced profitability margins and increased operational costs highlight the need for careful management of R&D expenditures and market execution to sustain long-term financial health.

Section 2: ARM Holdings PLC (NASDAQ: ARM)) (“Buy” at the current price of USD 139.54, as of September 08, 2025, at 09:45 AM PDT)
2.1 Company Details


2.2 Technical Guidance and Stock Recommendation

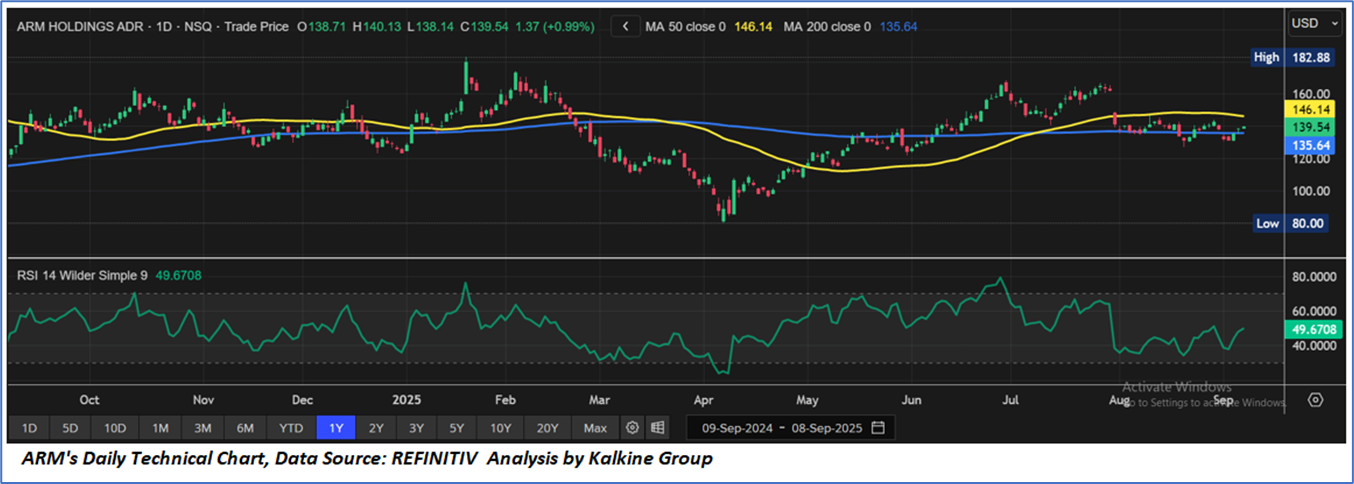
Markets are trading in a highly volatile zone currently due to certain macroeconomic issues and geopolitical tensions prevailing. Therefore, it is prudent to follow a cautious approach while investing.
Note 1: Past performance is not a reliable indicator of future performance.
Note 2: The reference date for all price data, currency, technical indicators, support, and resistance levels is September 08, 2025. The reference data in this report has been partly sourced from REFINITIV.
Note 3: Investment decisions should be made depending on an individual's appetite for upside potential, risks, holding duration, and any previous holdings. An 'Exit' from the stock can be considered if the Target Price mentioned as per the Valuation and or the technical levels provided has been achieved and is subject to the factors discussed above.
Note 4: The report publishing date is as per the Pacific Time Zone.
Technical Indicators Defined: -
Support: A level at which the stock prices tend to find support if they are falling, and a downtrend may take a pause backed by demand or buying interest. Support 1 refers to the nearby support level for the stock and if the price breaches the level, then Support 2 may act as the crucial support level for the stock.
Resistance: A level at which the stocks prices tend to find resistance when they are rising, and an uptrend may take a pause due to profit booking or selling interest. Resistance 1 refers to the nearby resistance level for the stock and if the price surpasses the level, then Resistance 2 may act as the crucial resistance level for the stock.
Stop-loss: It is a level to protect against further losses in case of unfavorable movement in the stock prices.
Disclaimer-
This report has been issued by Kalkine Limited (Company number 07903332), a private limited company, incorporated in England and Wales ("Kalkine”). Kalkine.co.uk and associated pages are published by Kalkine. Kalkine is authorised and regulated by the Financial Conduct Authority under reference number 579414.
The information in this report and on the Kalkine website has been prepared from a wide variety of sources, which Kalkine, to the best of its knowledge and belief, considers accurate. Kalkine has made every effort to ensure the reliability of information contained in its reports, newsletters and websites. All information represents our views at the date of publication and may change without notice. The information in this report does not constitute an offer to sell securities or other financial products or a solicitation of an offer to buy securities or other financial products. Our reports contain non personalized recommendations to invest in securities and other financial products.
Kalkine does not offer financial advice based upon your personal financial situation or goals, and we shall not be held liable for any investment or trading losses you may incur by using the opinions expressed in our reports, publications, market updates, news alerts and corporate profiles. Kalkine does not intend to exclude any liability which it is not permitted to exclude under applicable law or regulation. Kalkine’s non-personalised advice does not in any way endorse or recommend individuals, investment products or services for your personal financial situation. You should discuss your portfolios and the risk tolerance level appropriate for your personal financial situation, with a professional authorised financial planner and adviser. You should be aware that the value of any investment and the income from it can go down as well as up and you may not get back the amount invested.
Please also read our Terms & Conditions for further information. Employees and/or associates of Kalkine and its related entities may hold interests in the securities or other financial products covered in this report or on the Kalkine website. Any such employees and associates are required to comply with certain safeguards, procedures and disclosures as required by law.
Kalkine Media Limited, an affiliate of Kalkine, may have received, or be entitled to receive, financial consideration in connection with providing information about certain entity(s) covered on its website including entities covered in this report.
Past performance is not a reliable indicator of future performance.
 Please wait processing your request...