
CGI Inc.
Section 1: Company Overview
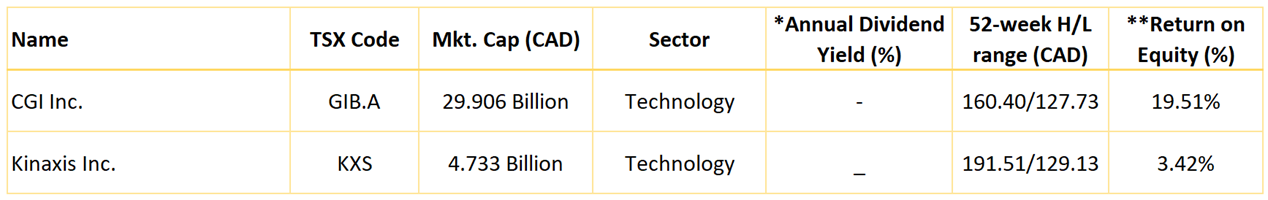
CGI Inc. (TSX: GIB.A) is a Canada-based IT-services provider with an embedded position in North America and Europe. The company generates more than CAD 12 billion in annual revenue, employs over 76,000 personnel, and operates across 400 offices in 40 countries. CGI offers a broad portfolio of services such as consulting, systems integration, application maintenance, and business process services, or BPS. The company's largest vertical market is government, which contributes more than a third of group revenue.
This Report covers the Investment Highlights, Key Financial Metrics, Risks, Technical Analysis along with the Valuation, Target Price, and Recommendation on the stock.
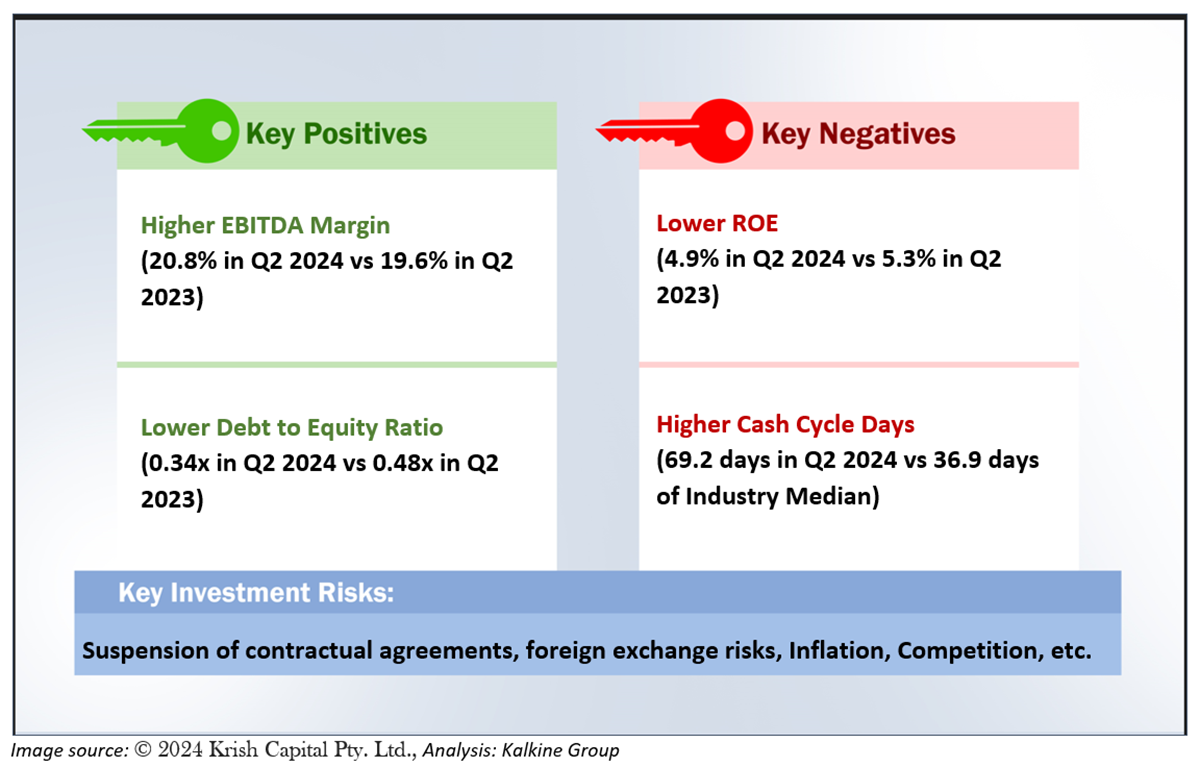
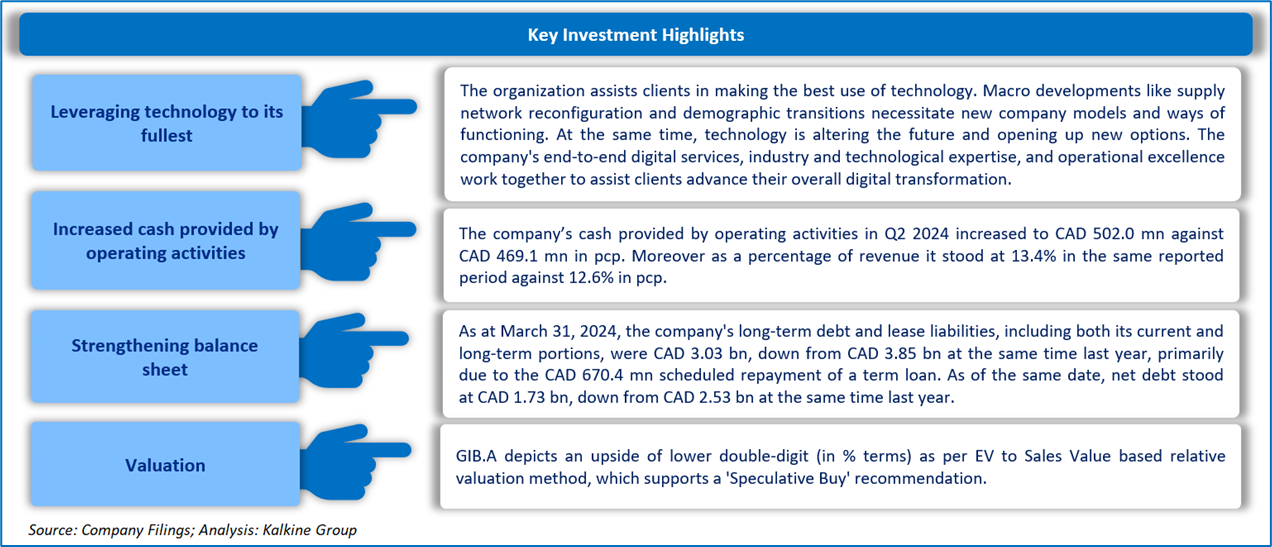
1.1 The Key Positives, Negatives, Investment Highlights, and Risks
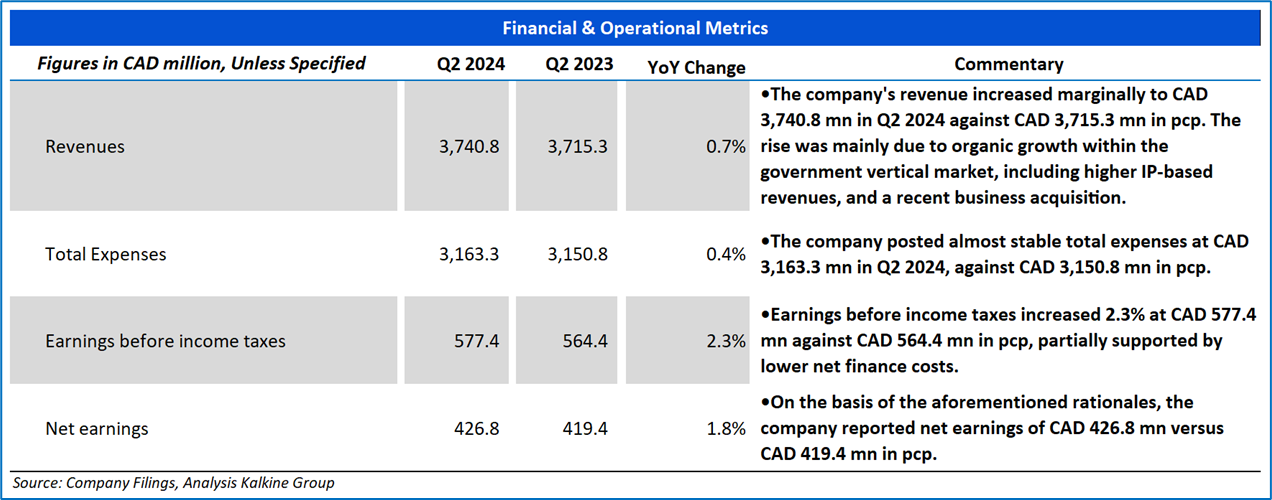
Section2: Financial Highlights
2.1 Key Financial Highlights
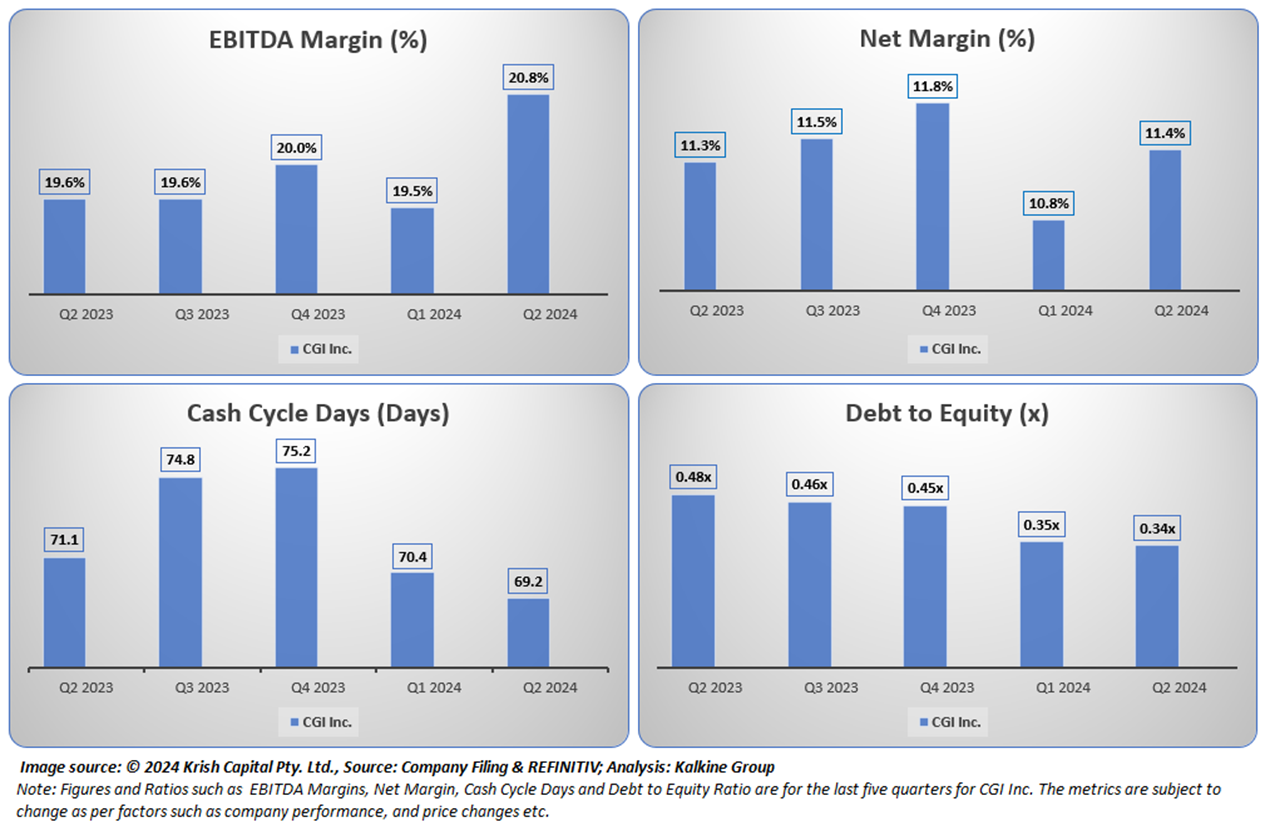
Section 3: Key Metrics
Below charts depict the change in EBITDA Margin, Net Margin, Cash Cycle Days and Debt to Equity ratio of the Company for the five reported quarters.
Section 4: Stock Recommendation Summary
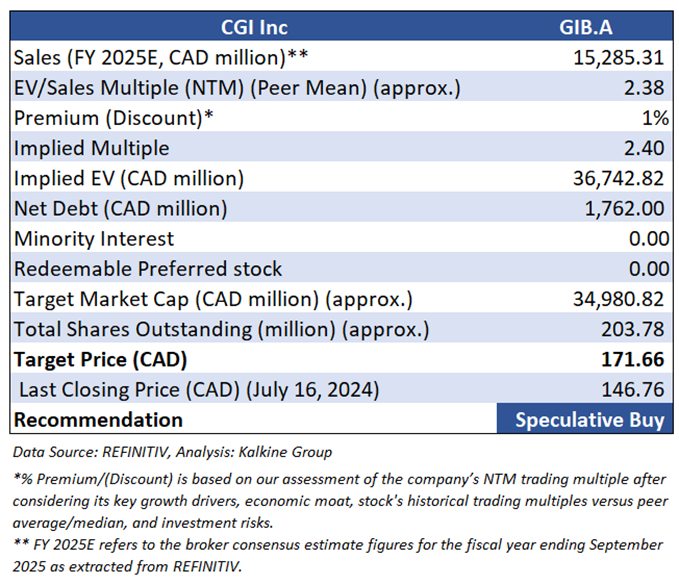
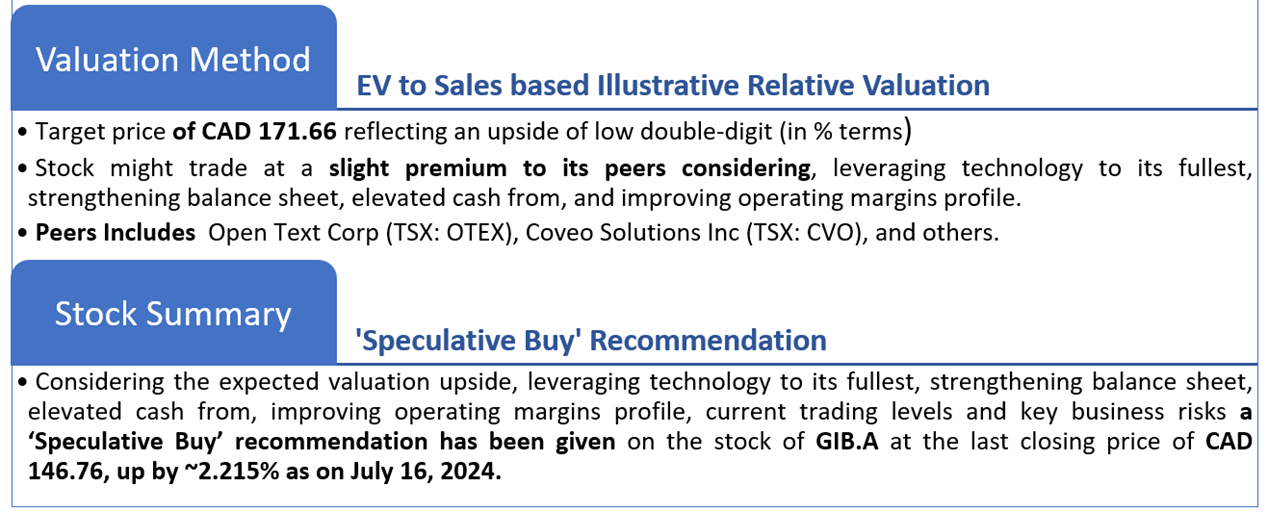
4.1 Valuation Methodology Illustrative EV to Sales Based
4.2 Price Performance and Stock Recommendation

The stock has witnessed an upside of ~5.93% in 1 week and ~7.23% over the last 1 month. Moreover, the stock is trading above the average 52-week high price of CAD 160.40 and 52-week low price of CAD 127.73 providing an opportunity to ride the trend.
4.3 One-Year Technical Price Chart
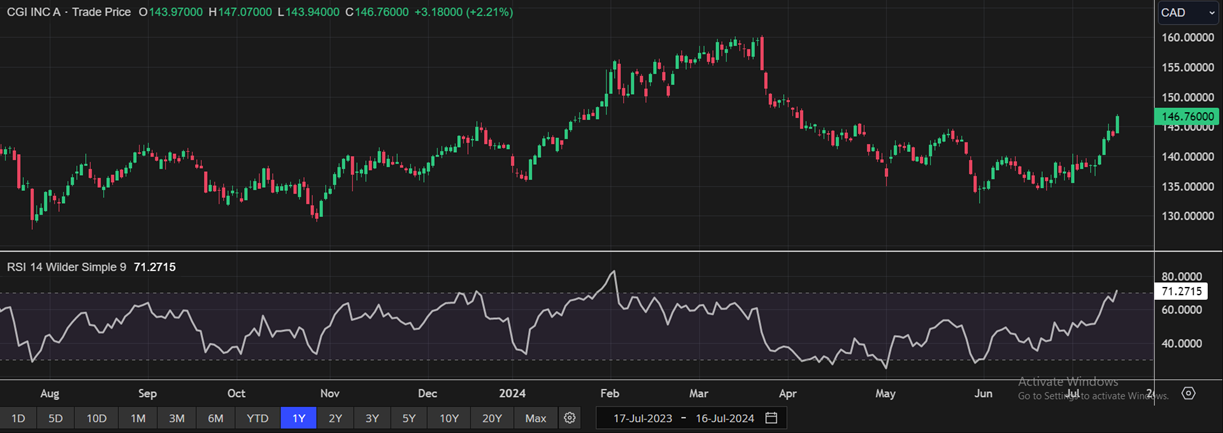
One-Year Technical Price Chart (as of July 16, 2024). Source: REFINITIV, Analysis: Kalkine Group
4.4 Technical Summary
Kinaxis Inc
Section 1: Company Overview
Kinaxis Inc (TSX: KXS) is a Canada-based provider of software solutions for sales and operations planning (S&OP) and supply chain management. The firm's flagship RapidResponse product is offered on the cloud. Its capabilities include consequence evaluation and alerting, responsibility-based collaboration, high-speed analytics, and scenario simulation. Kinaxis's S&OP solution capabilities include supply and demand planning, capacity and inventory planning, and inventory management. The firm has operations in North America, Europe, and Asia-Pacific regions.
This Report covers the Investment Highlights, Key Financial Metrics, Risks, Technical Analysis along with the Valuation, Target Price, and Recommendation on the stock.
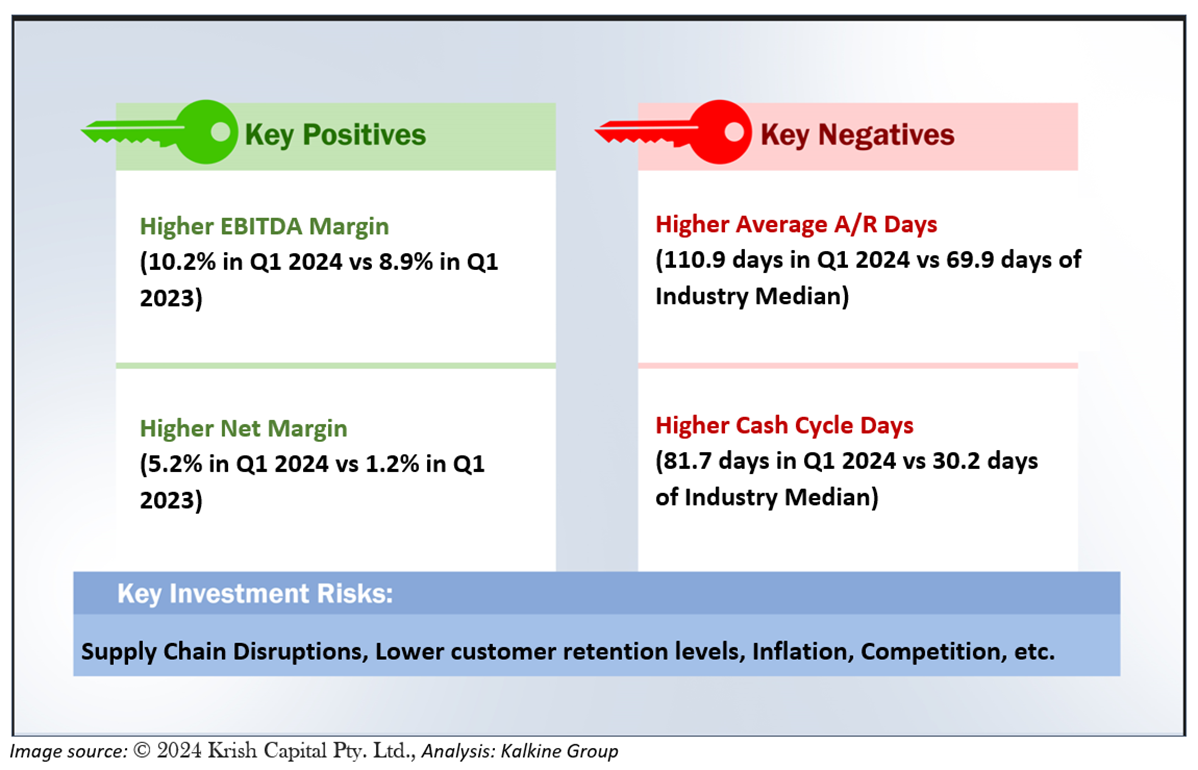
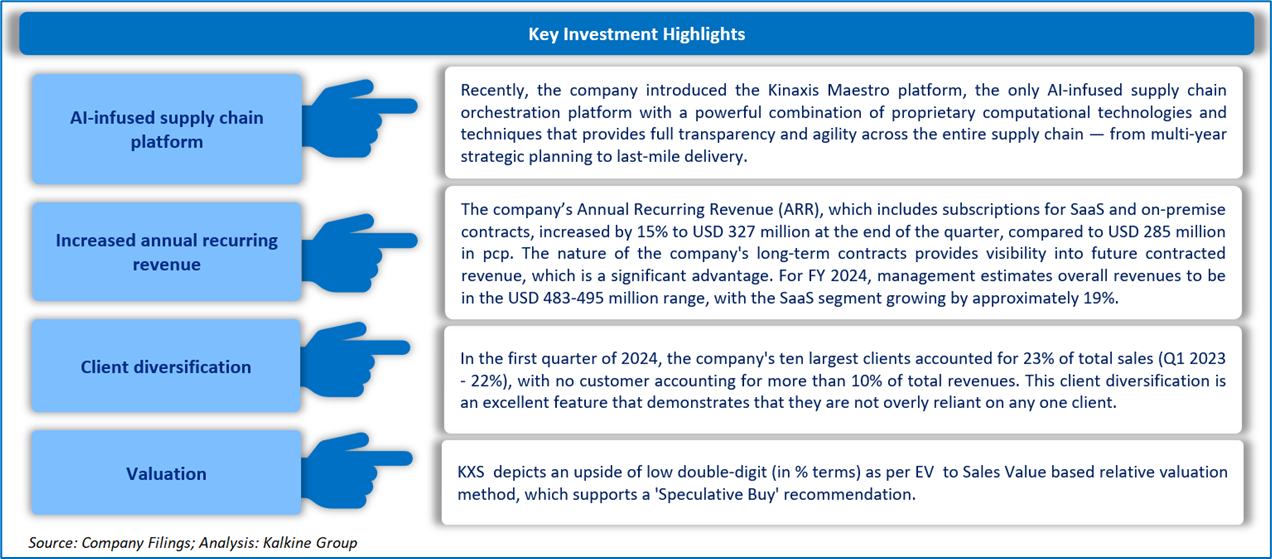
1.1 The Key Positives, Negatives, Investment Highlights, and Risks
Section2: Financial Highlights
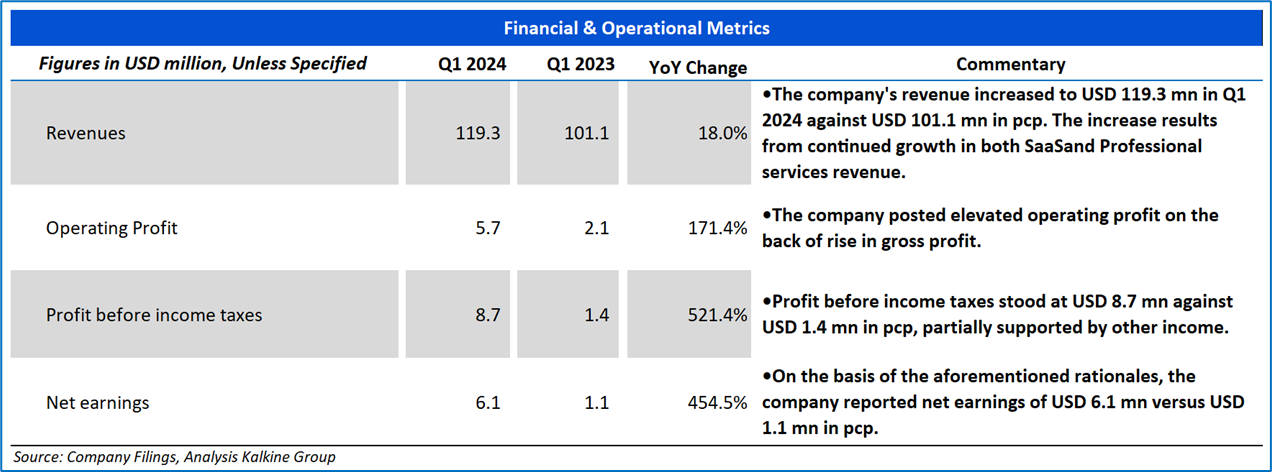
2.1 Key Financial Highlights
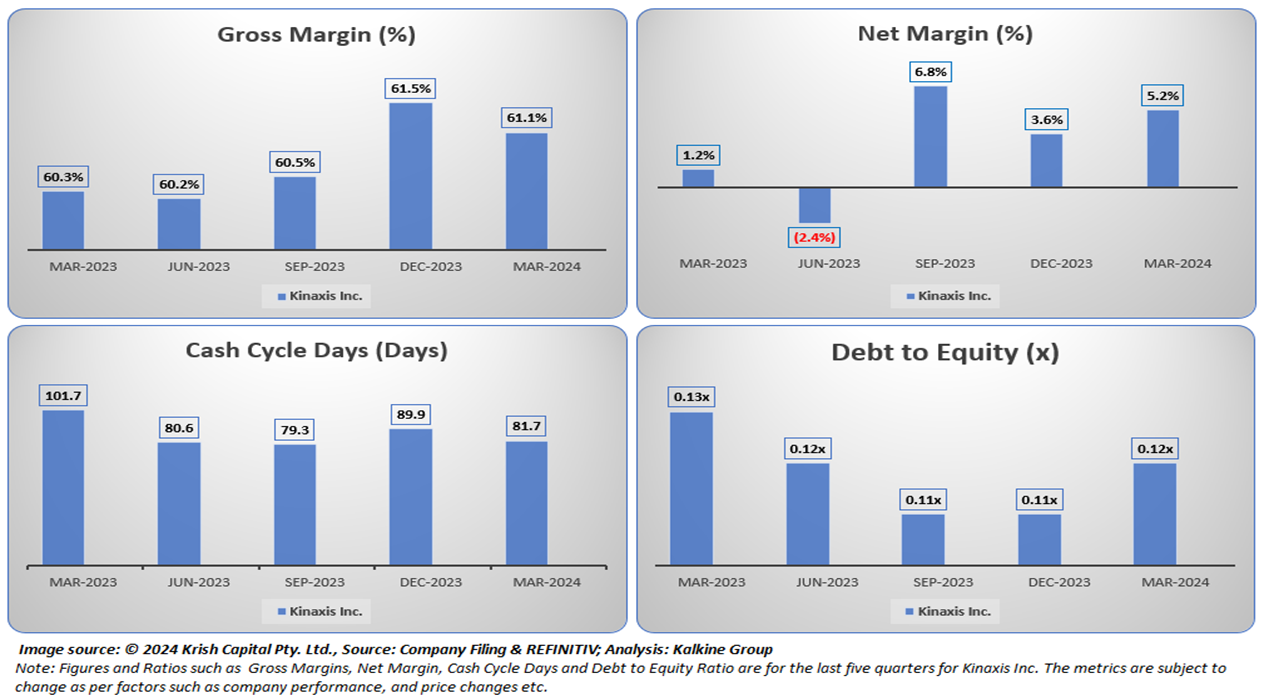
Section 3: Key Metrics
Below charts depict the change in Gross Margin, Net Margin, Cash Cycle Days and Debt to Equity Ratio of the Company for the last five reported quarters.
Section 4: Stock Recommendation Summary
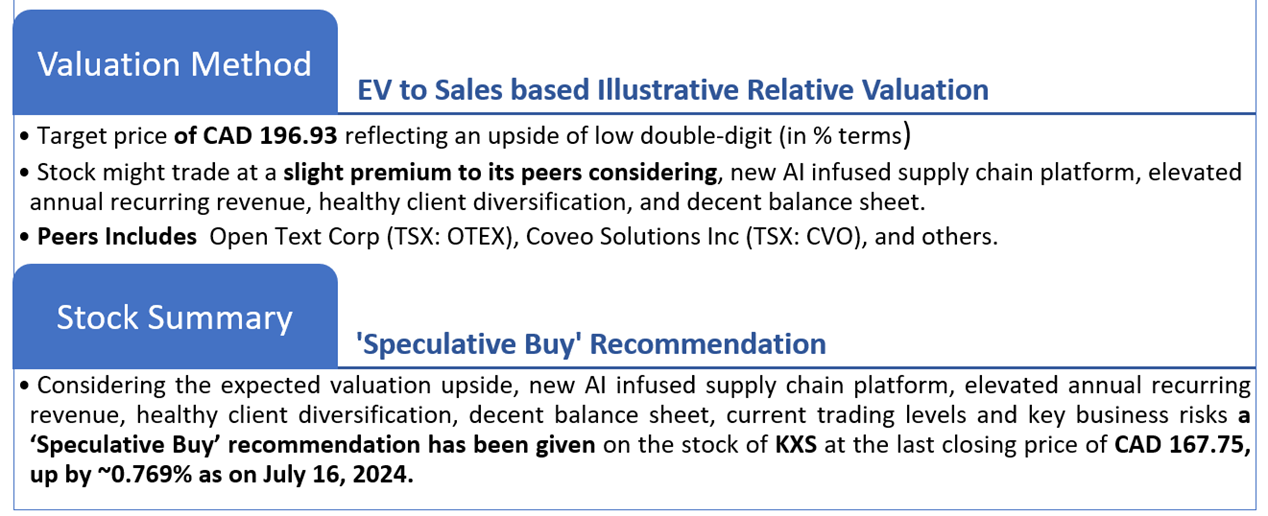
4.1 Valuation Methodology
Valuation Methodology (Illustrative): EV/ Sales based

4.2 Price Performance and Stock Recommendation

The stock has witnessed an upside of ~6.78% in 1 week and ~12.54% over the last 1 month respectively. Moreover, the stock is trading above the average 52-week high price of CAD 191.51 and 52-week low price of CAD 129.13 providing an opportunity to ride the trend.
4.3 One-Year Technical Price Chart
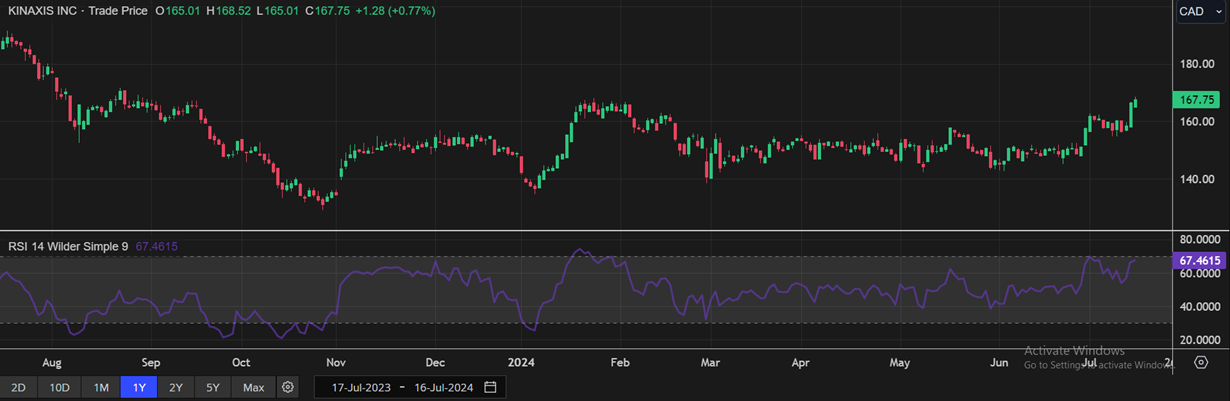
One-Year Technical Price Chart (as of July 16, 2024). Source: REFINITIV, Analysis: Kalkine Group
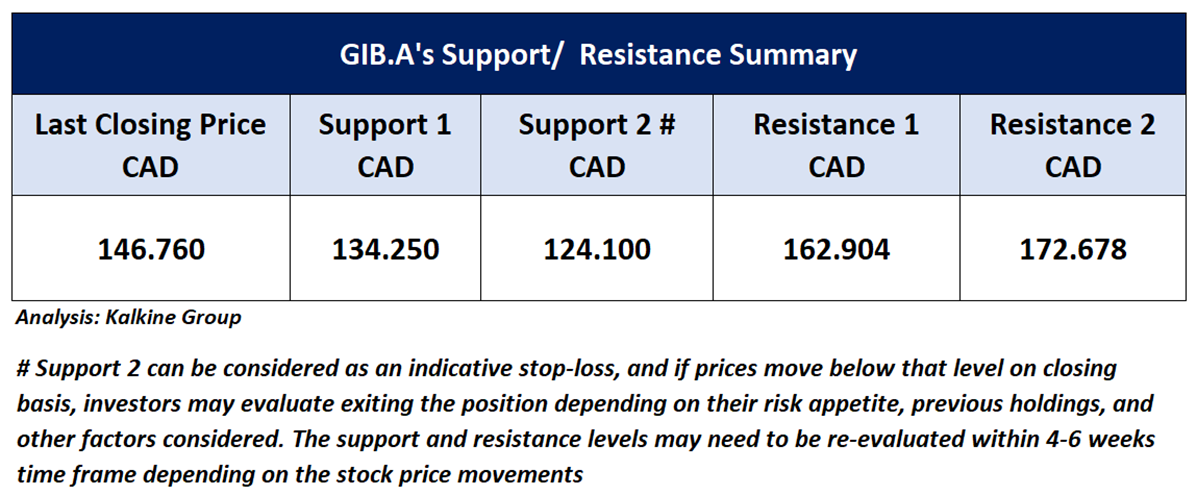
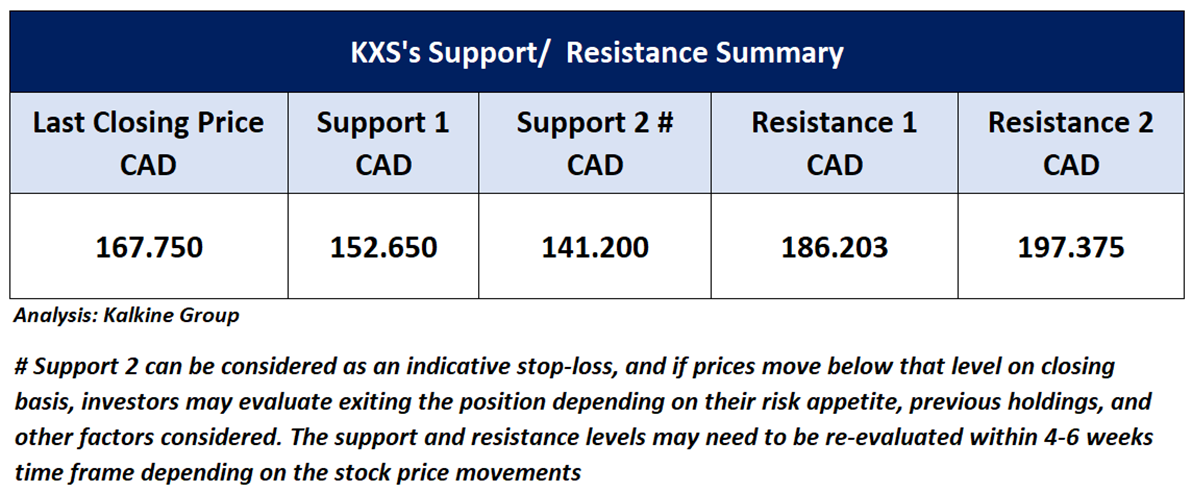
4.4 Technical Summary
Note 1: Past performance is not a reliable indicator of future performance.
Note 2: The reference date for all price data, currency, technical indicators, support, and resistance levels as on July 16, 2024. The reference data in this report has been partly sourced from REFINITIV.
Note 3: Investment decisions should be made depending on an individual's appetite for upside potential, risks, holding duration, and any previous holdings. An 'Exit' from the stock can be considered if the Target Price mentioned as per the Valuation and or the technical levels provided has been achieved and is subject to the factors discussed above.
Note 4: Dividend Yield may vary as per the stock price movement.
Technical Indicators Defined: -
Support: A level at which the stock prices tend to find support if they are falling, and a downtrend may take a pause backed by demand or buying interest.
Resistance: A level at which the stock prices tend to find resistance when they are rising, and the uptrend may take a pause due to profit booking or selling interest.
Stop-loss: In general, it is a level to protect further losses in case of any unfavourable movement in the stock prices.
Disclaimer-
This report has been issued by Kalkine Limited (Company number 07903332), a private limited company, incorporated in England and Wales ("Kalkine”). Kalkine.co.uk and associated pages are published by Kalkine. Kalkine is authorised and regulated by the Financial Conduct Authority under reference number 579414.
The information in this report and on the Kalkine website has been prepared from a wide variety of sources, which Kalkine, to the best of its knowledge and belief, considers accurate. Kalkine has made every effort to ensure the reliability of information contained in its reports, newsletters and websites. All information represents our views at the date of publication and may change without notice. The information in this report does not constitute an offer to sell securities or other financial products or a solicitation of an offer to buy securities or other financial products. Our reports contain non personalized recommendations to invest in securities and other financial products.
Kalkine does not offer financial advice based upon your personal financial situation or goals, and we shall not be held liable for any investment or trading losses you may incur by using the opinions expressed in our reports, publications, market updates, news alerts and corporate profiles. Kalkine does not intend to exclude any liability which it is not permitted to exclude under applicable law or regulation. Kalkine’s non-personalised advice does not in any way endorse or recommend individuals, investment products or services for your personal financial situation. You should discuss your portfolios and the risk tolerance level appropriate for your personal financial situation, with a professional authorised financial planner and adviser. You should be aware that the value of any investment and the income from it can go down as well as up and you may not get back the amount invested.
Please also read our Terms & Conditions for further information. Employees and/or associates of Kalkine and its related entities may hold interests in the securities or other financial products covered in this report or on the Kalkine website. Any such employees and associates are required to comply with certain safeguards, procedures and disclosures as required by law.
Kalkine Media Limited, an affiliate of Kalkine, may have received, or be entitled to receive, financial consideration in connection with providing information about certain entity(s) covered on its website including entities covered in this report.
Past performance is not a reliable indicator of future performance.
 Please wait processing your request...