Section1: Company Overview and Fundamental Insights:

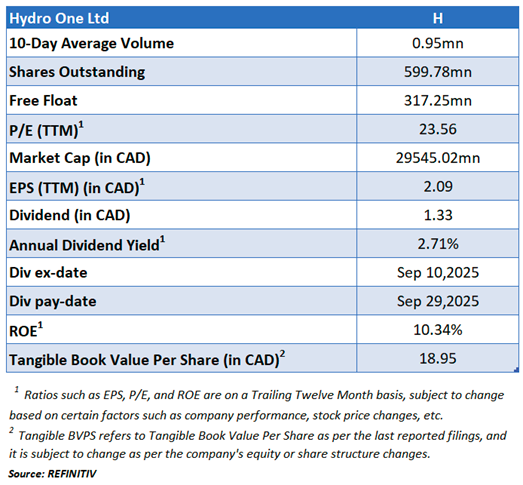
Hydro One Ltd. (TSX: H) operates regulated transmission and distribution assets in Ontario. The area's largest electricity provider serves nearly 1.5 million customers. Transmission accounts for roughly 60% of the company's rate base, with distribution accounting for the remainder. Hydro One operates a small telecom business, Acronym Solutions, with annual revenue contributing less than 1% to consolidated results. The province of Ontario holds an approximate 47% common equity stake.
Kalkine’s Low Carbon Research Report covers the Key Investment Highlights, Key Financial Metrics, Risks, Technical Analysis along with the Valuation, Target Price, and Recommendation on the stock.

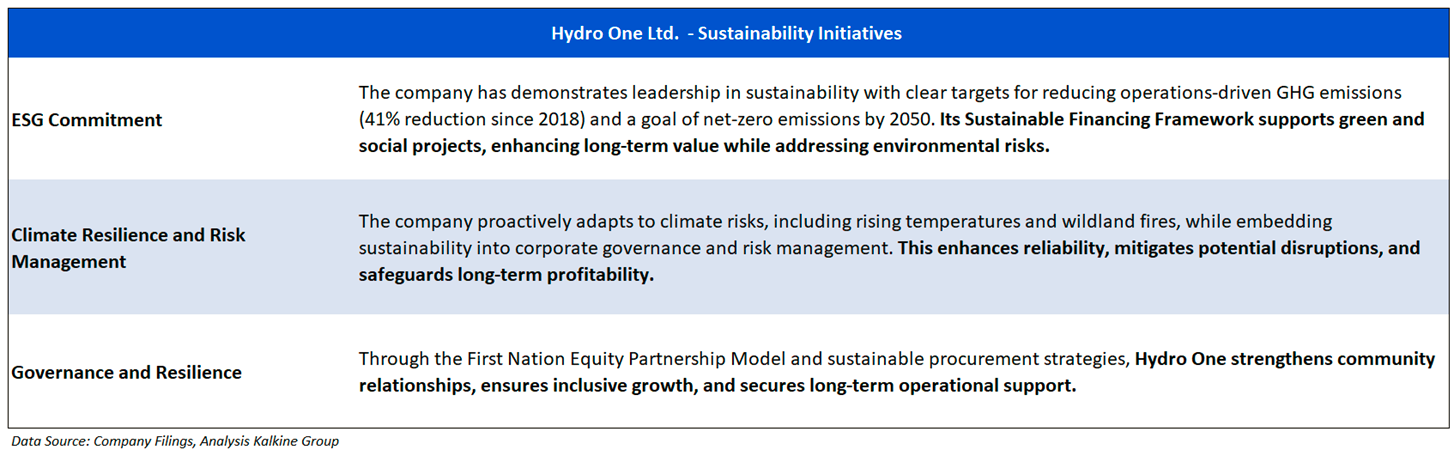
The shift toward a low-carbon economy is one of the most significant challenges of current time, spurred by the urgent need to combat climate change and reduce the environmental impact of corporate activities. This report covers the TSX-listed low-carbon emission company, Hydro One Ltd. (TSX: H), that is committed to sustainability and responsible environmental practices.
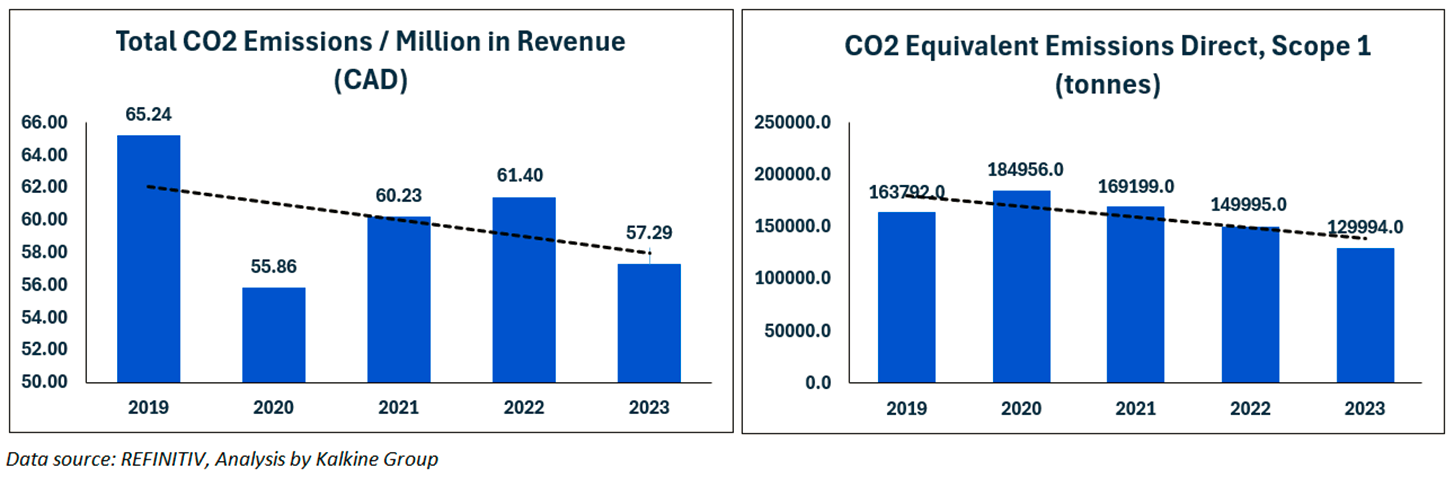
Carbon and Waste Management - Key Metrics
Hydro One Ltd. (TSX: H) has steadily cut its direct Scope 1 CO₂ emissions from 163,792 tonnes in 2019 to 129,994 tonnes in 2023, showing consistent progress in operational sustainability.
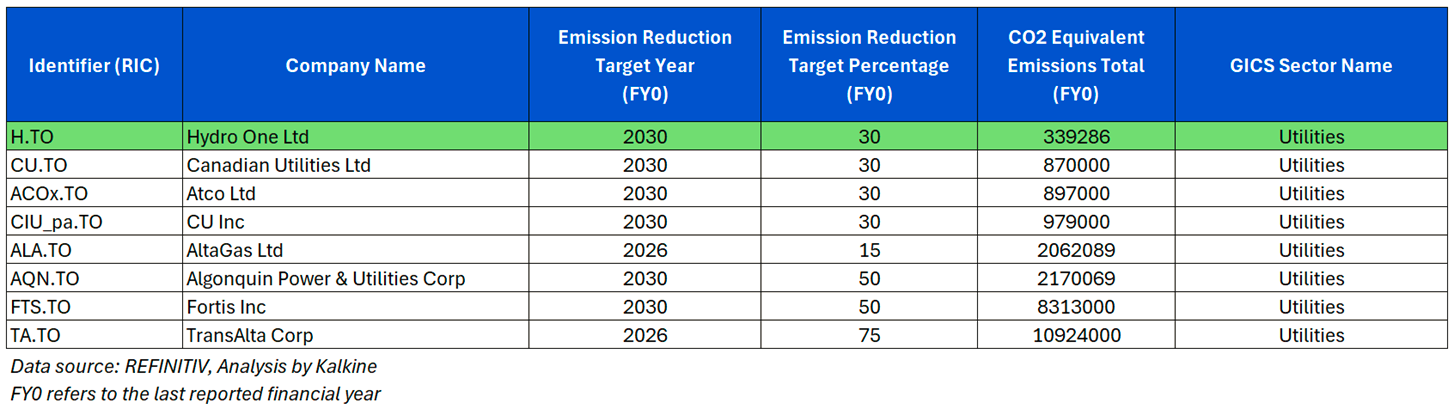
Peer Comparison: Carbon Emission Metrics


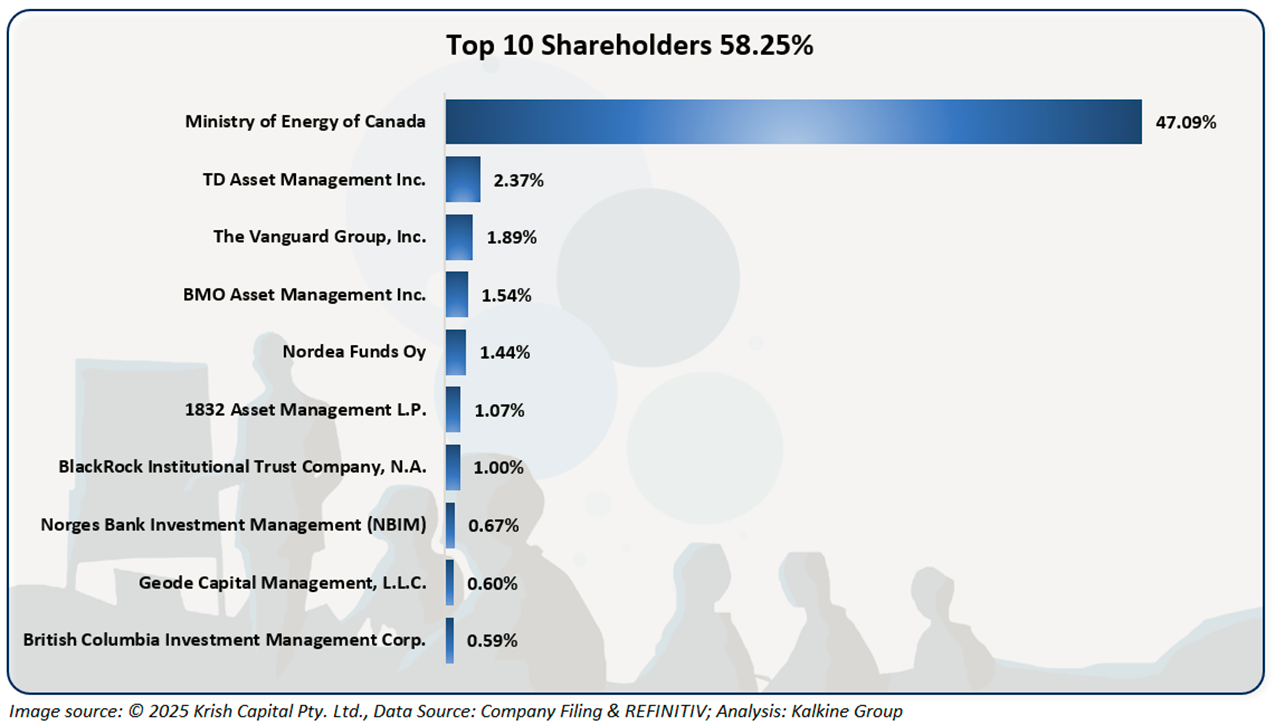
The top 10 shareholders together form ~47.09% of the total shareholding. Ministry of Energy of Canada and TD Asset Management Inc. hold a maximum stake in the company at ~47.09% and ~2.37%, respectively.

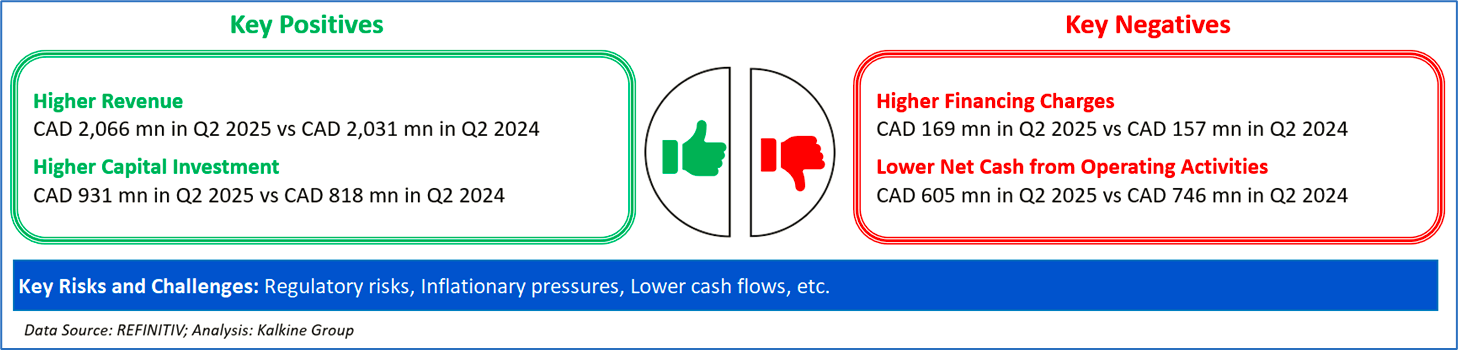
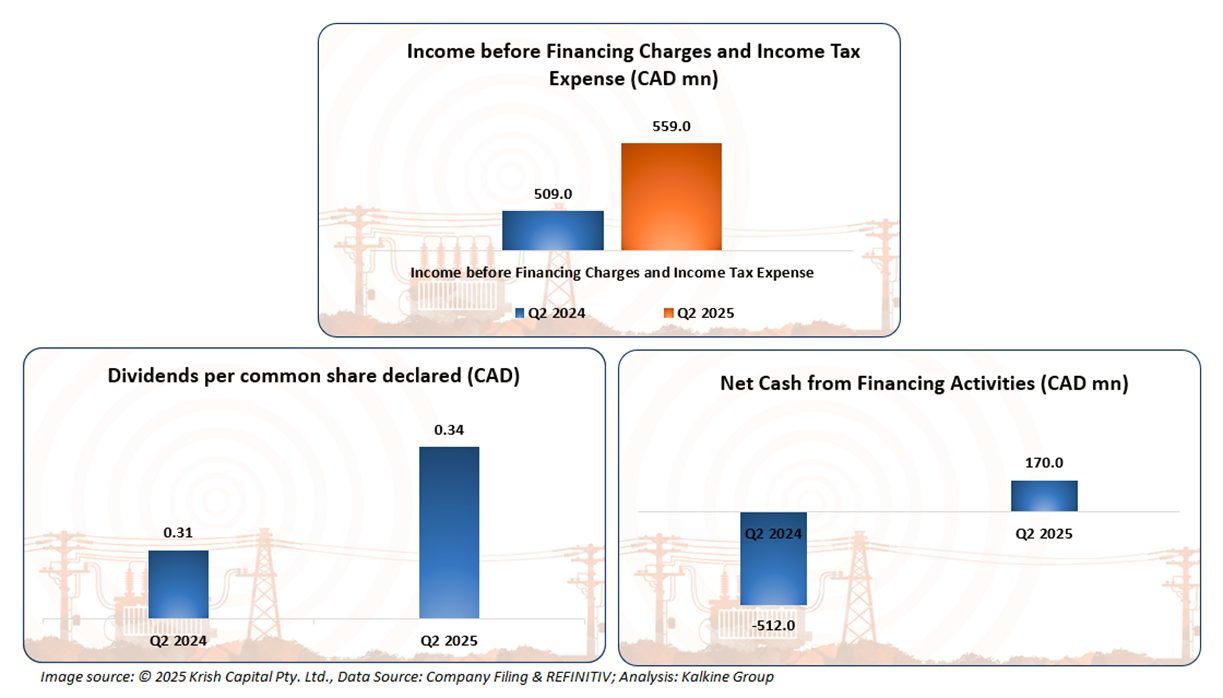
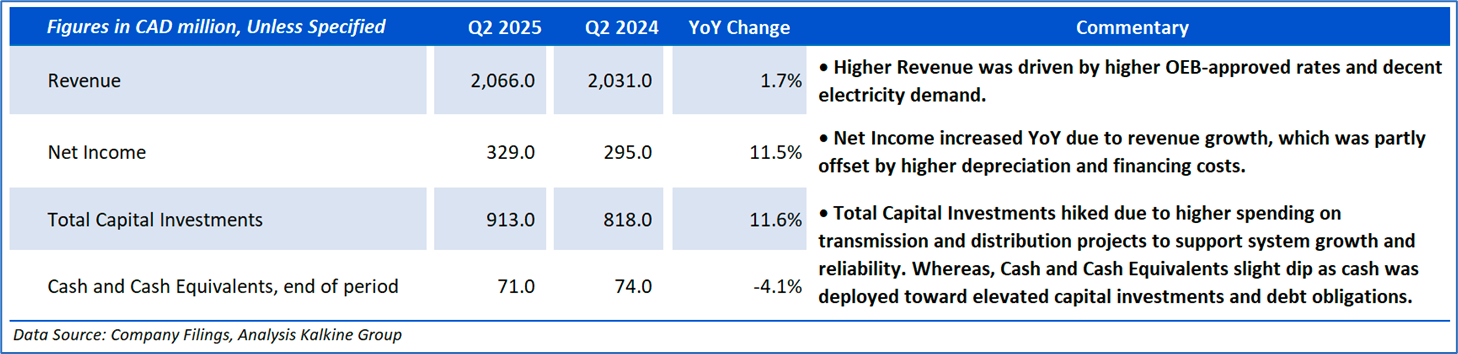
The company reported rising financials in Q2 2025, where it clocked healthy growth under its Income before Financing Charges and Income Tax Expense, which is a key positive. Furthermore, it witnessed healthy Net Cash from Financing Activities and elevated Dividends per common share declared, displaying its decent profitability and operational momentum.
Section 2: Business Updates and Financial Highlights

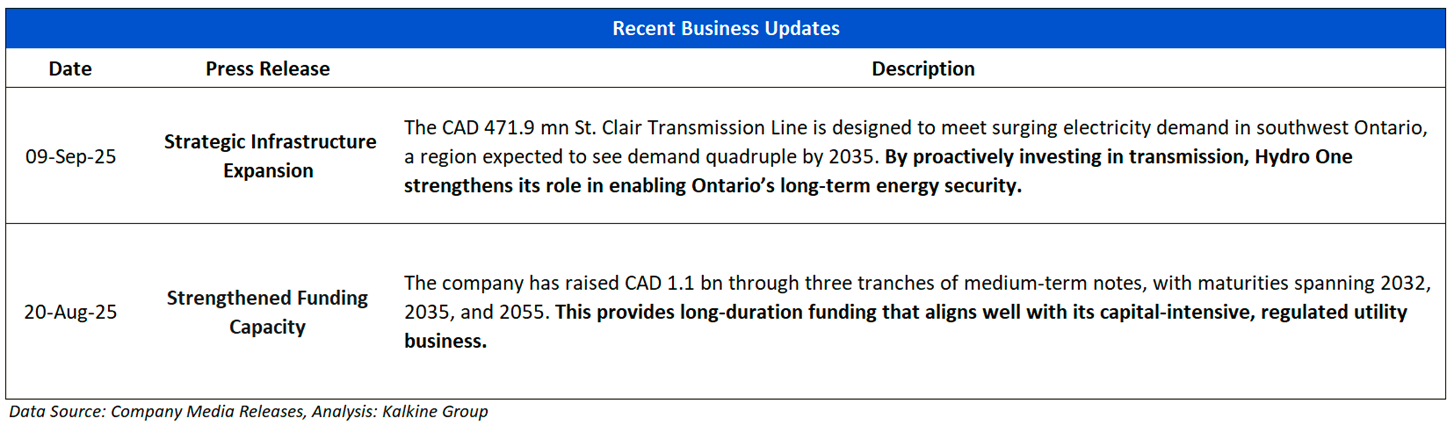
The picture below gives an overview of the company’s recent activities, such as an announcement regarding Strategic Infrastructure Expansion and Strengthened Funding Capacity.

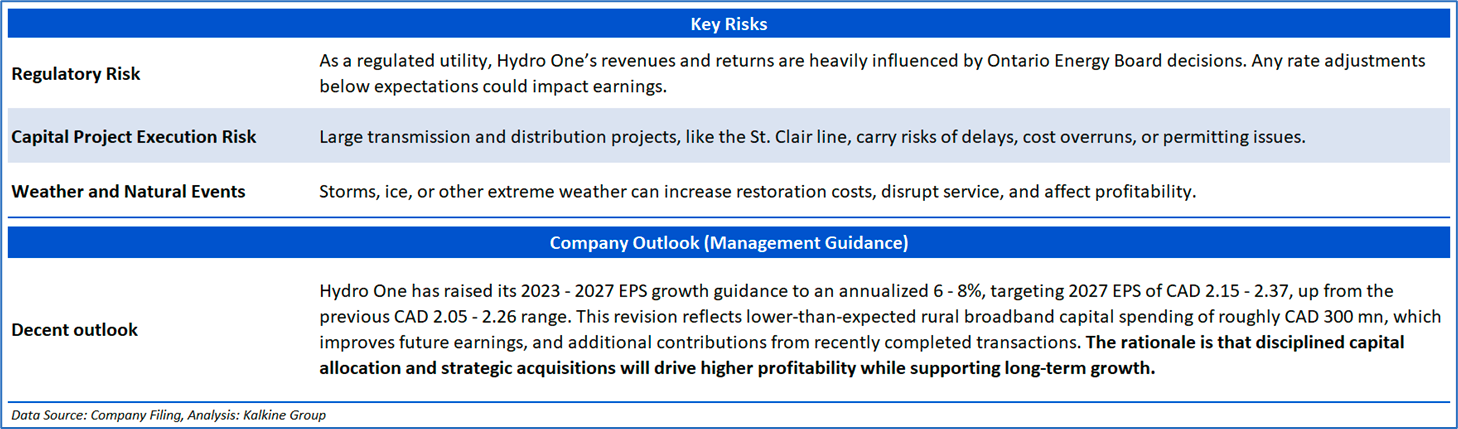
Section 3: Key Risks and Company Outlook
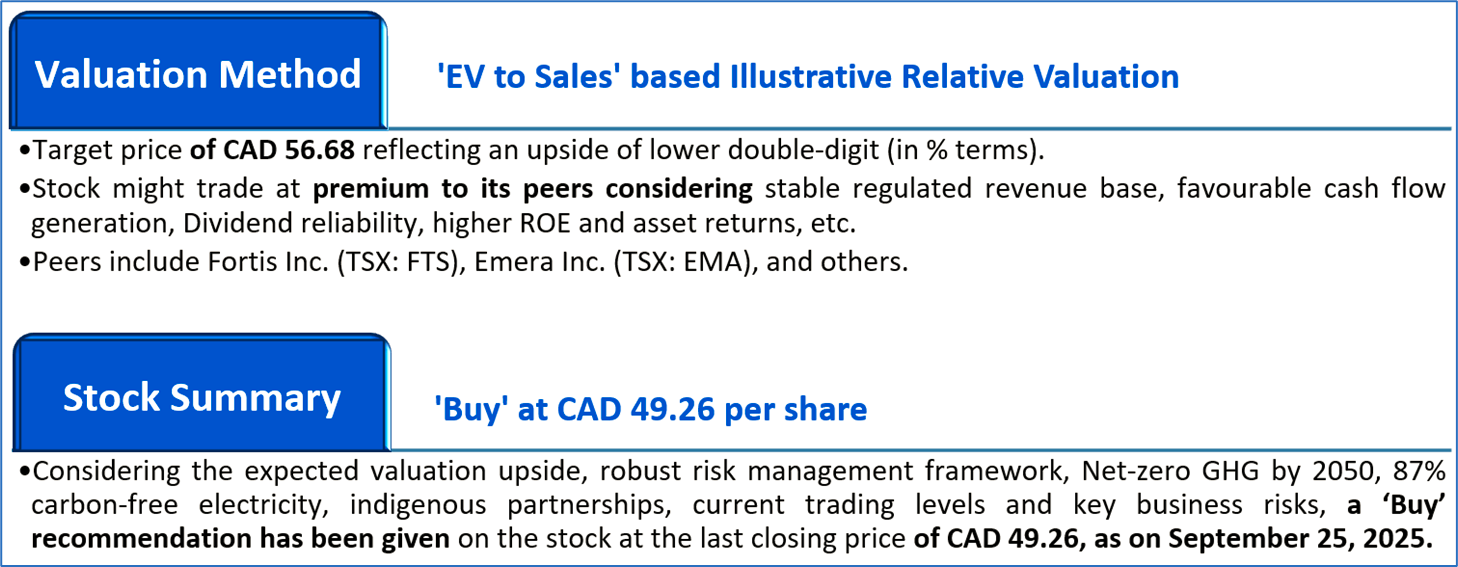
Section 4: Stock Recommendation Summary:


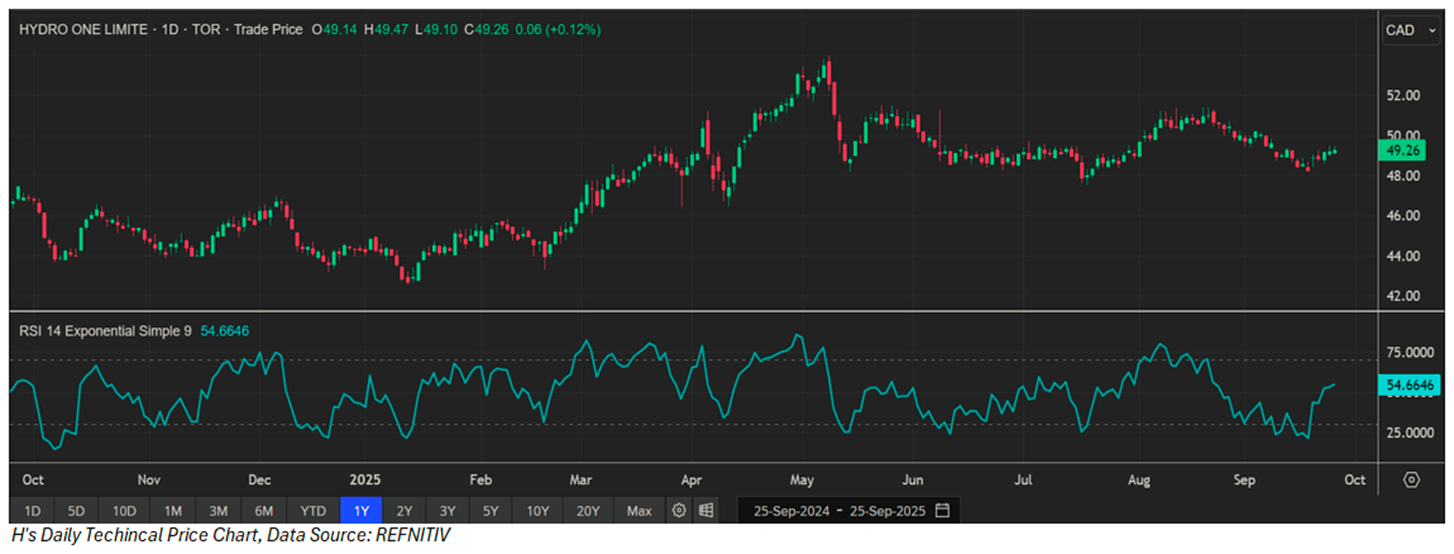
The stock has witnessed an upside of ~2.07% and ~0.79% over the last 1 week and 3 months respectively. Moreover, it is trading above the average 52-week high price of CAD 53.98 and 52-week low price of CAD 42.52, providing an opportunity to ride the trend.

Valuation Methodology: EV to Sales Multiple Based Relative Valuation (Illustrative):

Markets are trading in a highly volatile zone currently due to certain macroeconomic issues and geopolitical tensions prevailing. Therefore, it is prudent to follow a cautious approach while investing.
Note 1: Past performance is not a reliable indicator of future performance.
Note 2: The reference date for all price data, currency, technical indicators, support, and resistance levels is September 25, 2025. The reference data in this report has been partly sourced from REFINITIV.
Note 3: Investment decisions should be made depending on an individual's appetite for upside potential, risks, holding duration, and any previous holdings. An 'Exit' from the stock can be considered if the Target Price mentioned as per the Valuation and or the technical levels provided has been achieved and is subject to the factors discussed above.
Note 4: Dividend Yield may vary as per the stock price movement.
Note 5: Kalkine reports are prepared based on the stock prices captured either from REFINITIV or Trading View. Typically, REFINITIV or Trading View may reflect stock prices with a delay which could be a lag of 25-30 minutes. There can be no assurance that future results or events will be consistent with the information provided in the report. The information is subject to change without any prior notice.
Technical Indicators Defined: -
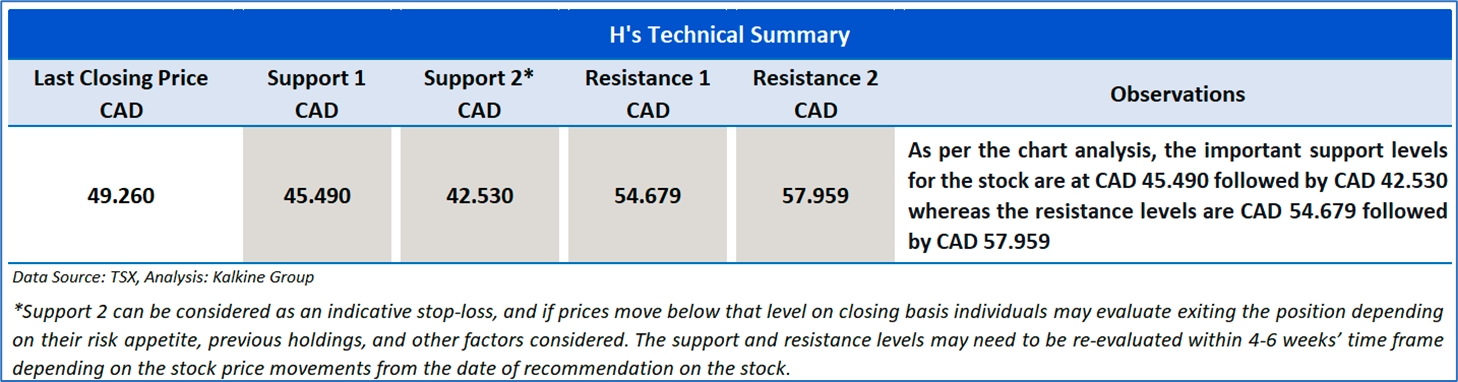
Support: A level at which the stock prices tend to find support if they are falling, and a downtrend may take a pause backed by demand or buying interest. Support 1 refers to the nearby support level for the stock and if the price breaches the level, then Support 2 may act as the crucial support level for the stock.
Resistance: A level at which the stock prices tend to find resistance when they are rising, and an uptrend may take a pause due to profit booking or selling interest. Resistance 1 refers to the nearby resistance level for the stock and if the price surpasses the level, then Resistance 2 may act as the crucial resistance level for the stock.
Stop-loss: It is a level to protect further losses in case of unfavourable movement in the stock prices.
Disclaimer-
This report has been issued by Kalkine Limited (Company number 07903332), a private limited company, incorporated in England and Wales ("Kalkine”). Kalkine.co.uk and associated pages are published by Kalkine. Kalkine is authorised and regulated by the Financial Conduct Authority under reference number 579414.
The information in this report and on the Kalkine website has been prepared from a wide variety of sources, which Kalkine, to the best of its knowledge and belief, considers accurate. Kalkine has made every effort to ensure the reliability of information contained in its reports, newsletters and websites. All information represents our views at the date of publication and may change without notice. The information in this report does not constitute an offer to sell securities or other financial products or a solicitation of an offer to buy securities or other financial products. Our reports contain non personalized recommendations to invest in securities and other financial products.
Kalkine does not offer financial advice based upon your personal financial situation or goals, and we shall not be held liable for any investment or trading losses you may incur by using the opinions expressed in our reports, publications, market updates, news alerts and corporate profiles. Kalkine does not intend to exclude any liability which it is not permitted to exclude under applicable law or regulation. Kalkine’s non-personalised advice does not in any way endorse or recommend individuals, investment products or services for your personal financial situation. You should discuss your portfolios and the risk tolerance level appropriate for your personal financial situation, with a professional authorised financial planner and adviser. You should be aware that the value of any investment and the income from it can go down as well as up and you may not get back the amount invested.
Please also read our Terms & Conditions for further information. Employees and/or associates of Kalkine and its related entities may hold interests in the securities or other financial products covered in this report or on the Kalkine website. Any such employees and associates are required to comply with certain safeguards, procedures and disclosures as required by law.
Kalkine Media Limited, an affiliate of Kalkine, may have received, or be entitled to receive, financial consideration in connection with providing information about certain entity(s) covered on its website including entities covered in this report.
Past performance is not a reliable indicator of future performance.

 Please wait processing your request...