Section 1: Company Overview and Fundamentals
1.1 Company Overview:
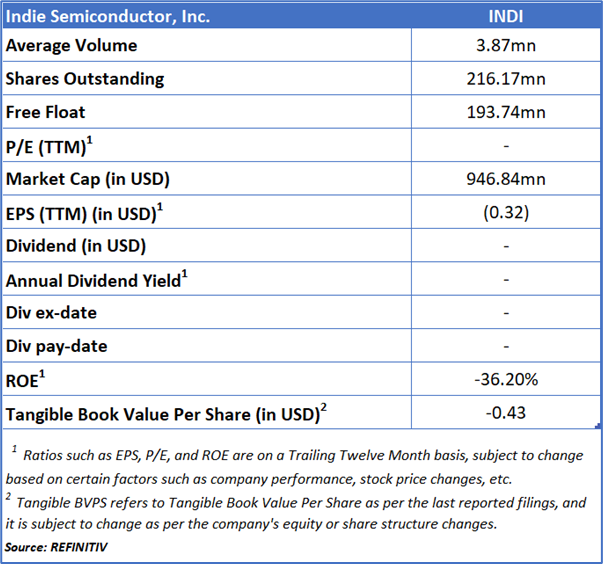
Indie Semiconductor, Inc. (NASDAQ: INDI) develops and provides automotive-grade semiconductors and software platforms that power advanced driver assistance systems (ADAS), autonomous driving, in-cabin and connected car user experiences, and vehicle electrification technologies.
Kalkine’s American Tech Report covers the Company Overview, Key positives & negatives, Investment summary, Key investment metrics, Top 10 shareholding, Business updates and insights into company recent financial results, Key Risks & Outlook, Price performance and technical summary, Target Price, and Recommendation on the stock.
Price Performance:
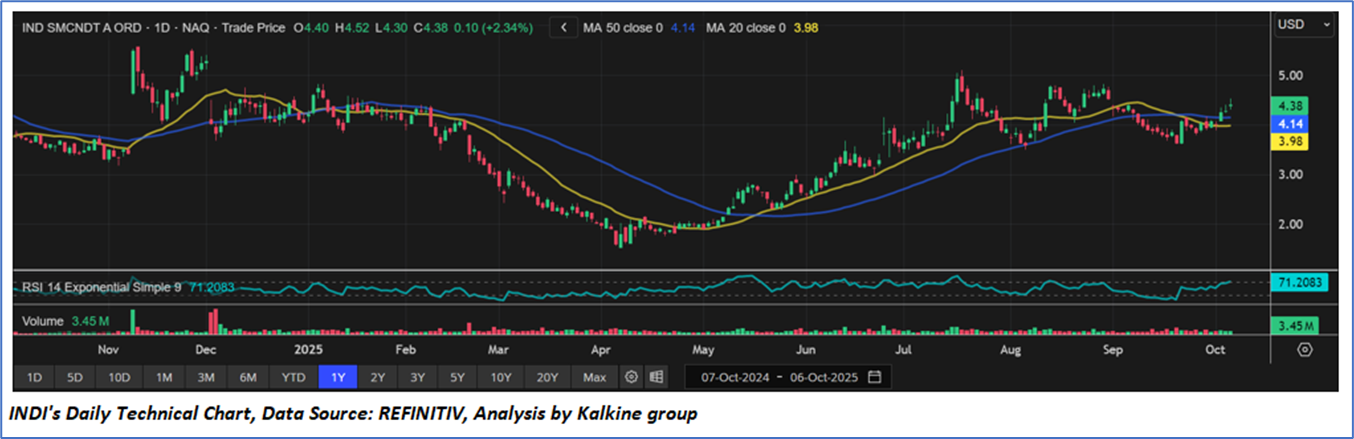
- Indie Semiconductor shows a strong recovery trend following a prolonged downtrend that bottomed out around April 2025. After consolidating at low levels, the price began to rebound in May, supported by consistent higher highs and higher lows — indicating a shift in momentum from bearish to bullish sentiment.
- The 20-day moving average (MA) has recently crossed above the 50-day MA, forming a bullish crossover, which often signals the potential for continued upside momentum. The current price of around USD 4.38 trades above both moving averages, reinforcing a short-term bullish outlook.
- The Relative Strength Index (RSI) stands near 71, approaching the overbought zone, suggesting that while momentum remains positive, a short-term pullback or consolidation cannot be ruled out. Volume levels have also increased modestly, indicating renewed investor interest and accumulation.
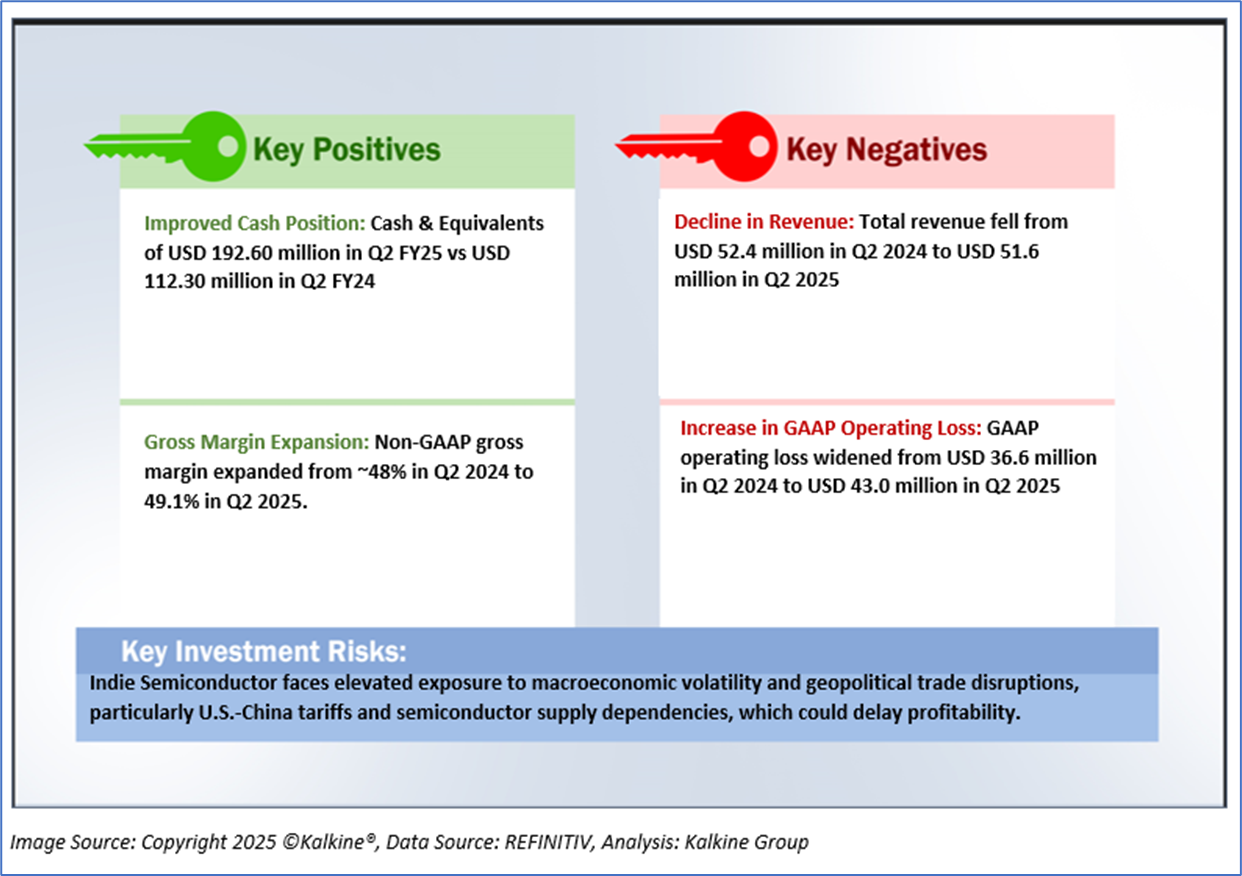
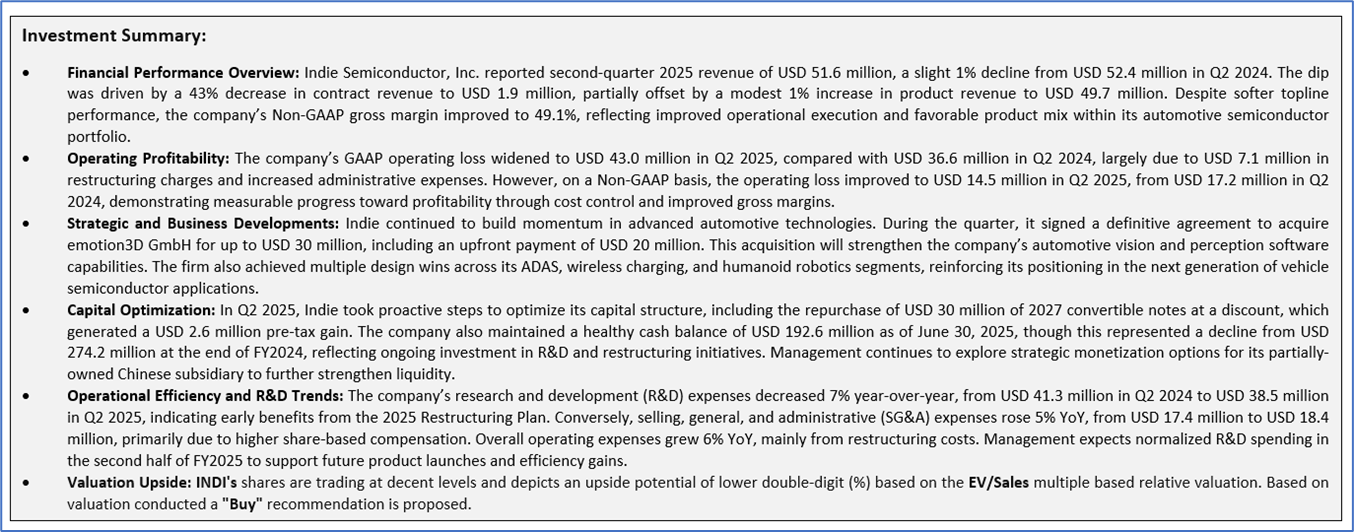
1.2 The Key Positives, Negatives, and Investment summary
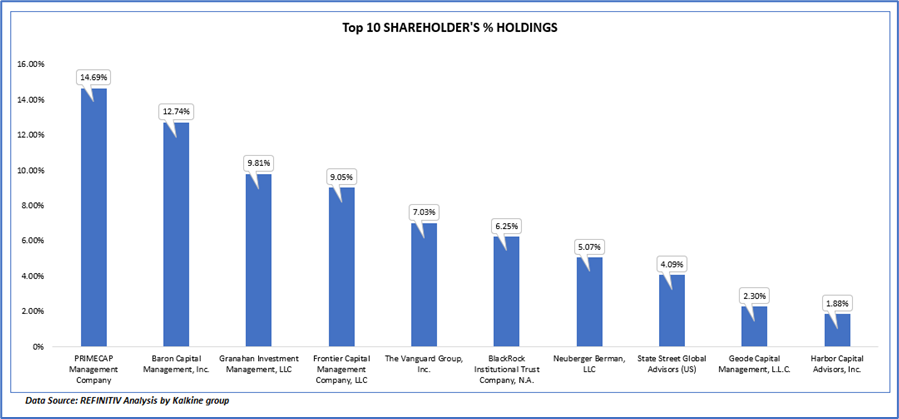
1.3 Top 10 shareholders:
The top 10 shareholders together form ~72.91% of the total shareholding, signifying concentrated shareholding. PRIMECAP Management Company and Baron Capital Management, Inc. are the biggest shareholders, holding the maximum stake in the company at ~14.69% and ~12.74%, respectively.
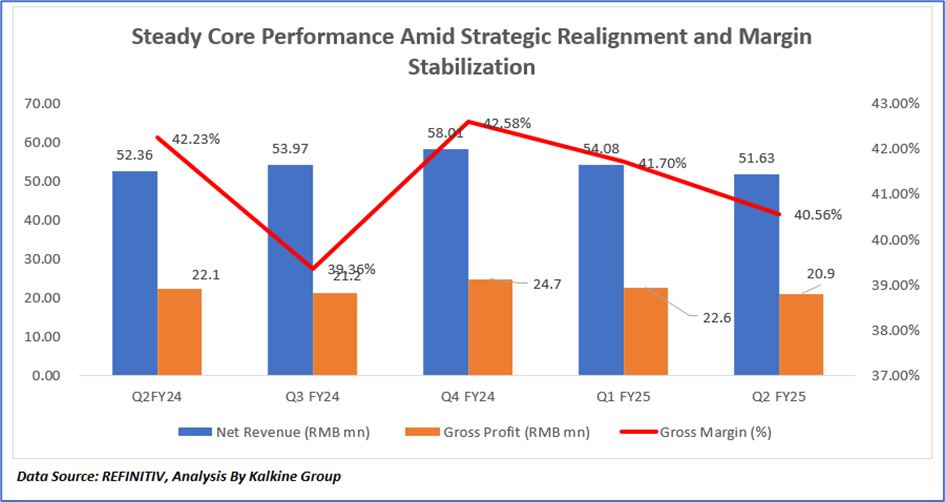
1.4 Key Metrics:
The chart illustrates a softening trend in Indie Semiconductor’s financial performance from Q4 FY24 through Q2 FY25, characterized by moderating revenue, declining gross profit, and a gradual compression in gross margins. After peaking at USD 58.0 million in Q4 FY24, revenue fell to USD 54.1 million in Q1 FY25 and further to USD 51.6 million in Q2 FY25, largely due to a slowdown in contract revenue as customer development projects tapered off, even as product sales in ADAS and vision segments remained steady. Correspondingly, gross profit declined from USD 24.7 million to USD 20.9 million, reflecting reduced contribution from higher-margin services. Gross margin decreased from 42.6% in Q4 FY24 to 40.6% in Q2 FY25, driven by an unfavorable shift in product mix toward lower-margin components, underutilization of manufacturing capacity amid softer sales, and minor foreign exchange effects. Compared to Q2 FY24, margins also eased by nearly 170 basis points, highlighting the impact of transitional restructuring and product realignment. Overall, the observed trend signifies a period of normalization following a strong finish to FY24, with near-term margin pressure stemming from cyclical and strategic adjustments rather than underlying demand weakness in the company’s core automotive semiconductor business.
Section 2: Business Updates and Financial Highlights
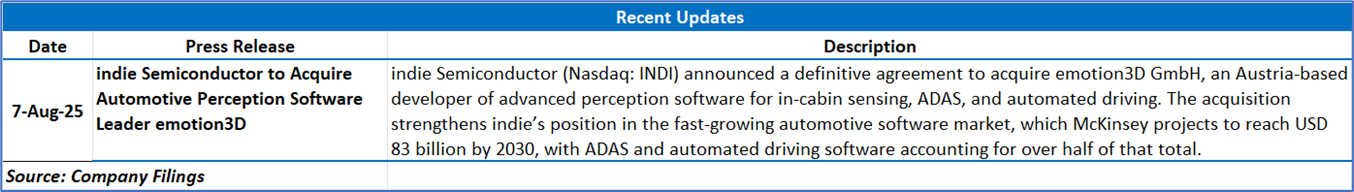
2.1 Recent Updates:
The below picture gives an overview of the recent updates:
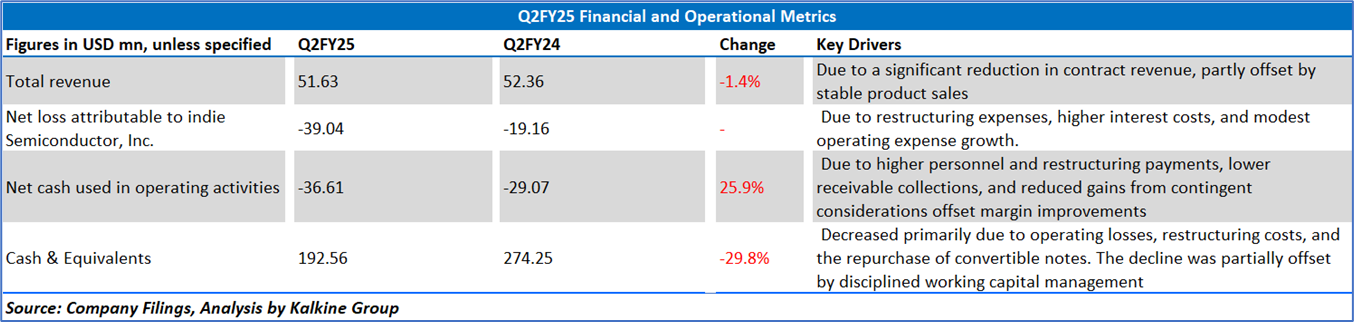
2.2 Insights of Q2FY25:
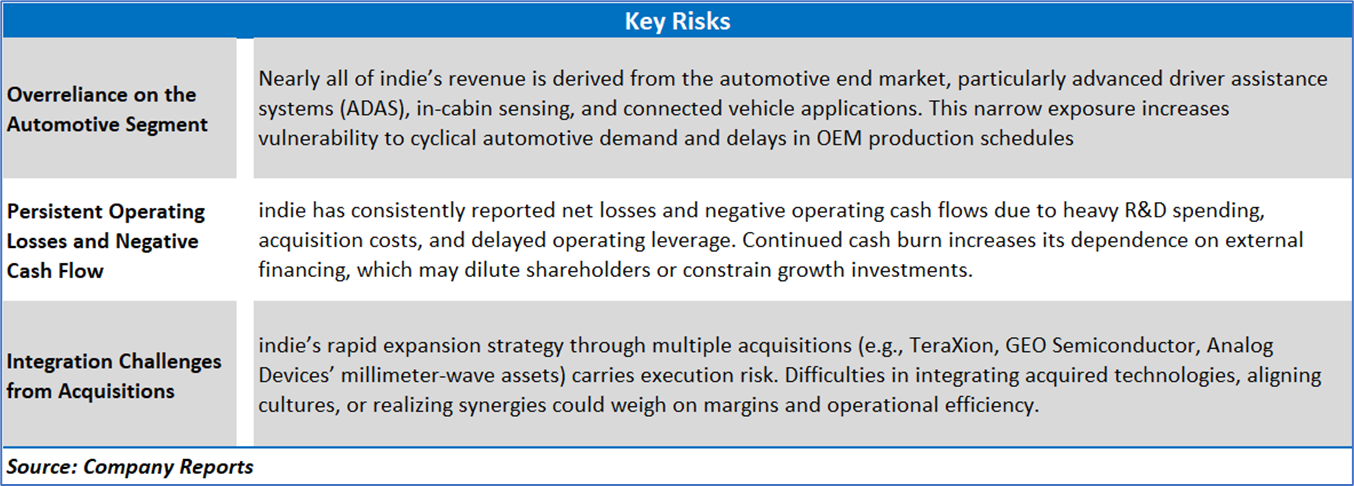
Section 3: Key Risks and Outlook:
Section 4: Stock Recommendation Summary:
4.1 Technical Summary:
Price Performance:
- Indie Semiconductor shows a strong recovery trend following a prolonged downtrend that bottomed out around April 2025. After consolidating at low levels, the price began to rebound in May, supported by consistent higher highs and higher lows — indicating a shift in momentum from bearish to bullish sentiment.
- The 20-day moving average (MA) has recently crossed above the 50-day MA, forming a bullish crossover, which often signals the potential for continued upside momentum. The current price of around USD 4.38 trades above both moving averages, reinforcing a short-term bullish outlook.
- The Relative Strength Index (RSI) stands near 71, approaching the overbought zone, suggesting that while momentum remains positive, a short-term pullback or consolidation cannot be ruled out. Volume levels have also increased modestly, indicating renewed investor interest and accumulation.
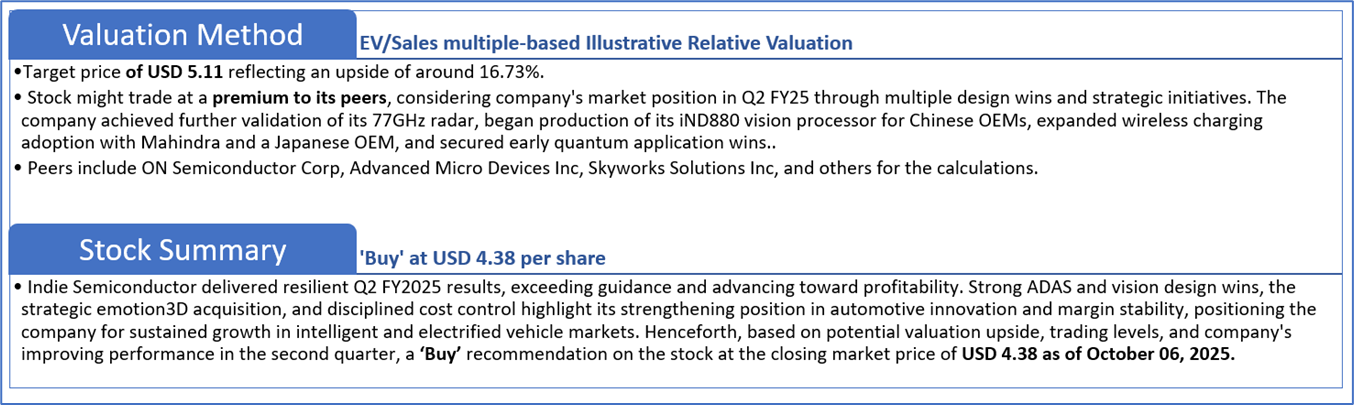
4.2 Fundamental Valuation
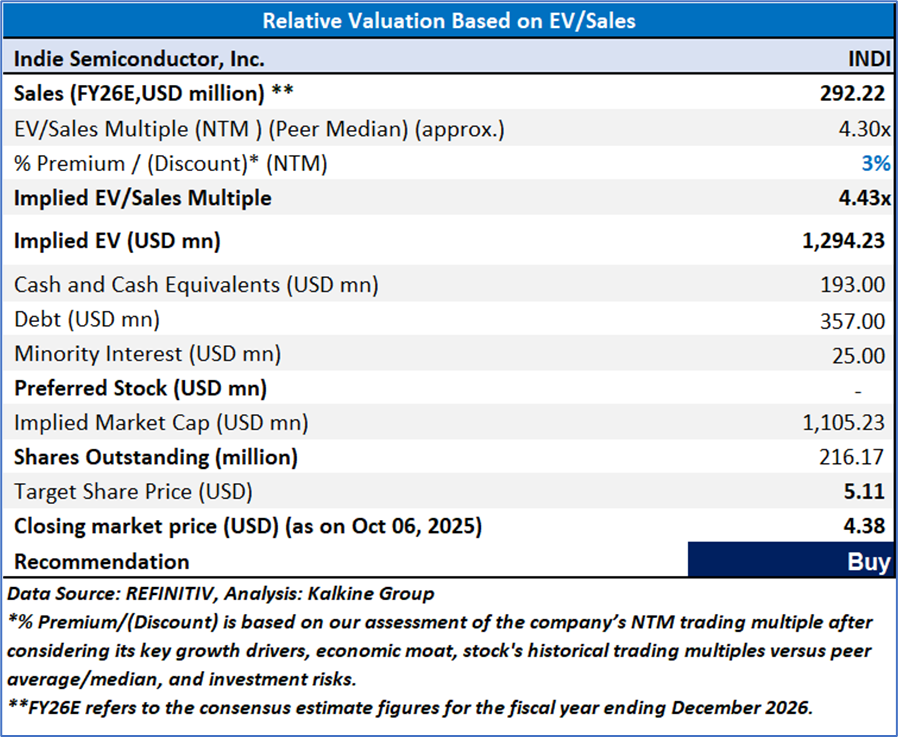
Valuation Methodology: EV/EBITDA Multiple Based Relative Valuation
Markets are trading in a highly volatile zone currently due to certain macroeconomic issues and geopolitical tensions prevailing. Therefore, it is prudent to follow a cautious approach while investing.
Note 1: Past performance is not a reliable indicator of future performance.
Note 2: The reference date for all price data, currency, technical indicators, support, and resistance levels is October 06, 2025. The reference data in this report has been partly sourced from REFINITIV.
Note 3: Investment decisions should be made depending on an individual's appetite for upside potential, risks, holding duration, and any previous holdings. An 'Exit' from the stock can be considered if the Target Price mentioned as per the Valuation and or the technical levels provided has been achieved and is subject to the factors discussed above.
Note 4: The report publishing date is as per the Pacific Time Zone.
Technical Indicators Defined: -
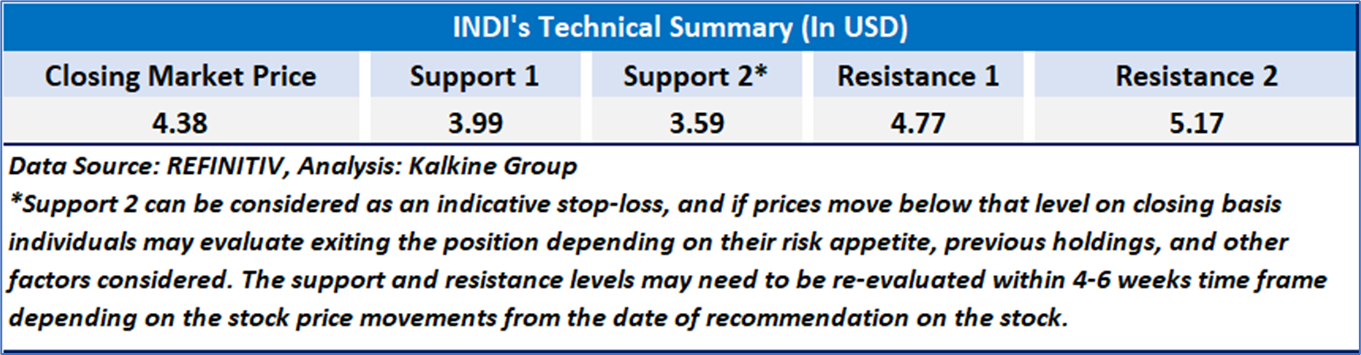
Support: A level at which the stock prices tend to find support if they are falling, and a downtrend may take a pause backed by demand or buying interest. Support 1 refers to the nearby support level for the stock and if the price breaches the level, then Support 2 may act as the crucial support level for the stock.
Resistance: A level at which the stock prices tend to find resistance when they are rising, and an uptrend may take a pause due to profit booking or selling interest. Resistance 1 refers to the nearby resistance level for the stock and if the price surpasses the level, then Resistance 2 may act as the crucial resistance level for the stock.
Stop-loss: It is a level to protect against further losses in case of unfavorable movement in the stock prices.
Disclaimer-
This report has been issued by Kalkine Limited (Company number 07903332), a private limited company, incorporated in England and Wales ("Kalkine”). Kalkine.co.uk and associated pages are published by Kalkine. Kalkine is authorised and regulated by the Financial Conduct Authority under reference number 579414.
The information in this report and on the Kalkine website has been prepared from a wide variety of sources, which Kalkine, to the best of its knowledge and belief, considers accurate. Kalkine has made every effort to ensure the reliability of information contained in its reports, newsletters and websites. All information represents our views at the date of publication and may change without notice. The information in this report does not constitute an offer to sell securities or other financial products or a solicitation of an offer to buy securities or other financial products. Our reports contain non personalized recommendations to invest in securities and other financial products.
Kalkine does not offer financial advice based upon your personal financial situation or goals, and we shall not be held liable for any investment or trading losses you may incur by using the opinions expressed in our reports, publications, market updates, news alerts and corporate profiles. Kalkine does not intend to exclude any liability which it is not permitted to exclude under applicable law or regulation. Kalkine’s non-personalised advice does not in any way endorse or recommend individuals, investment products or services for your personal financial situation. You should discuss your portfolios and the risk tolerance level appropriate for your personal financial situation, with a professional authorised financial planner and adviser. You should be aware that the value of any investment and the income from it can go down as well as up and you may not get back the amount invested.
Please also read our Terms & Conditions for further information. Employees and/or associates of Kalkine and its related entities may hold interests in the securities or other financial products covered in this report or on the Kalkine website. Any such employees and associates are required to comply with certain safeguards, procedures and disclosures as required by law.
Kalkine Media Limited, an affiliate of Kalkine, may have received, or be entitled to receive, financial consideration in connection with providing information about certain entity(s) covered on its website including entities covered in this report.
Past performance is not a reliable indicator of future performance.
 Please wait processing your request...