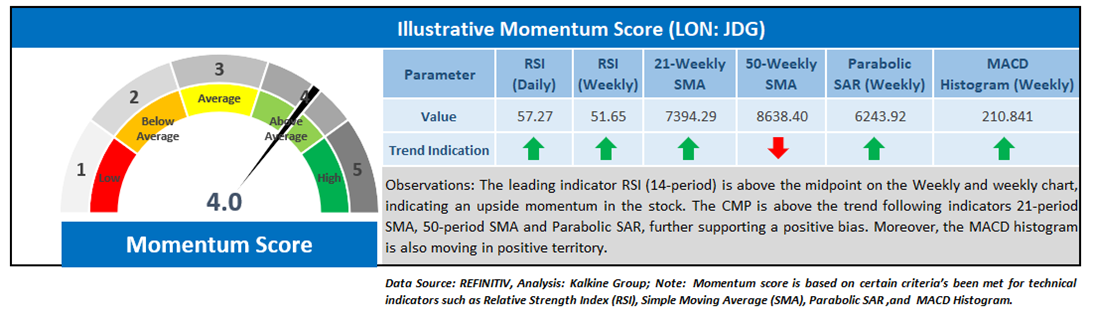
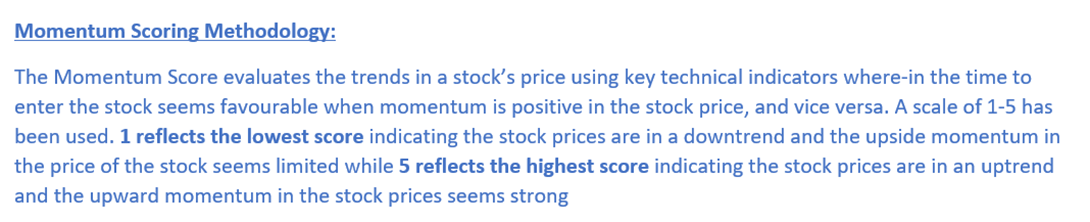
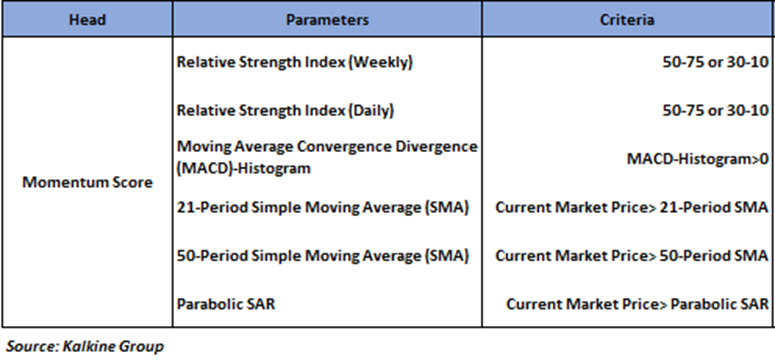
Company Overview: Judges Scientific PLC (LON: JDG) is a United Kingdom-based company, which is focused on acquiring and developing companies within the scientific instrument sector. The principal activities of the company and its subsidiaries comprise the design, manufacture and sale of scientific instruments. The company and its subsidiaries operate two segments: materials sciences and vacuum. The report covers the Price Action and Technical Indicators Analysis along with the Target Levels, Stop Loss, and Recommendation on this one stock. Noted below is the illustrative momentum score based on technical indicators for the stock:

Technical Observation (on the weekly Chart)
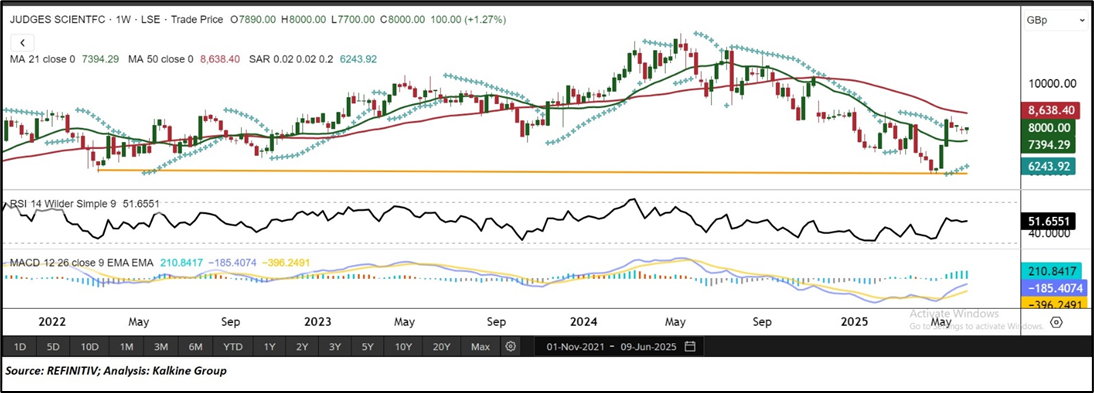
On the daily weekly, JDG stock maintains strong bullish momentum above key support, with bullish candlestick patterns and supportive technical indicators highlighting positive sentiment. Sustained price action above support suggests increasing investor confidence and demand. This setup indicates potential for further upside, provided the stock remains above these crucial support levels. This upward move is accompanied by increased trading volume, signalling growing investor interest. The Relative Strength Index (RSI) at 51.65 confirms steady bullish momentum, while the 21-period Simple Moving Averages (SMAs) are positioned well below the current price, acting as solid support. Collectively, these technical factors suggest a high-probability bullish outlook for JDG.
Conclusion
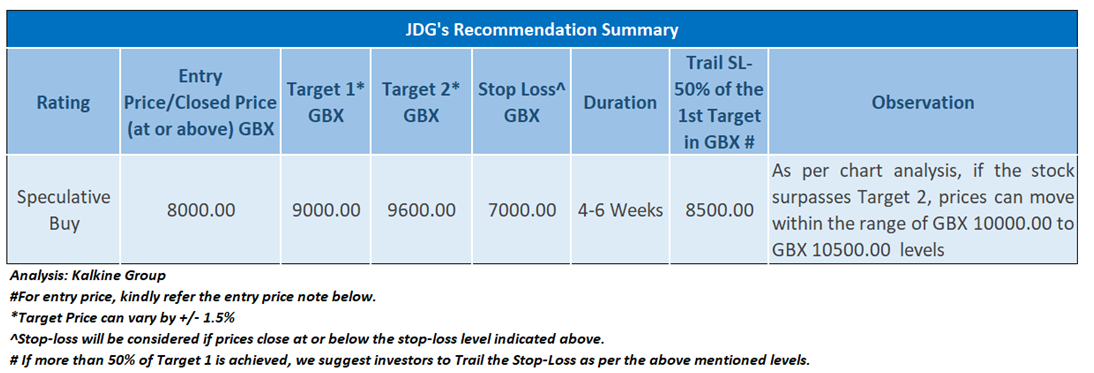
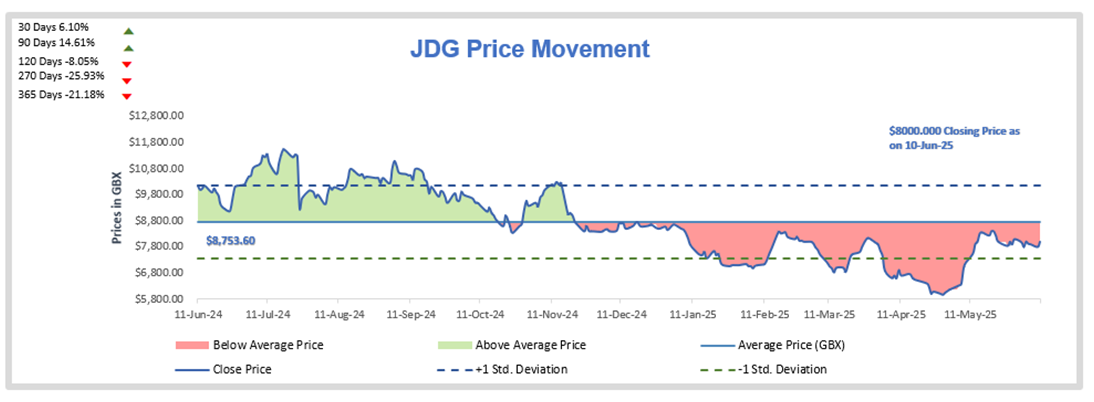
As per the above-mentioned price action and technical indicators analysis, a ‘Speculative Buy’ rating has been given on Judges Scientific PLC (LON: JDG) at the Closing Market Price of GBX 8000.00, as on 10th June 2025. Markets are trading in a highly volatile zone currently due to certain macroeconomic issues and prevailing geopolitical tensions. Therefore, it is prudent to follow a cautious approach while making investment decisions.

Note 1: Past performance is not a reliable indicator of future performance.
Note 2: Investment decisions should be made depending on an individual’s appetite for upside potential, risks, and any previous holdings. This recommendation is purely based on technical analysis, and fundamental analysis has not been considered in this report. Individuals can consider exiting from the stock if the Target Price or Stop loss mentioned as per the technical analysis has been achieved and is subject to the factors discussed above.
Note 3: Related Risks: This report may be looked at from a high-risk perspective and recommendations are provided for a short duration. Recommendations provided in this report are solely based on technical parameters, and the fundamental performance of the stocks has not been considered in the decision-making process. Other factors which could impact the stock prices include market risks, regulatory risks, interest rates risks, currency risks, social and political instability risks etc.
Note 4: The holding duration for recommendations is 4-6 weeks; however, an extension of further 2 weeks may be considered with an update report in case the opportunity looks technically well placed. The maximum holding duration is expected to be 8 weeks post which the position will be closed automatically in case no resistance, support and or stop loss levels are hit at the close price of the due date.
Note 5: Kalkine reports are prepared based on the stock prices captured either from the London Stock Exchange (LSE) and or REFINITIV. Typically, both sources (LSE and or REFINITIV) may reflect stock prices with a delay which could be a lag of 15-20 minutes. There can be no assurance that future results or events will be consistent with the information provided in the report. The information is subject to change without any prior notice.
Note 6: How to Read the Charts?
The Green colour line reflects the 21-period moving average while the red line indicates the 50-period moving average. SMA helps to identify existing price trends. If the prices are trading above the 21-period and 50-period moving average, then it shows prices are currently trading in a bullish trend.
The Black colour line in the chart’s lower segment reflects the Relative Strength Index (14-Period) which indicates price momentum and signals momentum in trend. A reading of 70 or above suggests overbought status while a reading of 30 or below suggests an oversold status.
The Blue colour bars in the chart’s lower segment show the volume of the stock. The volume is the number of shares that changed hands during a given day. Stocks with high volumes are more liquid than stocks with lesser volume as liquidity in stocks helps in easier and faster execution of the order.
The Orange colour lines are the trend lines drawn by connecting two or more price points and used for trend identification purposes. The trend line also acts as a line of support and resistance.
Technical Indicators Defined: -
Stop-loss: In general, it is a level to protect further losses in case of unfavourable movement in the stock prices.
Parabolic SAR: Parabolic SAR is a trend-following indicator that acts as a trailing stop. If the price stops rising and reverses below SAR, it indicates the start of a downtrend with SAR above the price following like a trailing stop. Similarly, if the prices stop falling and move above SAR, it indicates the start of an uptrend with SAR below the price following like a trailing stop.
MACD-Histogram: Moving Average Convergence Divergence (MACD)-Histogram is the difference between the MACD and its signal line. A positive value of the MACD-Histogram indicates a positive crossover between MACD and its signal line, whereas a negative value indicates a negative crossover.
The reference date for all price data, currency, technical indicators, support, and resistance levels is as on 10th June 2025. The reference data in this report has been partly sourced from REFINITIV.
Abbreviations
CMP: Current Market Price
SMA: Simple Moving Average
GBP: British pound sterling
GBX: British pence sterling
RSI: Relative Strength Index
Note: Trading decisions require a thorough analysis by individuals. Technical reports in general chart out metrics that may be assessed by individuals before any stock evaluation. The above are illustrative analytical factors used for evaluating stocks; other parameters can be looked at along with additional risks per se. Past performance is neither an indicator nor a guarantee of future performance.
Disclaimer-
This report has been issued by Kalkine Limited (Company number 07903332), a private limited company, incorporated in England and Wales ("Kalkine”). Kalkine.co.uk and associated pages are published by Kalkine. Kalkine is authorised and regulated by the Financial Conduct Authority under reference number 579414.
The information in this report and on the Kalkine website has been prepared from a wide variety of sources, which Kalkine, to the best of its knowledge and belief, considers accurate. Kalkine has made every effort to ensure the reliability of information contained in its reports, newsletters and websites. All information represents our views at the date of publication and may change without notice. The information in this report does not constitute an offer to sell securities or other financial products or a solicitation of an offer to buy securities or other financial products. Our reports contain non personalized recommendations to invest in securities and other financial products.
Kalkine does not offer financial advice based upon your personal financial situation or goals, and we shall not be held liable for any investment or trading losses you may incur by using the opinions expressed in our reports, publications, market updates, news alerts and corporate profiles. Kalkine does not intend to exclude any liability which it is not permitted to exclude under applicable law or regulation. Kalkine’s non-personalised advice does not in any way endorse or recommend individuals, investment products or services for your personal financial situation. You should discuss your portfolios and the risk tolerance level appropriate for your personal financial situation, with a professional authorised financial planner and adviser. You should be aware that the value of any investment and the income from it can go down as well as up and you may not get back the amount invested.
Please also read our Terms & Conditions for further information. Employees and/or associates of Kalkine and its related entities may hold interests in the securities or other financial products covered in this report or on the Kalkine website. Any such employees and associates are required to comply with certain safeguards, procedures and disclosures as required by law.
Kalkine Media Limited, an affiliate of Kalkine, may have received, or be entitled to receive, financial consideration in connection with providing information about certain entity(s) covered on its website including entities covered in this report.
Past performance is not a reliable indicator of future performance.
 Please wait processing your request...