Global Commodity Market Wrap-Up
The metals market reflected mixed trends last week, amid weakening momentum and rising geopolitical concerns that kept investors cautious. Precious metals advanced on safe-haven demand, with gold gaining 0.63% and silver surging 5.04%. Industrial metals moved unevenly as copper declined 2.46%, lead dropped 2.25%, while zinc rose 0.84%, highlighting selective buying interest. As global economic uncertainty lingers and key central bank decisions approach, volatility in the metals space is likely to persist in the near term.
In the energy and agriculture markets, natural gas prices declined 1.47% due to supply pressures despite falling seasonal demand. Crude oil climbed 2.13% on concerns over trade tensions and OPEC’s production policy. U.S. sugar advanced 1.16%, defying broader agricultural softness. These divergent movements reflect ongoing supply-demand imbalances and sensitivity to economic and geopolitical developments. Traders remain alert to global cues and policy shifts that could shape price movements in the sessions ahead.
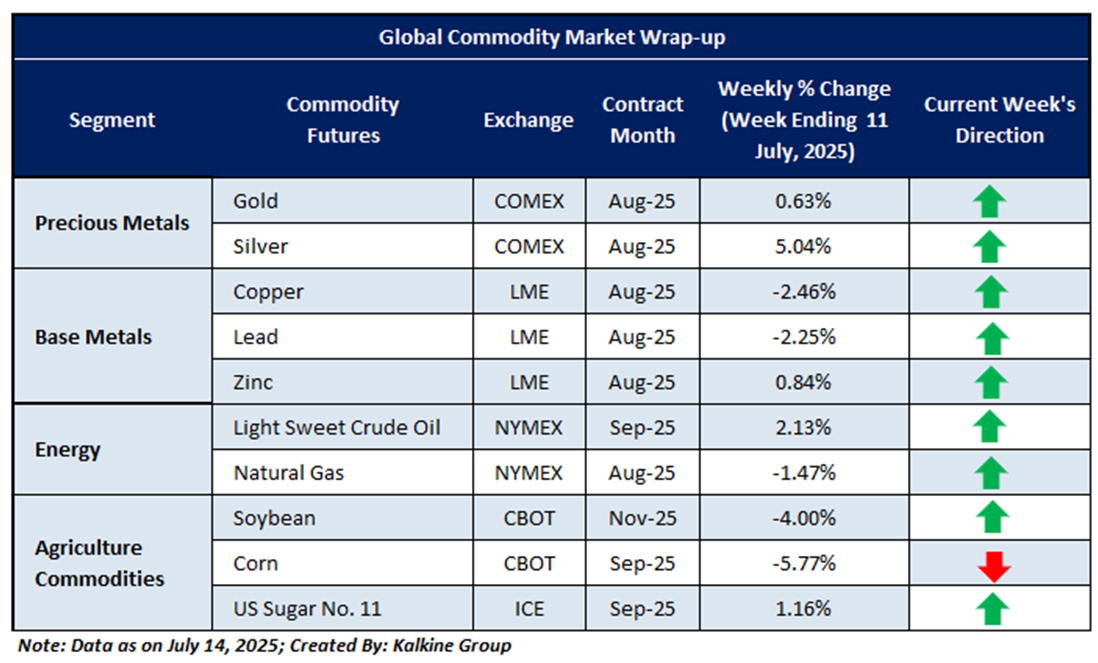
Global commodity prices showed mixed performance last week as markets weighed macroeconomic uncertainty against evolving supply dynamics. Precious metals saw limited upside, with gold and silver consolidating near recent highs amid cautious risk sentiment and shifting rate expectations. Crude oil extended modest gains, supported by ongoing OPEC+ supply concerns and geopolitical tensions, while natural gas prices fell sharply due to oversupply worries. Agricultural commodities traded sideways, reflecting stable demand and favorable weather conditions in key producing regions. Overall, market sentiment remained cautious, with traders closely monitoring upcoming inflation data, central bank policy cues, and global geopolitical developments for further direction.
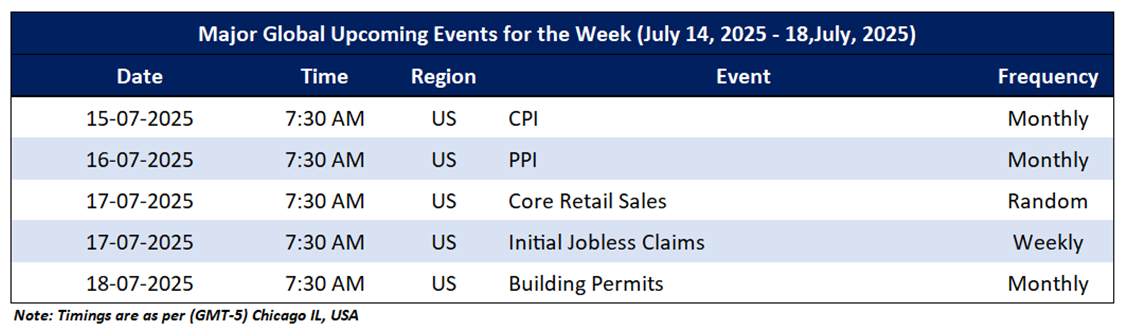
The upcoming Micro and Macroeconomic events that may impact on market sentiments include an update CPI, PPI, Core Retail Sales, Initial Jobless Claims and Building Permits.
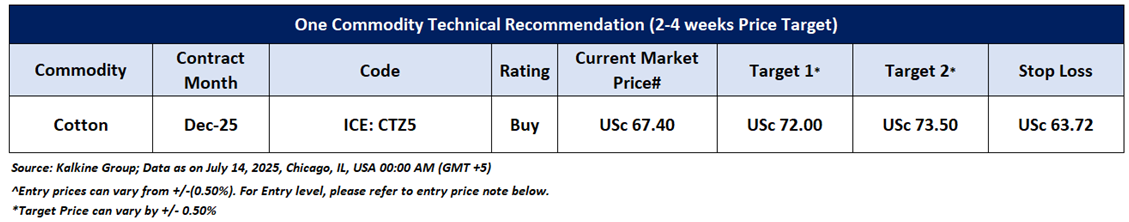
Having understood the global commodities’ performance over the past week, taking cues from major global economic events, and based on technical analysis, noted below is the recommendation with generic insights, entry price, target prices, and stop-loss Cotton December Future (ICE: CTZ5) for the next 2-4-week duration:
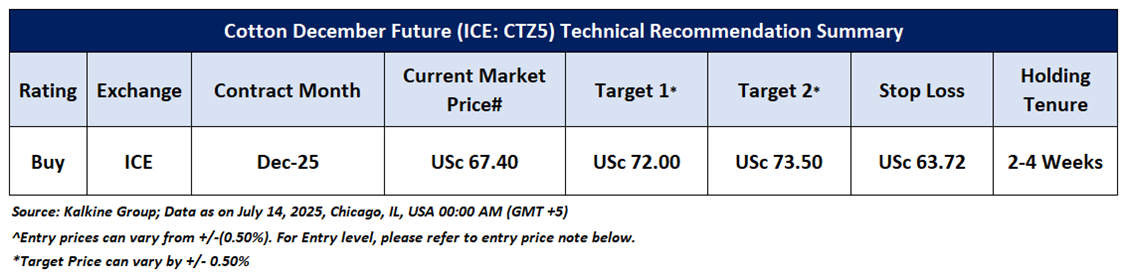
Cotton December Future (ICE: CTZ5)
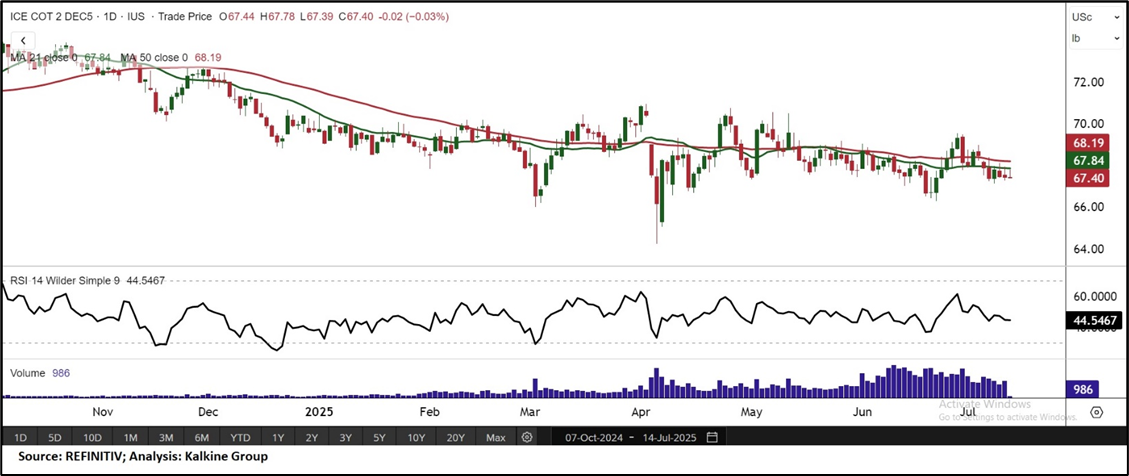
Price Action and Technical Indicator Analysis: December Cotton futures are showing early signs of a potential reversal, trading above a key horizontal trendline with a bullish candlestick pattern indicating renewed buying interest. While the 50-period Simple Moving Average remains overhead as near-term resistance, a successful breakout above this level could strengthen bullish momentum. The Relative Strength Index at 44.54 reflects neutral-to-positive sentiment, with emerging signs of bullish divergence supporting the case for recovery. However, early signs of strength suggest growing buyer interest, and holding above the support zone may reinforce bullish sentiment. A decisive move above the immediate resistance could confirm a trend reversal and open the door for further upside in the sessions ahead.
Now the next crucial resistance levels appear to be at USc 72.00 and USc 73.50, and prices may test these levels in the coming periods (2-4 weeks).
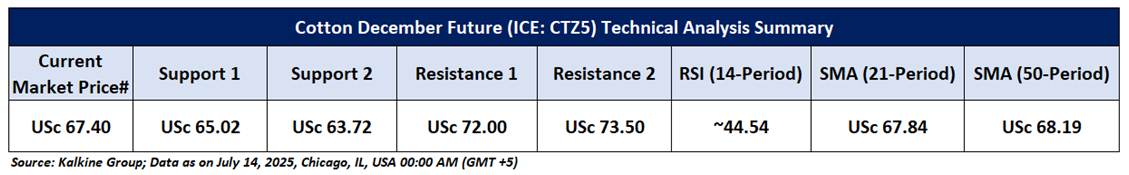
As per the above-mentioned price action and technical indicators analysis, Cotton December Future (ICE: CTZ5) is looking technically well-placed for a ‘Buy’ rating. Investment decisions should be made depending on an individual’s appetite for downside potential, risks, and any previous holdings. This recommendation is purely based on technical analysis, and fundamental analysis has not been considered in this report. Technical summary of the ‘Buy’ recommendation is as follows:
Upcoming Major Global Economic Events
Market events occur on a day-to-day basis depending on the frequency of the data and generally include an update on employment, inflation, GDP, WASDE report, consumer sentiments, etc. Noted below are the upcoming week's major global economic events that could impact commodities’ prices:
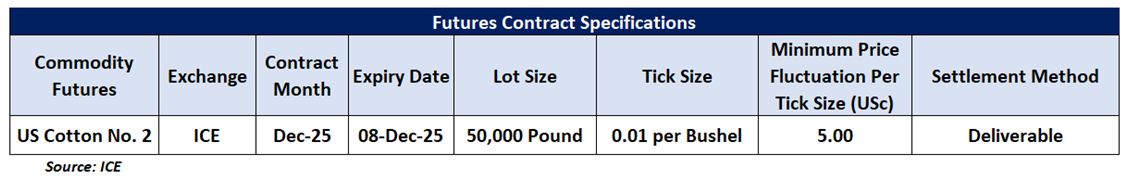
Futures Contract Specifications
Disclaimers
Related Risks: Based on the technical analysis, the risks are defined as per risk-reward ratio (~0.80:1.00), however, returns are generated within a 2-4 weeks’ time frame. This may be looked at by Individuals with sufficient risk appetite looking for returns within short investment duration. The investment recommendations provided in this report are solely based on technical parameters, and the fundamental performance of the commodities has not been considered in the decision-making process. Other factors which could impact commodity prices include market risks, regulatory risks, interest rates risk, currency risks, and social and political instability risks etc.
Note 1: Past performance is not a reliable indicator of future performance.
Note 2: Individuals can consider exiting from the commodity if the Target Price mentioned as per the Technical Analysis has been achieved and subject to the factors discussed above.
Note 3: How to Read the Charts?
The Green colour line reflects the 21-period moving average while the red line indicates the 50- period moving average. SMA helps to identify existing price trend. If the prices are trading above the 21-period and 50-period moving average, then it shows prices are currently trading in a bullish trend.
The Black colour line in the chart’s lower segment reflects the Relative Strength Index (14-Period) which indicates price momentum and signals momentum in trend. A reading of 70 or above suggests overbought status while a reading of 30 or below suggests an oversold status.
The Blue colour bars in the chart’s lower segment show the volume of the commodity. Commodity with high volumes is more liquid compared to the lesser ones. Liquidity in commodity helps in easier and faster execution of the order.
The Orange colour lines are the trend lines drawn by connecting two or more price points and used for trend identification purposes. The trend line also acts as a line of support and resistance.
Technical Indicators Defined: -
Support: A level at which the stock prices tend to find support if they are falling, and a downtrend may take a pause backed by demand or Selling interest. Support 1 refers to the nearby support level for the stock and if the price breaches the level, then Support 2 may act as the crucial support level for the stock.
Resistance: A level at which the stock prices tend to find resistance when they are rising, and an uptrend may take a pause due to profit booking or Selling interest. Resistance 1 refers to the nearby resistance level for the stock and if the price surpasses the level, then Resistance 2 may act as the crucial resistance level for the stock.
Stop-loss: It is a level to protect further losses in case of unfavourable movement in the stock prices.
Risk Reward Ratio: The risk reward ratio is the difference between an entry point to a stop loss and profit level. This report is based on ~80% Stop Loss of the Target 1 from the entry point.
The reference date for all price data, volumes, technical indicators, support, and resistance levels is 14th July 2025. The reference data in this report has been partly sourced from REFINITIV.
Note: Trading decisions require a thorough analysis by individuals. Technical reports, in general, chart out metrics that may be assessed by individuals before any commodity evaluation. The above are illustrative analytical factors used for evaluating the commodity; other parameters can be looked at along with additional risks per side.
Disclaimer-
This report has been issued by Kalkine Limited (Company number 07903332), a private limited company, incorporated in England and Wales ("Kalkine”). Kalkine.co.uk and associated pages are published by Kalkine. Kalkine is authorised and regulated by the Financial Conduct Authority under reference number 579414.
The information in this report and on the Kalkine website has been prepared from a wide variety of sources, which Kalkine, to the best of its knowledge and belief, considers accurate. Kalkine has made every effort to ensure the reliability of information contained in its reports, newsletters and websites. All information represents our views at the date of publication and may change without notice. The information in this report does not constitute an offer to sell securities or other financial products or a solicitation of an offer to buy securities or other financial products. Our reports contain non personalized recommendations to invest in securities and other financial products.
Kalkine does not offer financial advice based upon your personal financial situation or goals, and we shall not be held liable for any investment or trading losses you may incur by using the opinions expressed in our reports, publications, market updates, news alerts and corporate profiles. Kalkine does not intend to exclude any liability which it is not permitted to exclude under applicable law or regulation. Kalkine’s non-personalised advice does not in any way endorse or recommend individuals, investment products or services for your personal financial situation. You should discuss your portfolios and the risk tolerance level appropriate for your personal financial situation, with a professional authorised financial planner and adviser. You should be aware that the value of any investment and the income from it can go down as well as up and you may not get back the amount invested.
Please also read our Terms & Conditions for further information. Employees and/or associates of Kalkine and its related entities may hold interests in the securities or other financial products covered in this report or on the Kalkine website. Any such employees and associates are required to comply with certain safeguards, procedures and disclosures as required by law.
Kalkine Media Limited, an affiliate of Kalkine, may have received, or be entitled to receive, financial consideration in connection with providing information about certain entity(s) covered on its website including entities covered in this report.
Past performance is not a reliable indicator of future performance.
 Please wait processing your request...