Global Commodity Market Wrap-Up
The metals market ended last week on a mixed note, weighed by lingering concerns over a potential U.S. government shutdown, even as trade tensions with China appeared to ease. Gold advanced 5.32%, while silver gained 6.05%. Industrial metals displayed varied movement, with copper up 0.85%, lead down 2.78%, and zinc lower by 2.46%. The overall tone reflected cautious optimism, as investors awaited key economic data that could shape near-term market direction and volatility.
Natural gas declined 1.37% last week, weighed down by abundant supply and muted seasonal demand. Crude oil fell 2.72%, influenced by OPEC’s production outlook and persistent trade-related uncertainties. U.S. sugar also slipped 3.73%, while other agricultural commodities remained under pressure. The week’s performance highlights the continuing influence of supply-demand imbalances and global macroeconomic factors, with upcoming economic events and potential interest rate decisions likely to shape near-term commodity price direction.
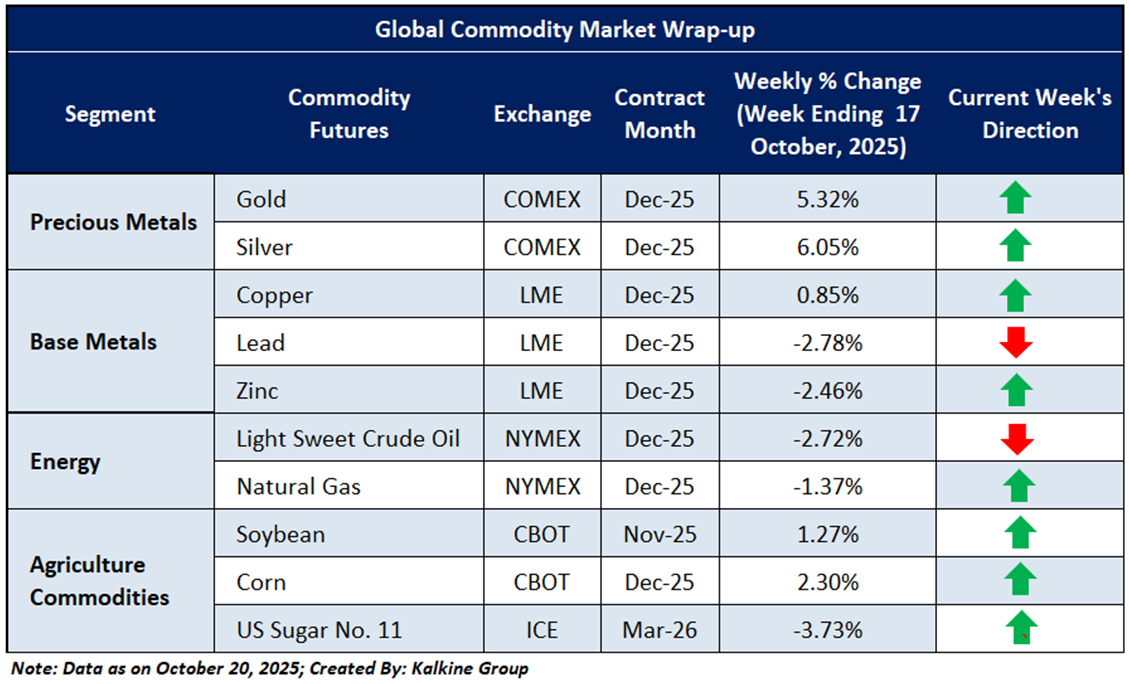
Global commodities ended last week on a mixed note, influenced by concerns over a potential U.S. government shutdown. Precious metals remained near recent highs, while crude oil eased amid trade tensions and OPEC’s production stance. Natural gas rose on tighter supply, and copper gained on signs of renewed industrial demand. Agricultural commodities remain largely steady, supported by stable demand and favorable weather. Market focus now turns to upcoming economic data and policy developments, which are expected to influence near-term commodity price movements and overall market sentiment.
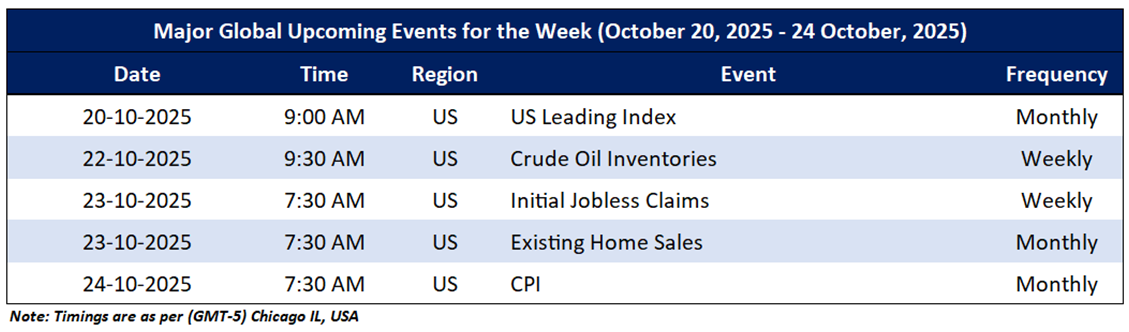
The upcoming Micro and Macroeconomic events that may impact on market sentiments include an update US Leading Index, Crude Oil Inventories, Initial Jobless Claims, Existing Home Sales and CPI.
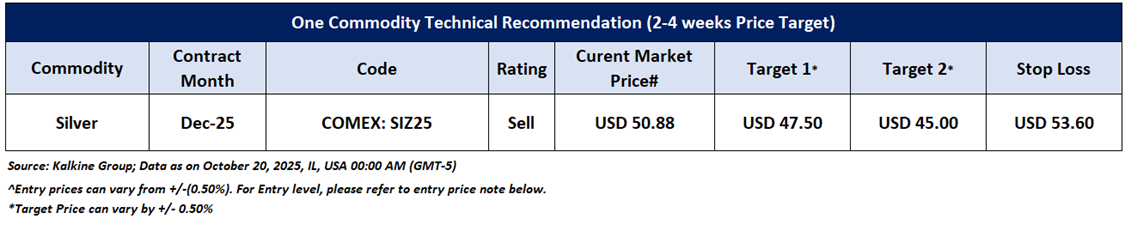
Having understood the global commodities’ performance over the past week, taking cues from major global economic events, and based on technical analysis, noted below is the recommendation with generic insights, entry price, target prices, and stop-loss Silver December Future (COMEX: SIZ25) for the next 2-4-week duration:
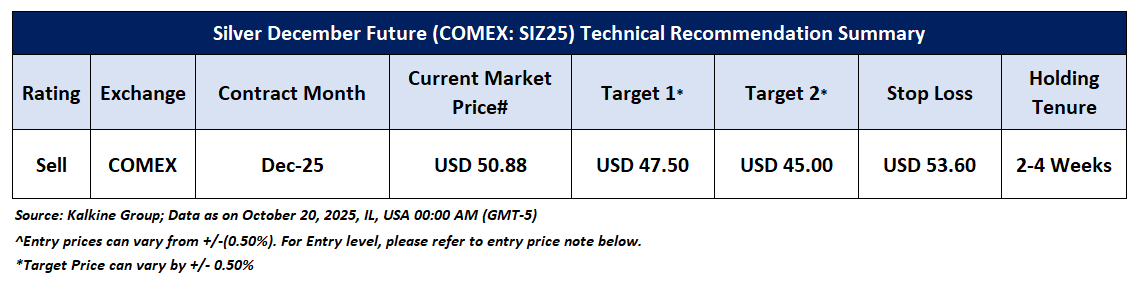
Silver December Future (COMEX: SIZ25)
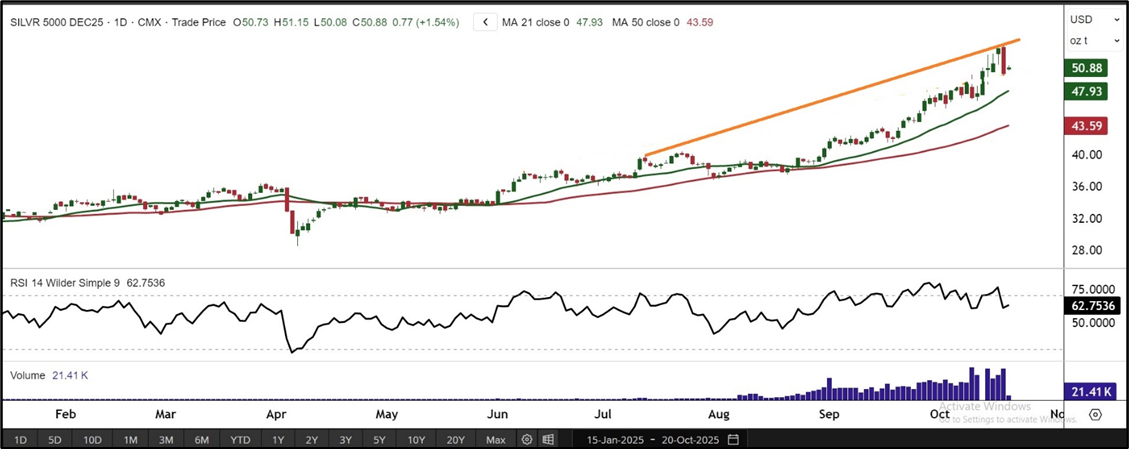
Price Action and Technical Indicator Analysis: December Silver futures are testing resistance and showing signs of weakness, trading just below a key horizontal trendline, while both the 21-period and 50-period SMAs remain below, providing near-term support. Recent bearish candlesticks and an RSI at 62.75, slipping from the overbought zone, indicate waning momentum. As long as prices remain capped at the resistance level, the outlook remains in a corrective phase, with any sustained move above this level needed to resume upward momentum, supported by broader market sentiment and continued investor interest in precious metals.
Now the next crucial support levels appear to be at USD 47.50 and USD 45.00, and prices may test these levels in the coming periods (2-4 weeks).
Source: REFINITIV; Analysis: Kalkine Group
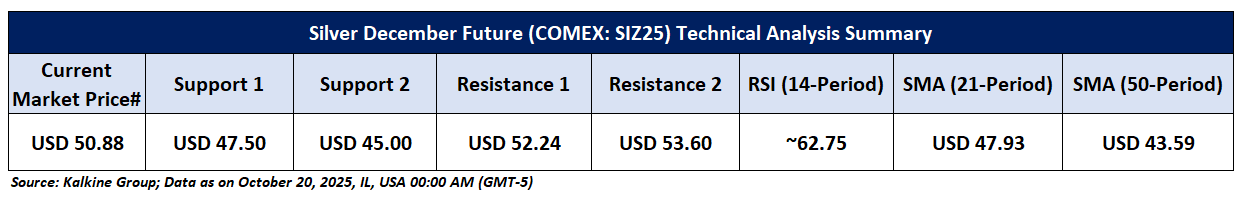
As per the above-mentioned price action and technical indicators analysis, Silver December Future (COMEX: SIZ25) is looking technically well-placed for a ‘Sell’ rating. Investment decisions should be made depending on an individual’s appetite for downside potential, risks, and any previous holdings. This recommendation is purely based on technical analysis, and fundamental analysis has not been considered in this report. Technical summary of the ‘Sell’ recommendation is as follows:
Upcoming Major Global Economic Events
Market events occur on a day-to-day basis depending on the frequency of the data and generally include an update on employment, inflation, GDP, WASDE report, consumer sentiments, etc. Noted below are the upcoming week's major global economic events that could impact commodities’ prices:
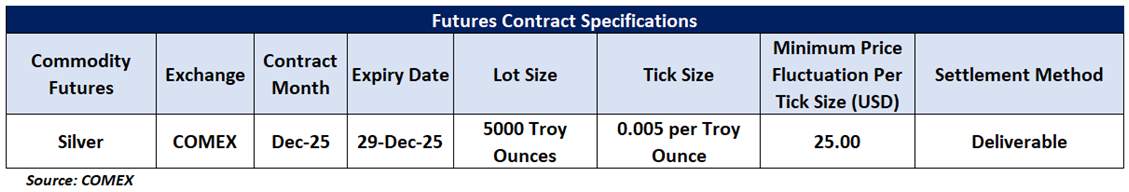
Futures Contract Specifications
Disclaimers
Related Risks: Based on the technical analysis, the risks are defined as per risk-reward ratio (~0.80:1.00), however, returns are generated within a 2-4 weeks’ time frame. This may be looked at by Individuals with sufficient risk appetite looking for returns within short investment duration. The investment recommendations provided in this report are solely based on technical parameters, and the fundamental performance of the commodities has not been considered in the decision-making process. Other factors which could impact commodity prices include market risks, regulatory risks, interest rates risk, currency risks, and social and political instability risks etc.
Note 1: Past performance is not a reliable indicator of future performance.
Note 2: Individuals can consider exiting from the commodity if the Target Price mentioned as per the Technical Analysis has been achieved and subject to the factors discussed above.
Note 3: How to Read the Charts?
The Green colour line reflects the 21-period moving average while the red line indicates the 50- period moving average. SMA helps to identify existing price trend. If the prices are trading above the 21-period and 50-period moving average, then it shows prices are currently trading in a bullish trend.
The Black colour line in the chart’s lower segment reflects the Relative Strength Index (14-Period) which indicates price momentum and signals momentum in trend. A reading of 70 or above suggests overbought status while a reading of 30 or below suggests an oversold status.
The Blue colour bars in the chart’s lower segment show the volume of the commodity. Commodity with high volumes is more liquid compared to the lesser ones. Liquidity in commodity helps in easier and faster execution of the order.
The Orange colour lines are the trend lines drawn by connecting two or more price points and used for trend identification purposes. The trend line also acts as a line of support and resistance.
Technical Indicators Defined: -
Support: A level at which the stock prices tend to find support if they are falling, and a downtrend may take a pause backed by demand or Selling interest. Support 1 refers to the nearby support level for the stock and if the price breaches the level, then Support 2 may act as the crucial support level for the stock.
Resistance: A level at which the stock prices tend to find resistance when they are rising, and an uptrend may take a pause due to profit booking or Selling interest. Resistance 1 refers to the nearby resistance level for the stock and if the price surpasses the level, then Resistance 2 may act as the crucial resistance level for the stock.
Stop-loss: It is a level to protect further losses in case of unfavourable movement in the stock prices.
Risk Reward Ratio: The risk reward ratio is the difference between an entry point to a stop loss and profit level. This report is based on ~80% Stop Loss of the Target 1 from the entry point.
The reference date for all price data, volumes, technical indicators, support, and resistance levels is 20th October 2025. The reference data in this report has been partly sourced from REFINITIV.
Note: Trading decisions require a thorough analysis by individuals. Technical reports, in general, chart out metrics that may be assessed by individuals before any commodity evaluation. The above are illustrative analytical factors used for evaluating the commodity; other parameters can be looked at along with additional risks per side.
Disclaimer-
This report has been issued by Kalkine Limited (Company number 07903332), a private limited company, incorporated in England and Wales ("Kalkine”). Kalkine.co.uk and associated pages are published by Kalkine. Kalkine is authorised and regulated by the Financial Conduct Authority under reference number 579414.
The information in this report and on the Kalkine website has been prepared from a wide variety of sources, which Kalkine, to the best of its knowledge and belief, considers accurate. Kalkine has made every effort to ensure the reliability of information contained in its reports, newsletters and websites. All information represents our views at the date of publication and may change without notice. The information in this report does not constitute an offer to sell securities or other financial products or a solicitation of an offer to buy securities or other financial products. Our reports contain non personalized recommendations to invest in securities and other financial products.
Kalkine does not offer financial advice based upon your personal financial situation or goals, and we shall not be held liable for any investment or trading losses you may incur by using the opinions expressed in our reports, publications, market updates, news alerts and corporate profiles. Kalkine does not intend to exclude any liability which it is not permitted to exclude under applicable law or regulation. Kalkine’s non-personalised advice does not in any way endorse or recommend individuals, investment products or services for your personal financial situation. You should discuss your portfolios and the risk tolerance level appropriate for your personal financial situation, with a professional authorised financial planner and adviser. You should be aware that the value of any investment and the income from it can go down as well as up and you may not get back the amount invested.
Please also read our Terms & Conditions for further information. Employees and/or associates of Kalkine and its related entities may hold interests in the securities or other financial products covered in this report or on the Kalkine website. Any such employees and associates are required to comply with certain safeguards, procedures and disclosures as required by law.
Kalkine Media Limited, an affiliate of Kalkine, may have received, or be entitled to receive, financial consideration in connection with providing information about certain entity(s) covered on its website including entities covered in this report.
Past performance is not a reliable indicator of future performance.
 Please wait processing your request...