Section 1: Company Overview and Fundamentals
1.1 Company Overview:
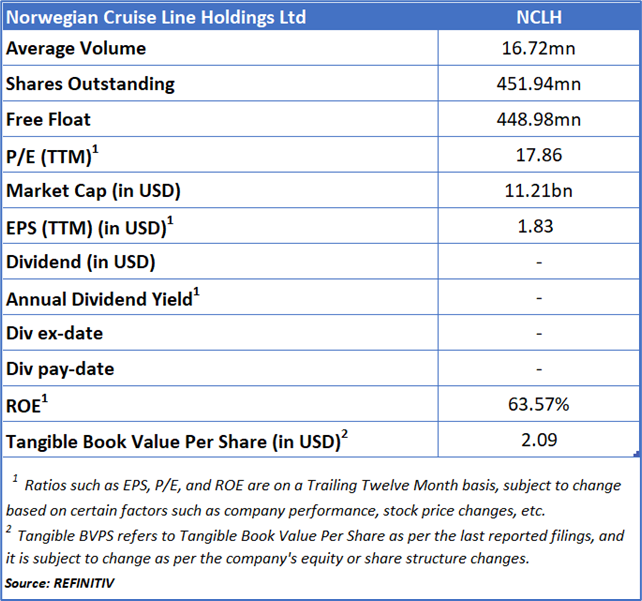
Norwegian Cruise Line Holdings Ltd (NYSE: NCLH) is an international cruise operator managing three brands: Norwegian Cruise Line, Oceania Cruises, and Regent Seven Seas Cruises. Together, the company operates a fleet of 32 ships with more than 66,500 berths, providing cruise itineraries to over 700 destinations around the globe.
Kalkine’s Diversified Opportunities Report covers the Company Overview, Key positives & negatives, Investment summary, Key investment metrics, Top 10 shareholding, Business updates and insights into company recent financial results, Key Risks & Outlook, Price performance and technical summary, Target Price, and Recommendation on the stock.
Stock Performance:
- The stock has reversed from a downtrend (January to April 2025) and is now in a clear uptrend, evidenced by higher highs and higher lows since May 2025.
- 21-day moving average is currently at USD 23.85, acting as immediate support. 50-day moving average is at USD 21.24, indicating a broader bullish trend. The bullish crossover (21-day MA above 50-day MA) occurred in early June 2025, confirming a shift in momentum. Price remains well above both moving averages, reinforcing bullish sentiment.
- RSI (14) stands at 59.83, showing strong but not overbought momentum. The RSI has cooled slightly from the overbought zone (>70), suggesting a potential minor consolidation or pullback before any further upside.
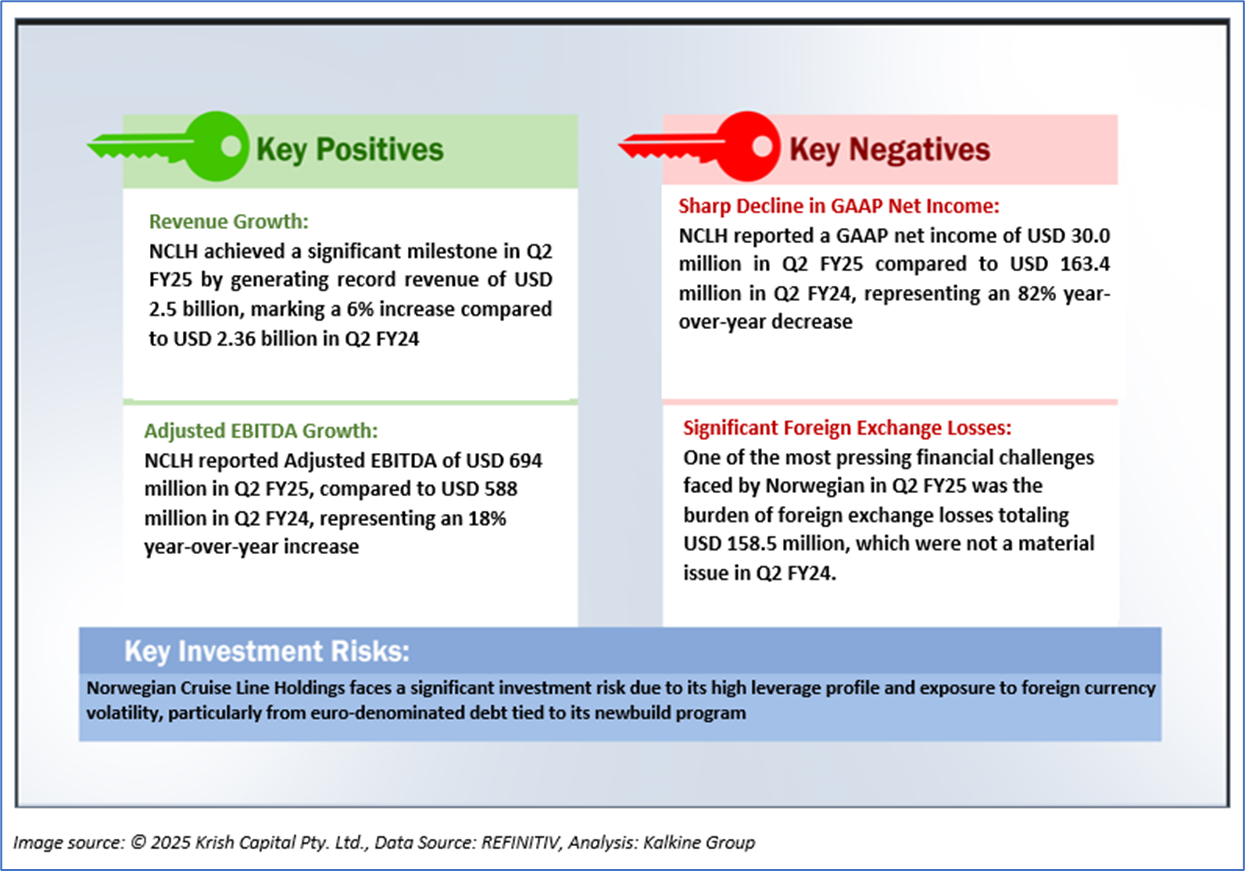
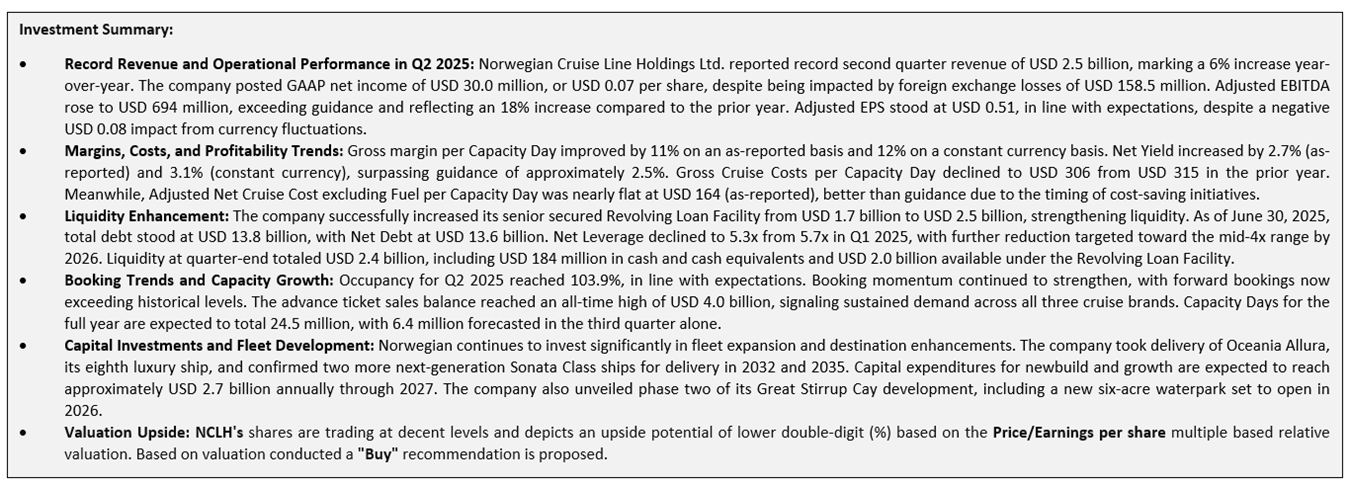
1.2 The Key Positives, Negatives, and Investment summary
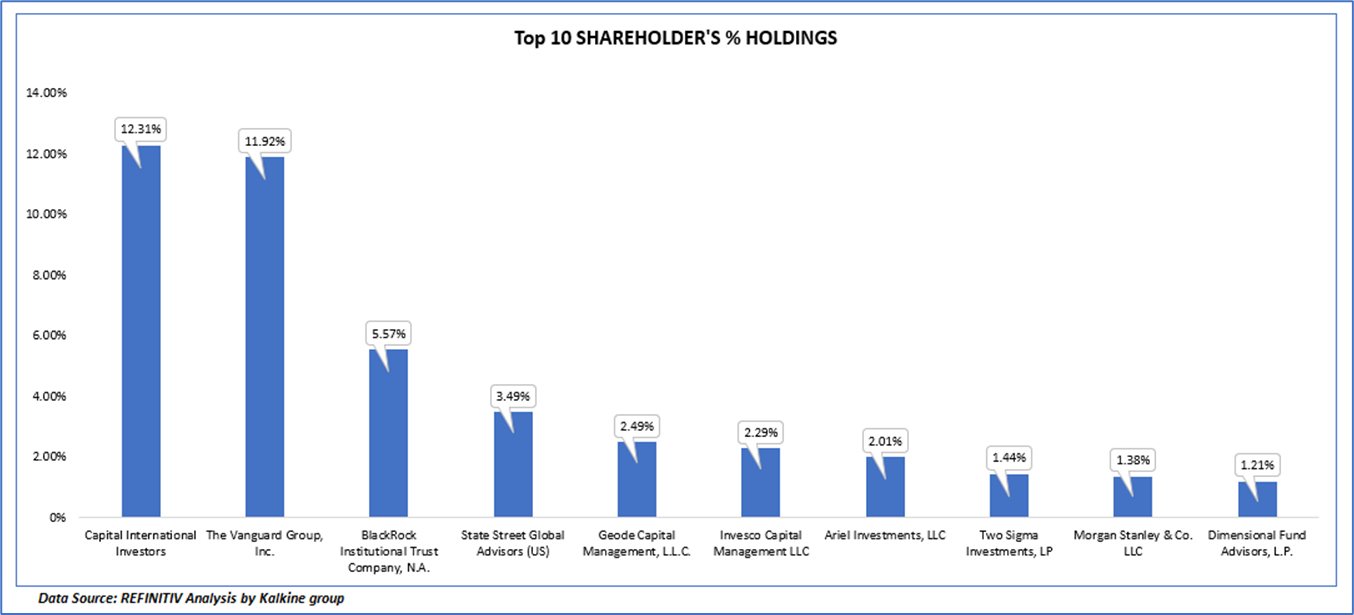
1.3 Top 10 shareholders:
The top 10 shareholders together form ~ 44.10% of the total shareholding, signifying concentrated shareholding. Capital International Investors and The Vanguard Group, Inc. are the biggest shareholders, holding the maximum stake in the company at 12.31% and 11.92%, respectively.
1.4 Key Metrics:
During the period from Q2 FY24 to Q2 FY25, revenue and gross margin fluctuated due to seasonal demand patterns, occupancy rates, and pricing strength. Revenue peaked in Q3 FY24 on the back of robust consumer demand and high onboard spending, driving gross margin to 45.16%. However, revenue and margins declined in Q4 FY24 due to seasonality and lower capacity utilization. While revenue gradually improved in Q1 and Q2 FY25, gross margin also recovered to 42.13% by Q2 FY25, supported by cost efficiencies and strong advance bookings. Net income, however, was volatile, peaking in Q3 FY24 and turning negative in Q1 FY25 due to significant foreign exchange losses and higher depreciation. Despite revenue and margin recovery in Q2 FY25, net income remained low, reflecting ongoing FX headwinds and elevated interest expenses.

Section 2: Business Updates and Corporate Business Highlights
2.1 Recent Business Updates

2.2 Insights of Q2FY25:

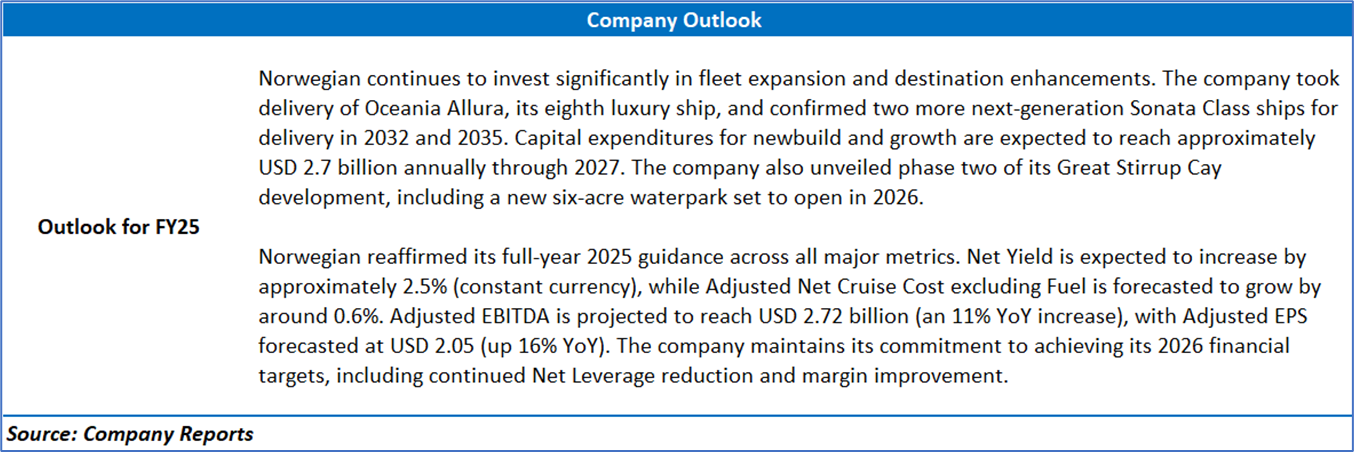
Section 3: Key Risks & Outlook

Section 4: Stock Recommendation Summary:
4.1 Price Performance and Technical Summary:
Stock Performance:
- The stock has reversed from a downtrend (January to April 2025) and is now in a clear uptrend, evidenced by higher highs and higher lows since May 2025.
- 21-day moving average is currently at USD 23.85, acting as immediate support. 50-day moving average is at USD 21.24, indicating a broader bullish trend. The bullish crossover (21-day MA above 50-day MA) occurred in early June 2025, confirming a shift in momentum. Price remains well above both moving averages, reinforcing bullish sentiment.
- RSI (14) stands at 59.83, showing strong but not overbought momentum. The RSI has cooled slightly from the overbought zone (>70), suggesting a potential minor consolidation or pullback before any further upside.


4.2 Fundamental Valuation
Valuation Methodology: Price/Earnings per share Multiple Based Relative Valuation


Markets are trading in a highly volatile zone currently due to certain macroeconomic issues and geopolitical tensions prevailing. Therefore, it is prudent to follow a cautious approach while investing.
Note 1: Past performance is not a reliable indicator of future performance.
Note 2: The reference date for all price data, currency, technical indicators, support, and resistance levels is August 07, 2025. The reference data in this report has been partly sourced from REFINITIV.
Note 3: Investment decisions should be made depending on an individual's appetite for upside potential, risks, holding duration, and any previous holdings. An 'Exit' from the stock can be considered if the Target Price mentioned as per the Valuation and or the technical levels provided has been achieved and is subject to the factors discussed above.
Note 4: The report publishing date is as per the Pacific Time Zone.
Technical Indicators Defined: -
Support: A level at which the stock prices tend to find support if they are falling, and a downtrend may take a pause backed by demand or buying interest. Support 1 refers to the nearby support level for the stock and if the price breaches the level, then Support 2 may act as the crucial support level for the stock.
Resistance: A level at which the stock prices tend to find resistance when they are rising, and an uptrend may take a pause due to profit booking or selling interest. Resistance 1 refers to the nearby resistance level for the stock and if the price surpasses the level, then Resistance 2 may act as the crucial resistance level for the stock.
Stop-loss: It is a level to protect against further losses in case of unfavorable movement in the stock prices.
Disclaimer-
This report has been issued by Kalkine Limited (Company number 07903332), a private limited company, incorporated in England and Wales ("Kalkine”). Kalkine.co.uk and associated pages are published by Kalkine. Kalkine is authorised and regulated by the Financial Conduct Authority under reference number 579414.
The information in this report and on the Kalkine website has been prepared from a wide variety of sources, which Kalkine, to the best of its knowledge and belief, considers accurate. Kalkine has made every effort to ensure the reliability of information contained in its reports, newsletters and websites. All information represents our views at the date of publication and may change without notice. The information in this report does not constitute an offer to sell securities or other financial products or a solicitation of an offer to buy securities or other financial products. Our reports contain non personalized recommendations to invest in securities and other financial products.
Kalkine does not offer financial advice based upon your personal financial situation or goals, and we shall not be held liable for any investment or trading losses you may incur by using the opinions expressed in our reports, publications, market updates, news alerts and corporate profiles. Kalkine does not intend to exclude any liability which it is not permitted to exclude under applicable law or regulation. Kalkine’s non-personalised advice does not in any way endorse or recommend individuals, investment products or services for your personal financial situation. You should discuss your portfolios and the risk tolerance level appropriate for your personal financial situation, with a professional authorised financial planner and adviser. You should be aware that the value of any investment and the income from it can go down as well as up and you may not get back the amount invested.
Please also read our Terms & Conditions for further information. Employees and/or associates of Kalkine and its related entities may hold interests in the securities or other financial products covered in this report or on the Kalkine website. Any such employees and associates are required to comply with certain safeguards, procedures and disclosures as required by law.
Kalkine Media Limited, an affiliate of Kalkine, may have received, or be entitled to receive, financial consideration in connection with providing information about certain entity(s) covered on its website including entities covered in this report.
Past performance is not a reliable indicator of future performance.

 Please wait processing your request...