Kalkine’s Global Tariff Report provides fully independent analysis and data-driven analysis of major global sectors affected by tariff changes, evaluating the implications these shifts may have on equity valuations across those industries. The report concentrates on trade-sensitive sectors that typically experience heightened investor scrutiny during periods of tariff uncertainty. It also identifies defensive and countercyclical segments that demonstrate relative resilience or may even outperform, amid disruptions to global trade flows.
As illustrated in the table below, several key sectors in different countries are directly impacted by the recent tariff announcement from President Trump.
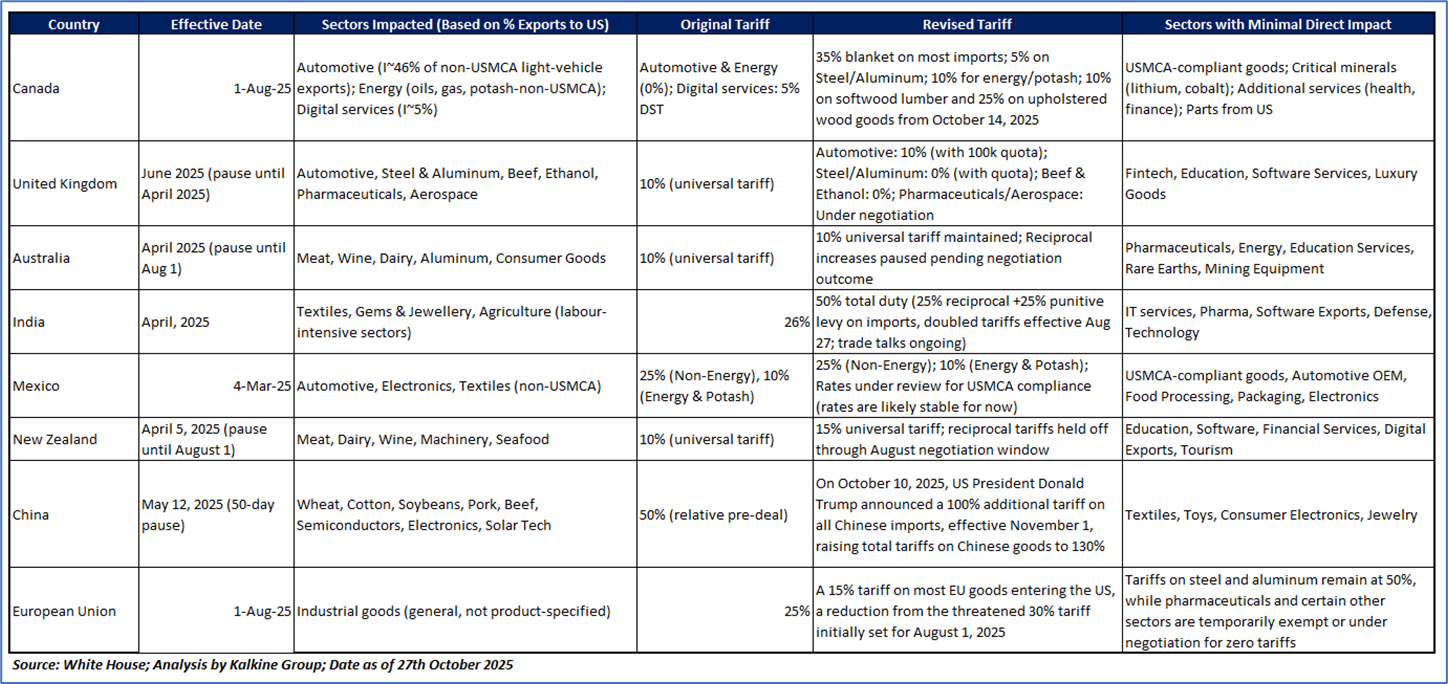
Latest Updates on Global Tariffs by Trump’s Administration
Key Developments (as of 27 October 2025)
Canada
- Tariff Increase: President Trump has imposed new U.S. tariffs on wood products—10% on softwood lumber and 25% on upholstered wood goods from October 14, 2025—rising to 30–50% by January 2026. Canada, the largest lumber supplier, now faces total duties exceeding 35%. Using Section 232 on national security grounds, the U.S. has also applied steep tariffs on metals, autos, energy, and non-CUSMA goods, removed duty exemptions for low-value imports, and introduced penalties for tariff evasion. Additional tariffs on semiconductors, trucks, pharmaceuticals, and films remain under review.
- Canada’s Response: As of September 1, 2025, Canada lifted most counter-tariffs on U.S. goods, removing 25% duties on USD 44.2 billion worth of imports imposed earlier in 2025. However, tariffs on steel, aluminium, and automobiles remain in effect.
India
- Tariff Stalemate: As of October 2025, the US maintains a 50% tariff on key Indian exports such as textiles, gems, and auto parts, while India has kept its tariffs on US goods unchanged.
- Sectorial Impact: The US tariff has led to sharp volatility in Indian markets, with export-oriented sectors like textiles, leather, and gems seeing turnover drop by up to 50%. Auto firms face margin strain from weaker demand, while pharmaceuticals, buoyed by exemptions and rising US orders, gained over 3%. IT and FMCG remain stable, attracting steady investor interest.
- Strategic Pushback: India has adopted a cautious and strategic response to US tariffs, avoiding immediate retaliation but reserving the right to act through the WTO. The government is pursuing trade talks with a fall 2025 deadline while exploring reciprocal measures in sectors like agriculture, automobiles, spirits, and medical equipment. Policy efforts focus on supporting MSMEs, promoting local products, and diversifying export markets to reduce US dependence.
- Economic Impact: US tariffs pose a major risk to India’s USD 434 billion export sector, potentially cutting engineering exports by USD 4–5 billion and lowering GDP growth to around 6%. MSMEs in textiles and leather face tougher competition from Vietnam and Bangladesh, while a weaker rupee heightens inflation and foreign borrowing costs.
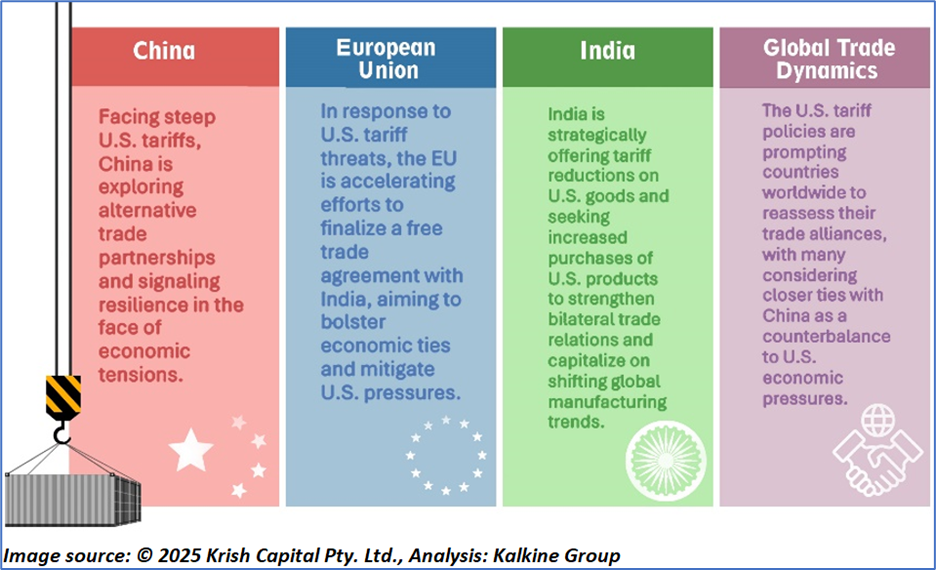
China
- Current Tariff: On October 10, 2025, US President Donald Trump announced a 100% additional tariff on all Chinese imports, effective November 1, raising total tariffs on Chinese goods to 130% — one of the most extreme US trade actions ever. The move follows China’s reported plan to impose broad export controls, which Trump called a “hostile act.” The escalation deepens tensions between Washington and Beijing ahead of the APEC Summit in South Korea, which both Trump and Chinese President Xi Jinping are expected to attend. Despite recent trade talks and discussions over TikTok’s US ownership, Trump said there was “no reason to meet” with Xi given China’s “aggressive” trade stance.
- Impact: Trump’s new 100% tariff on Chinese imports could severely disrupt global supply chains, especially in the technology, electric vehicle, and defense sectors. Economists expect worldwide price hikes due to China’s central role in manufacturing. The policy is already shaking global markets, with U.S. stock indices falling sharply amid fears of broader economic fallout.
- Global Fallout: Mexico, Canada, and key Asian economies such as South Korea, Japan, and Singapore are expected to face major economic repercussions from the new U.S. tariffs on China. Their close trade links with both nations heighten risks of slower growth in manufacturing and technology. Global markets reacted sharply, with U.S. stocks plunging and volatility rising amid fears of a prolonged trade conflict
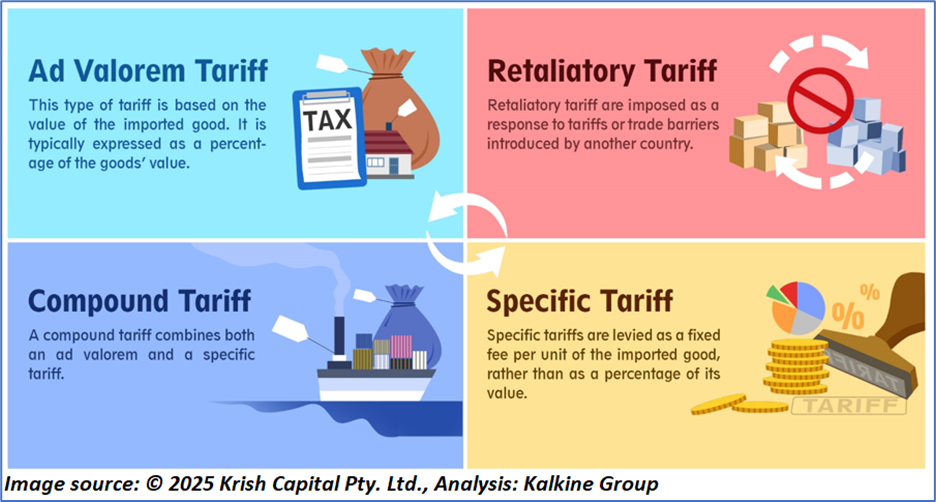
What are the different types of Tariffs?
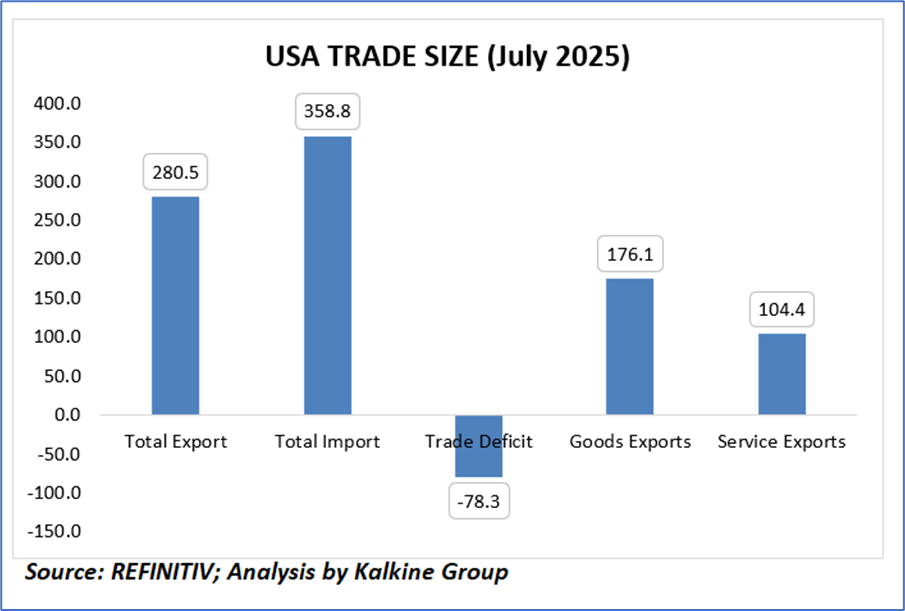
A Snapshot of USA’s Trade Size
The U.S. trade deficit widened significantly to USD 78.3 billion in July 2025, marking the largest gap in four months, compared with a revised USD 59.1 billion in June and exceeding market expectations of USD 75.7 billion. Exports edged up by 0.3% to USD 280.5 billion, supported by higher shipments of nonmonetary gold, computer accessories, civilian aircraft, trucks and buses, as well as increased receipts from intellectual property and government services. However, exports of finished metal shapes and excavating machinery declined. Meanwhile, imports surged 5.9% to USD 358.8 billion, driven by stronger demand for nonmonetary gold, computers, telecom equipment, jewelry, and transport goods, while purchases of pharmaceuticals, semiconductors, vehicles, and special-purpose machinery decreased. The largest trade deficits were with Mexico (USD 16.6 billion), Vietnam (USD 16.1 billion), China (USD 14.7 billion), and Taiwan (USD 13.5 billion), followed by the EU (USD 8.6 billion), India (USD 5.5 billion), and Canada (USD 5.4 billion).
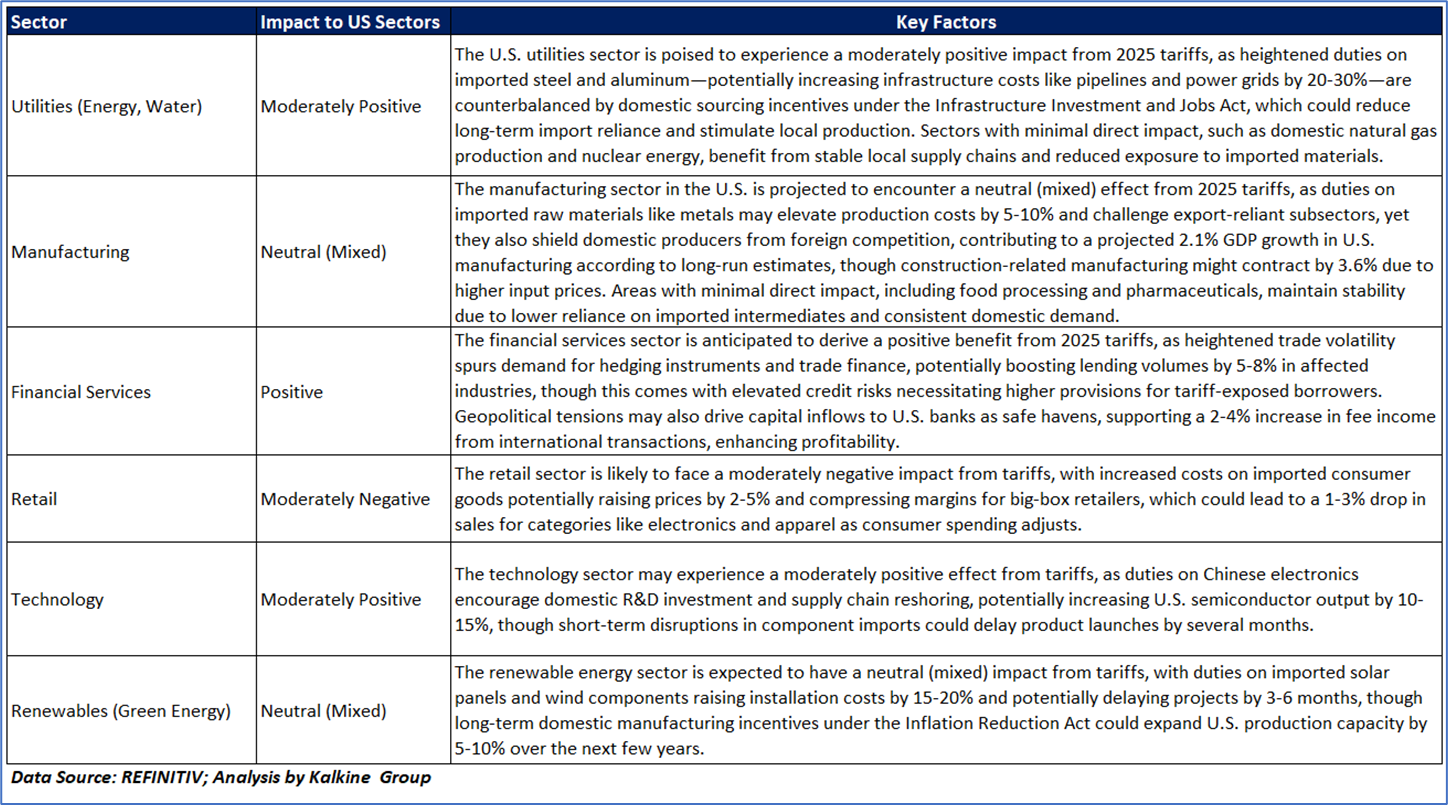
Impact of US Tariffs on Various Sectors
The U.S. economy is currently grappling with significant challenges, including high inflation, supply chain disruptions, and the effects of aggressive monetary policy from the Federal Reserve. Key sectors such as manufacturing, agriculture, and technology are feeling strain, particularly due to their dependence on global supply chains and export markets, with trade policies like tariffs on steel, aluminum, and electronics driving up costs for businesses and consumers alike. Despite these pressures, there’s cautious optimism in some quarters about market stabilization within the next year, though this is tempered by ongoing issues like labor shortages, energy price volatility, and political divisions. The Federal Reserve’s interest rate hikes aimed at curbing inflation—still above target levels—have slowed economic growth, raising recession risks, while strategic efforts such as trade agreements and supply chain diversification remain critical to fostering stability and mitigating prolonged uncertainty across these vital sectors.
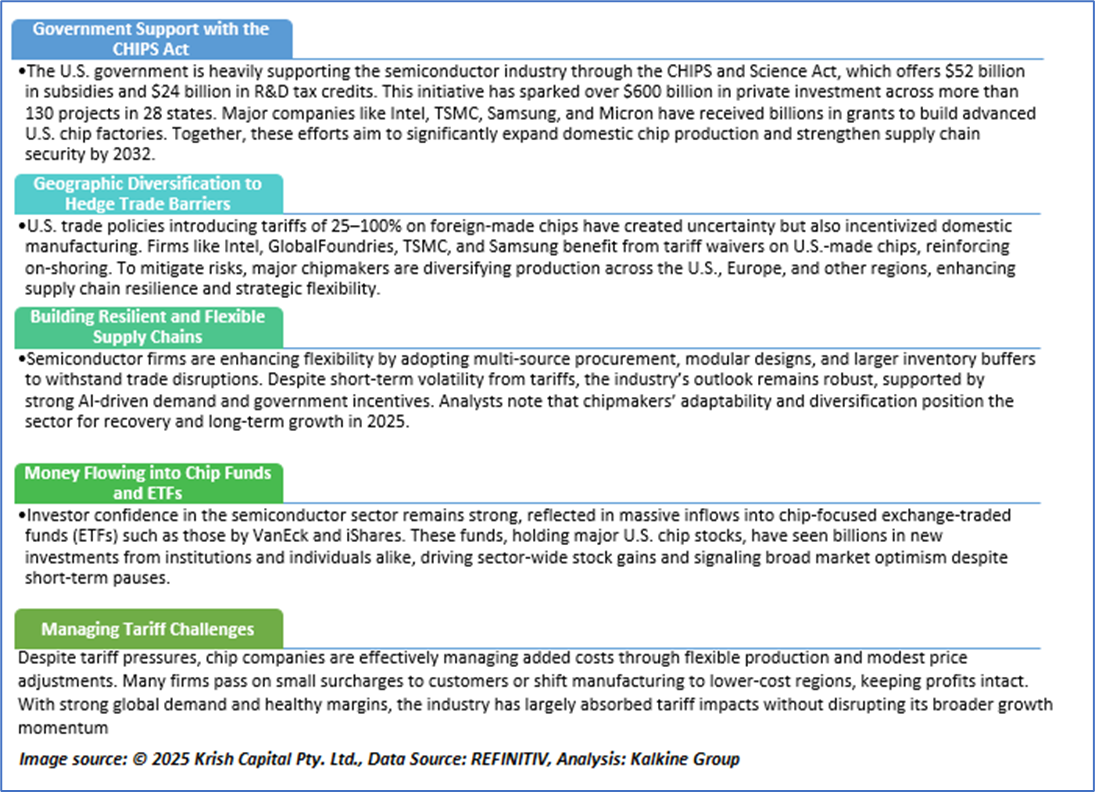
Why does the US Semiconductor Industry look Attractive Amid Tariff Concerns?
Amid elevated Market Volatility and Tariff pressures, ON Semiconductor (Nasdaq: ON) stands out as our defensive pick within the Semiconductors Industry, supported by rigorous fundamental and technical research
Kalkine’s Global Tariff Report covers the Investment Highlights, Key Financial Metrics, Risks, Technical Analysis along with the Valuation, Target Price, and Recommendation on ON Semiconductor (Nasdaq: ON).
Section 1: Company Overview and Fundamental Insights
1.1 Company Overview:
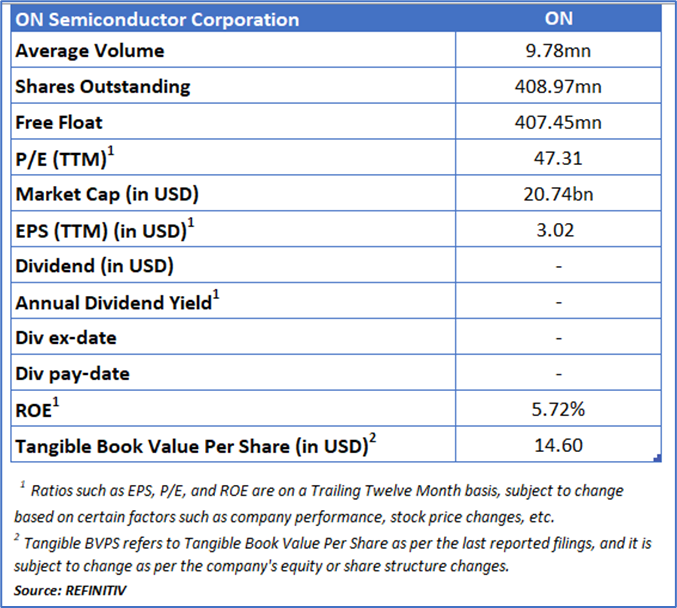
ON Semiconductor Corporation(NASDAQ: ON) is advancing transformative technologies aimed at shaping a more sustainable and connected future. Concentrating on the automotive and industrial sectors, the company is driving progress across major global trends, including vehicle electrification, safety enhancement, renewable energy infrastructure, industrial automation, and next-generation connectivity through 5G and cloud systems. With its distinctive and innovative range of intelligent power and sensing solutions, ON Semiconductor addresses complex global challenges and continues to lead the industry toward a cleaner, safer, and smarter world.
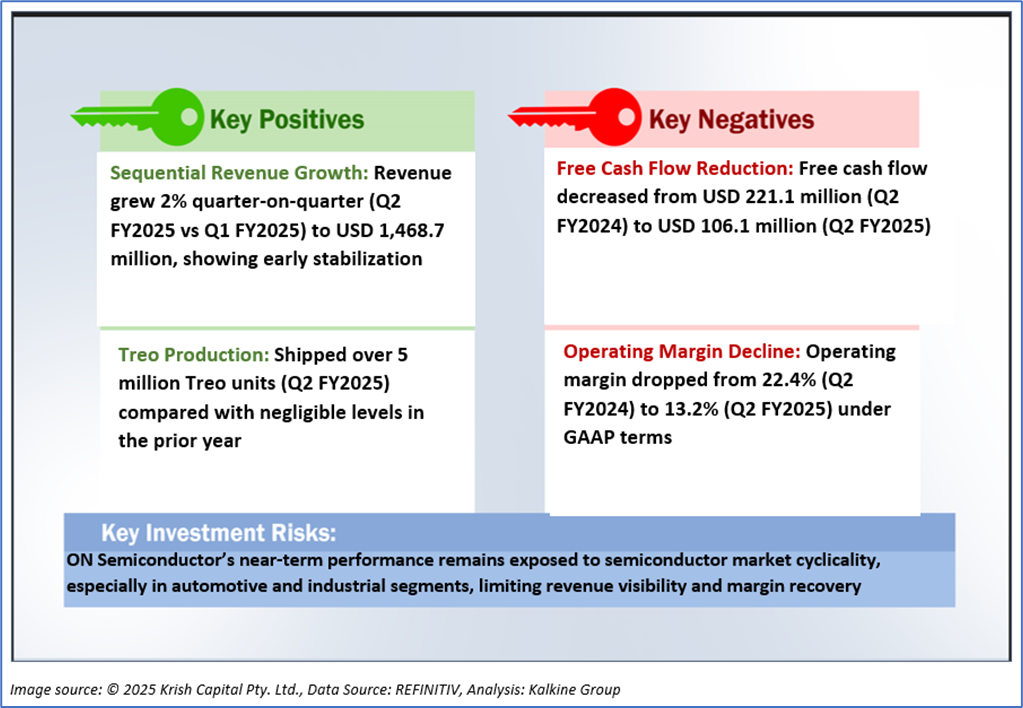
1.2 The Key Positives, Negatives, Investment Highlights and Risks
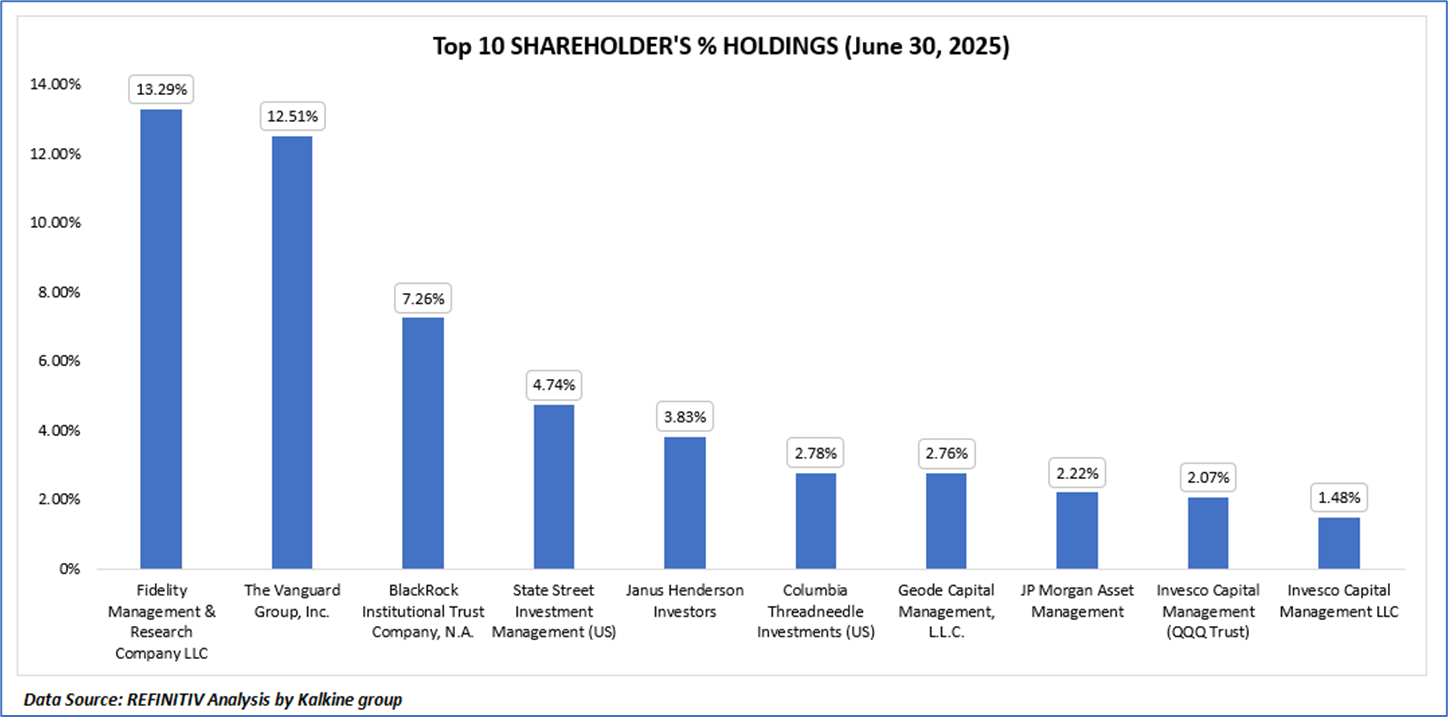
1.3 Top 10 Shareholders:
The top 10 shareholders together form ~52.94% of the total shareholding, indicating concentrated holding. Fidelity Management & Research Company LLC and The Vanguard Group, Inc. hold a maximum stake in the company at ~13.29% and ~12.51%, respectively.
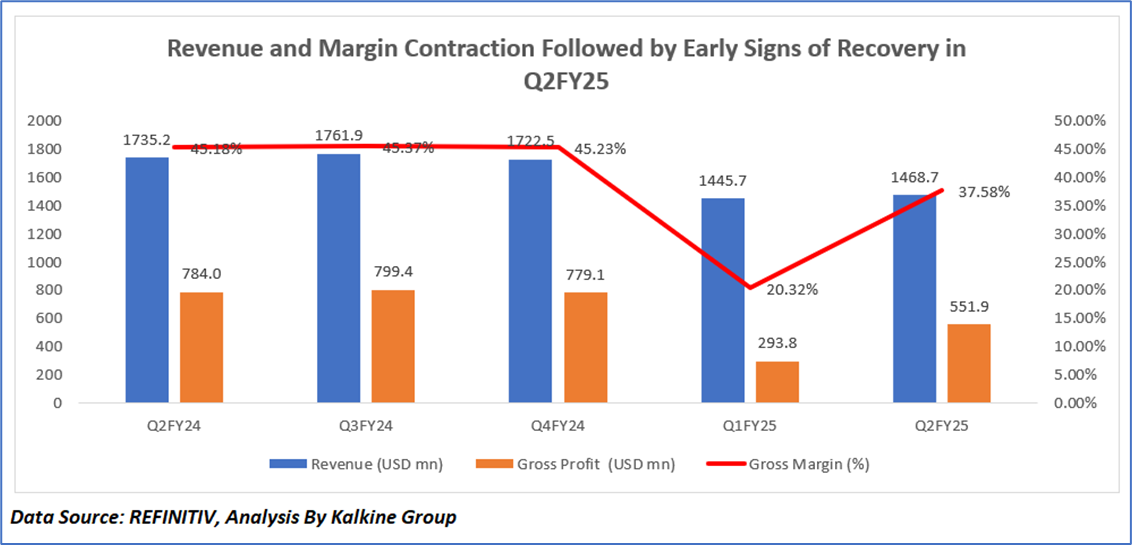
1.4 Key Metrics:
The chart illustrates a clear downward trend in ON Semiconductor’s revenue and gross margin from Q2FY24 to Q2FY25, reflecting the impact of cyclical weakness and restructuring activities, followed by a mild recovery. Revenue declined from USD 1,735.2 million in Q2FY24 to USD 1,468.7 million in Q2FY25, primarily due to lower demand across automotive, industrial, and sensing markets. Correspondingly, gross profit fell from USD 784.0 million to USD 551.9 million, as reduced capacity utilization and pricing pressures eroded margins. The sharp drop in Q1FY25 gross margin to 20.3% was driven by significant restructuring and impairment charges that temporarily distorted profitability. However, a partial recovery in Q2FY25, with the margin improving to 37.6%, reflected stabilization in operations, sequential revenue growth, and higher-value product sales—particularly from the ramp-up of China Silicon Carbide (SiC) programs. Overall, the trend highlights a transition period for ON Semiconductor, where near-term cost pressures and market softness weighed on performance, but restructuring efficiencies and strategic product investments have started to support gradual operational recovery.
Section 2: Business Updates and Financial Highlights
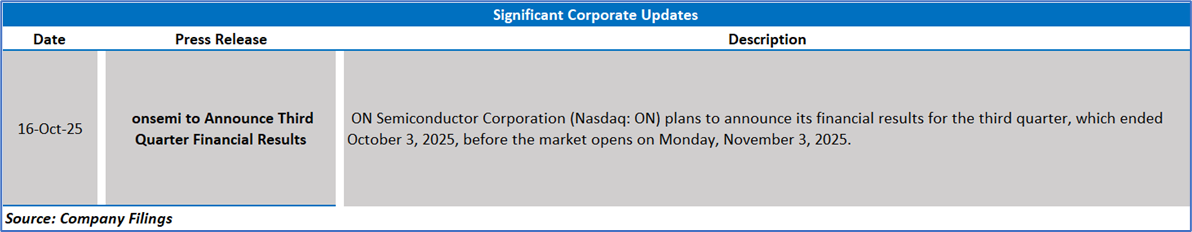
2.1 Recent Updates: The below picture gives an overview of the company’s update on its next reporting date.
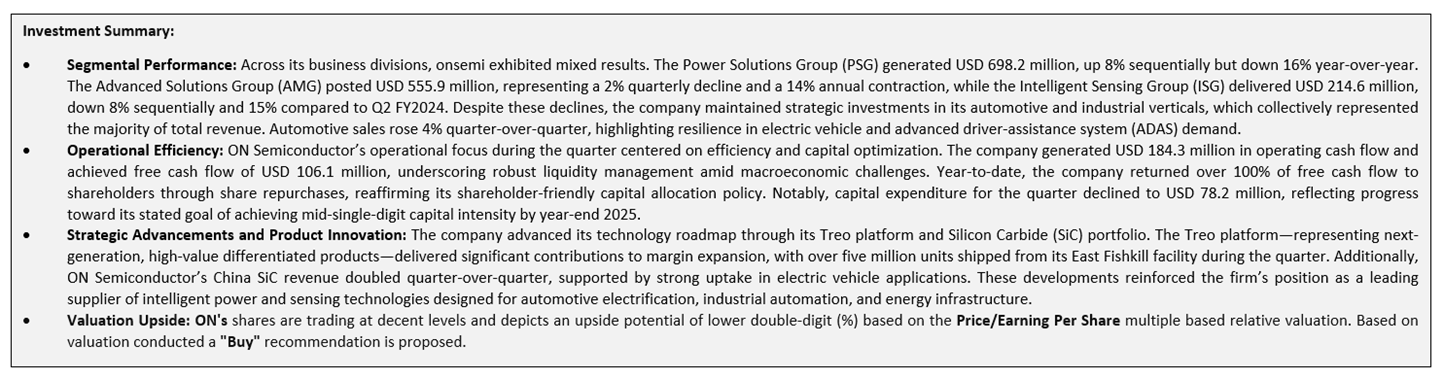
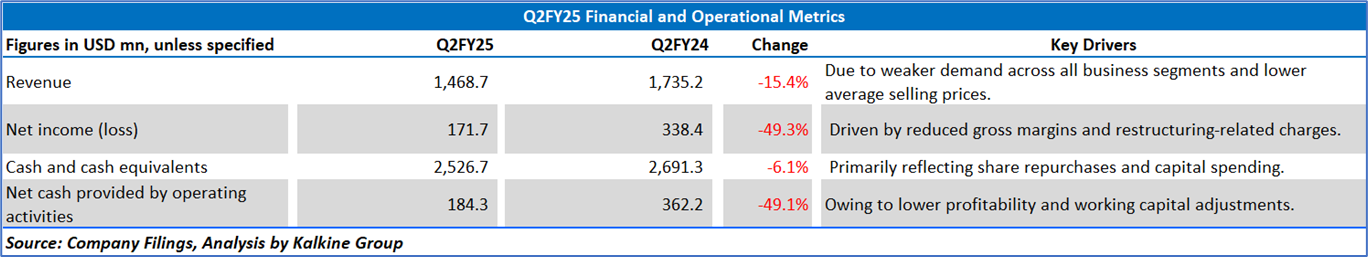
2.2 Insights into Q2FY25 Financial Performance:
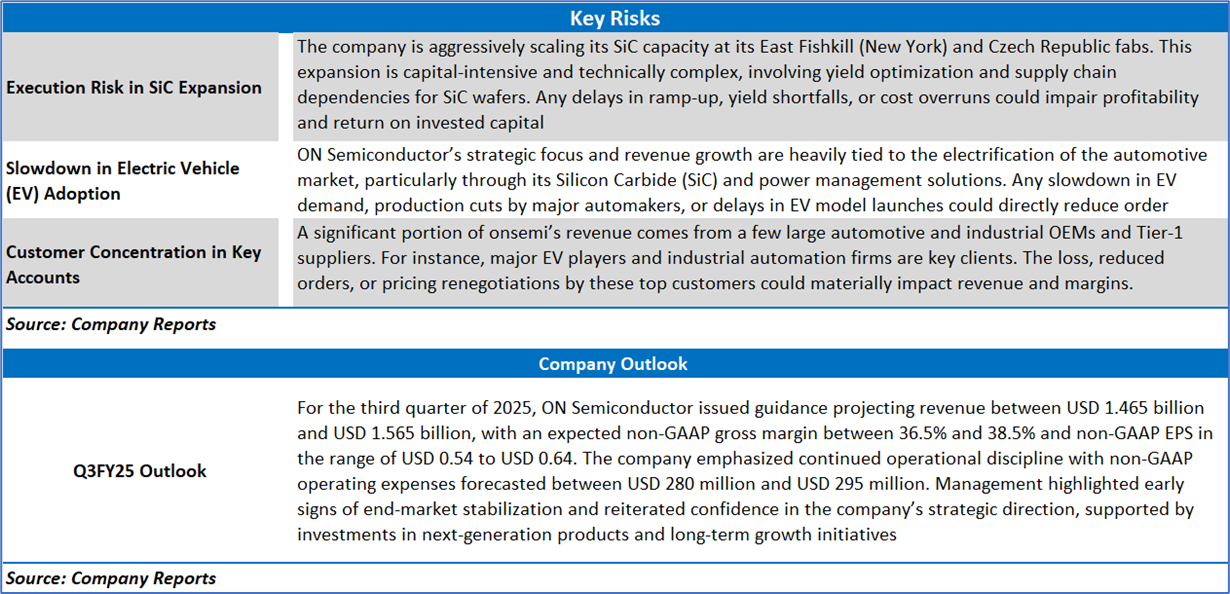
Section 3: Key Risks, Company Outlook:
Section 4: Stock Recommendation Summary:
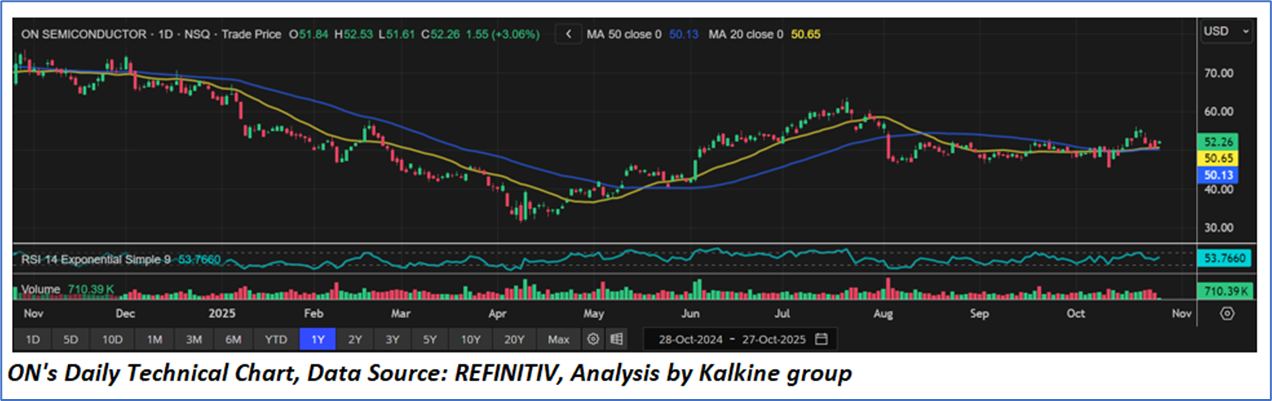
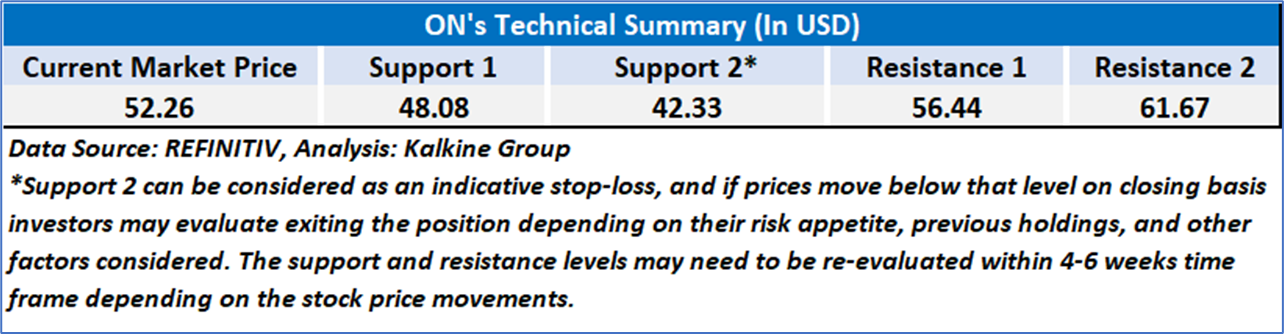
4.1 Price Performance and Technical Summary:
- The stock has been on a downward trajectory from late 2024 through early 2025, bottoming near USD 30 in April 2025. A reversal trend began thereafter, marked by a steady recovery until July, where prices peaked around USD 65. However, post-July, the stock entered a sideways-to-down consolidation, oscillating between USD 45 and USD 55.
- Currently, ON trades at USD 50.71, slightly below its 20-day moving average (USD 50.65) but close to the 50-day moving average (USD 50.13), indicating neutral short-term momentum. The moving averages have recently converged, suggesting a potential inflection zone where a breakout in either direction could define the next trend.
- The RSI at 54 reflects a balanced momentum, neither overbought nor oversold. The trading volume remains moderate, implying that recent movements lack strong conviction.
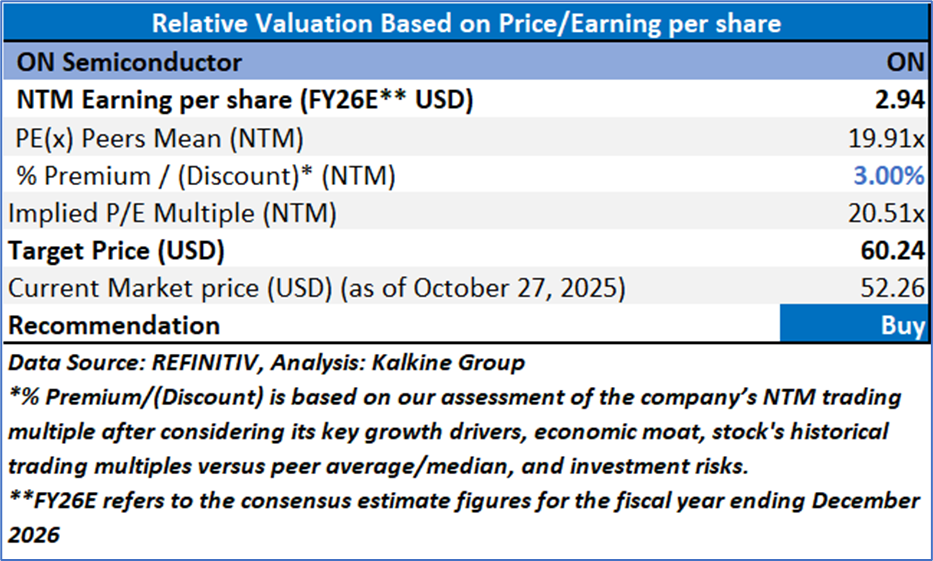
4.2 Fundamental Valuation
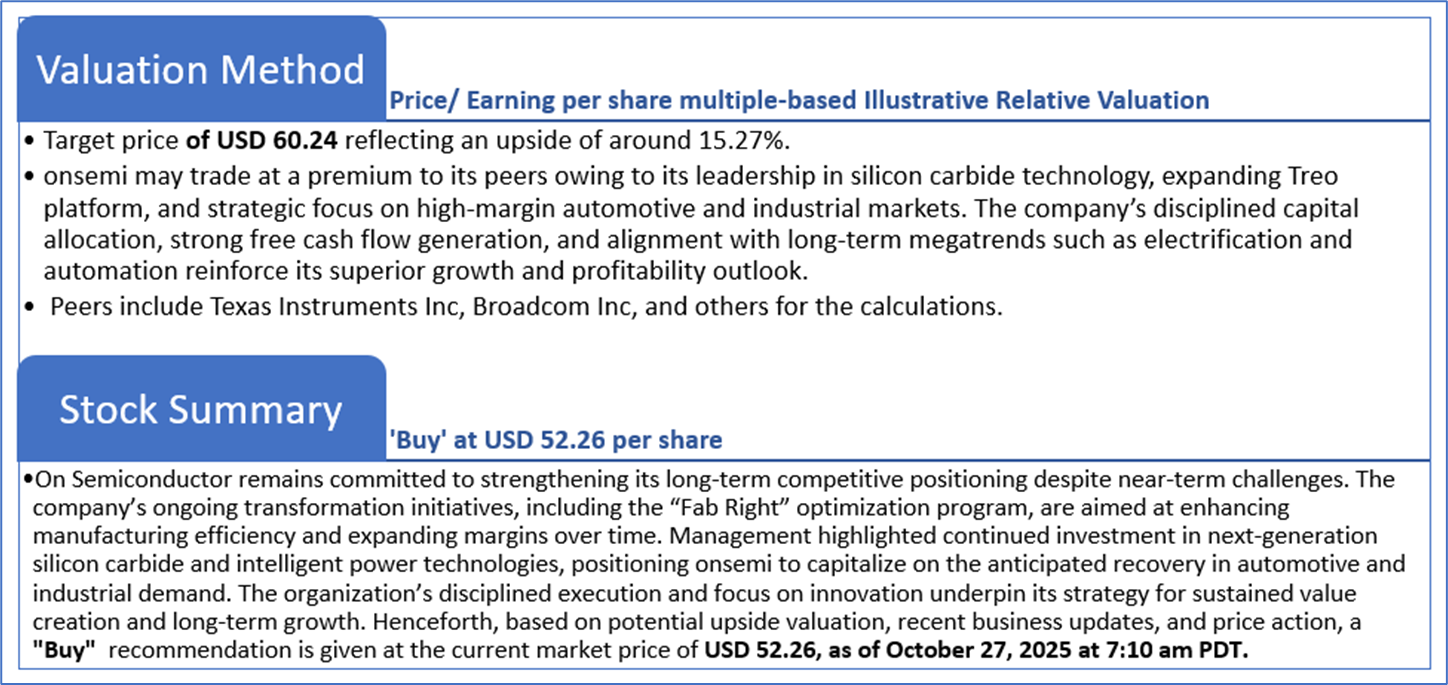
Valuation Methodology: Price/ Earnings Per Share Multiple Based Relative Valuation (Illustrative)
Note 1: Past performance is not a reliable indicator of future performance.
Note 2: The reference date for all price data, currency, technical indicators, support, and resistance levels as on October 27, 2025. The reference data in this report has been partly sourced from REFINITIV.
Note 3: Investment decisions should be made depending on an individual's appetite for upside potential, risks, holding duration, and any previous holdings. An 'Exit' from the stock can be considered if the Target Price mentioned as per the Valuation and or the technical levels provided has been achieved and is subject to the factors discussed above.
Note 4: Dividend Yield may vary as per the stock price movement.
Note 5: Kalkine reports are prepared based on the stock prices captured either from REFINITIV or Trading View. Typically, REFINITIV or Trading View may reflect stock prices with a delay which could be a lag of 25-30 minutes. There can be no assurance that future results or events will be consistent with the information provided in the report. The information is subject to change without any prior notice.
Technical Indicators Defined: -
Support: A level at which the stock prices tend to find support if they are falling, and a downtrend may take a pause backed by demand or buying interest.
Resistance: A level at which the stock prices tend to find resistance when they are rising, and the uptrend may take a pause due to profit booking or selling interest.
Stop-loss: In general, it is a level to protect further losses in case of any unfavorable movement in the stock prices.
Past performance is not a reliable indicator of future performance.

 Please wait processing your request...