Cryptocurrency Market Round-Up
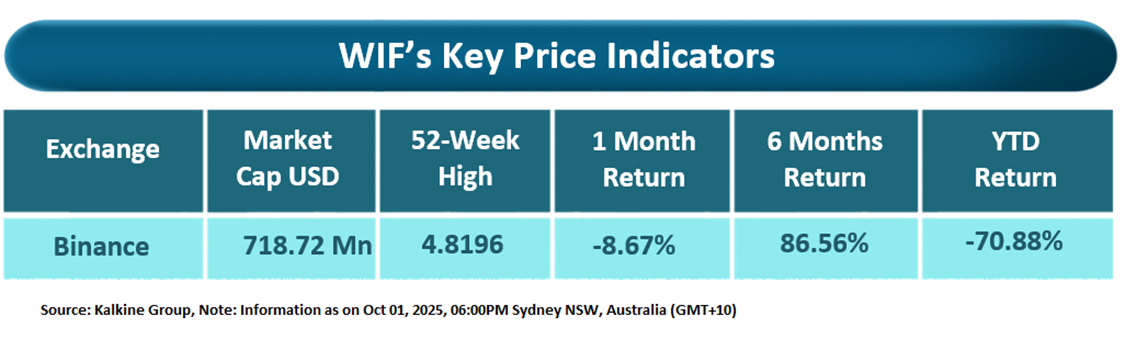
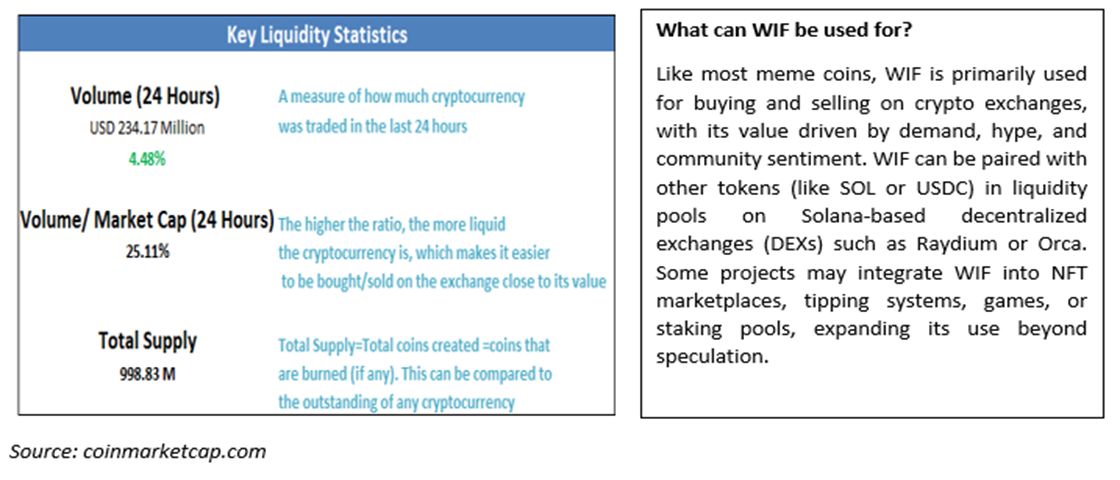
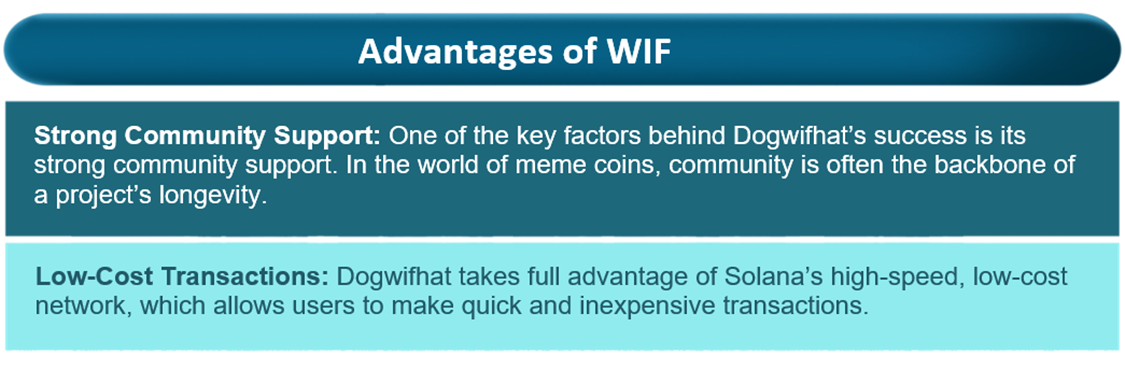
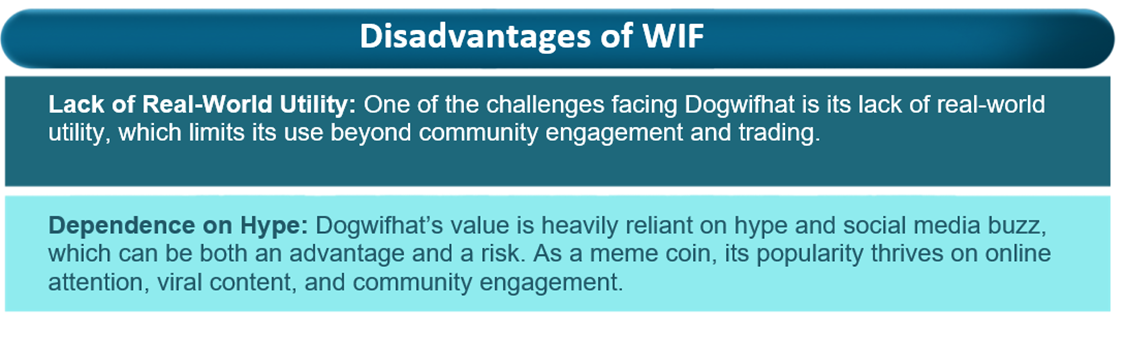
Typically, cryptocurrencies are termed as digital currencies and use blockchain technology to record every transaction. Meme Coins are a category of cryptocurrencies that are typically created as jokes or memes, often with little to no inherent utility or technological innovation. Dogwifhat (WIF) is a meme coin launched on the Solana blockchain in November 2023, centered around the humorous and quirky concept of a dog wearing a hat. This lighthearted theme has helped the coin gain significant popularity and value, quickly making it a notable player in the ever-growing meme coin market. WIF has a market capitalization of ~USD 718.72 million (as per TradingView as of October 01, 2025).
Last week, the S&P Cryptocurrency Broad Digital Market (BDM) Index opened weak and extended its losses, falling 448.84 points (~6.52%) to close at 6,438.01 for the week ending September 26, 2025. However, with the start of the new trading week on September 29, the index regained strength, reflecting renewed positive momentum. The broader cryptocurrency market also remains on a bullish note, as major coins like Bitcoin and Ethereum consolidate after recent retreats, supporting the prevailing optimistic sentiment.
Section 1: Key Performance Indicators:
Section 2: Technical Analysis
The Meme Coins Cryptocurrency Report covers Price Action, Technical Indicators Analysis along with the Resistance and Support Levels, on selected cryptocurrency. Noted below is the illustrative technical score based on technical indicators for Dogwifhat (WIF):
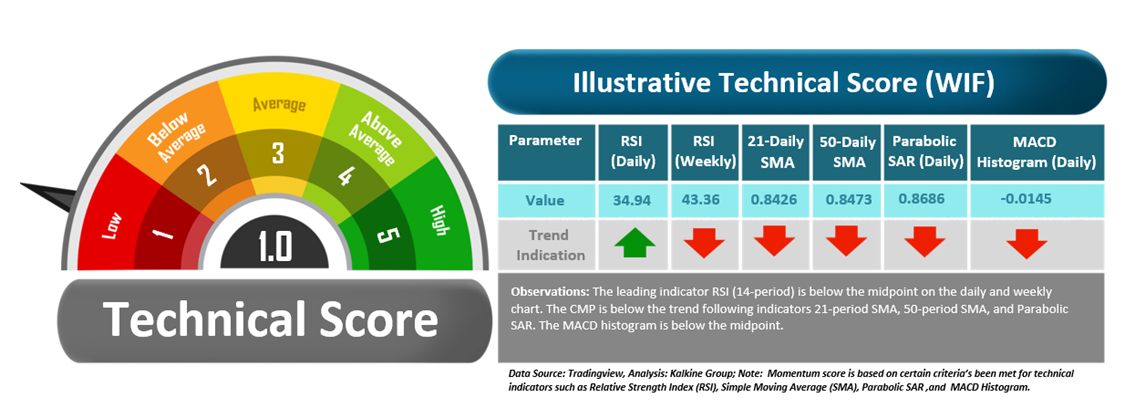
Although the technical momentum score is coming at 1.0, looking at the daily price chart WIF is currently trading above a major support level, signaling potential upside if it can break through resistance levels. However, risks persist due to market volatility and external factors such as news or macroeconomic events. While there’s room for upside if WIF holds above support and clears resistance, caution is advised to manage potential risks.
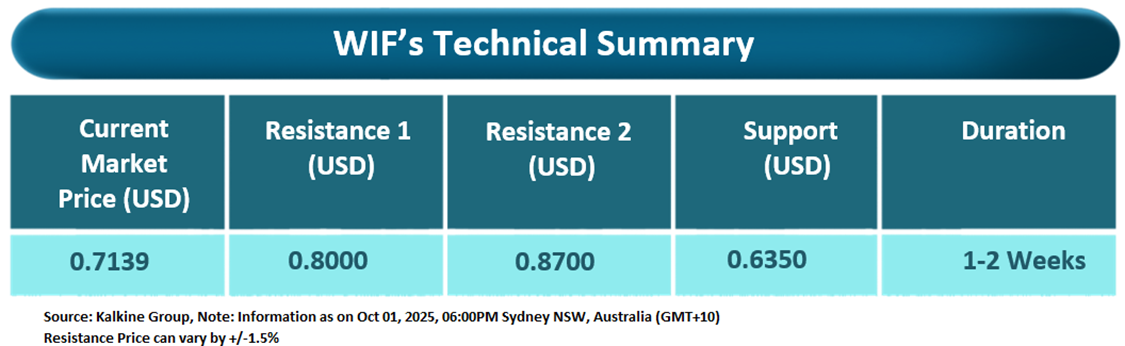
Noted below are the generic insights, support, and resistance levels for the next 1-2 weeks duration for the Dogwifhat:
Resistance & Support Levels as mentioned herein are only indicative in nature as per trend analysis and further evaluation is required when looking at cryptocurrency under discussion.
Note: The reference Information in this report has been sourced from TradingView.
WIF Technical Analysis Summary (On the Daily Chart):
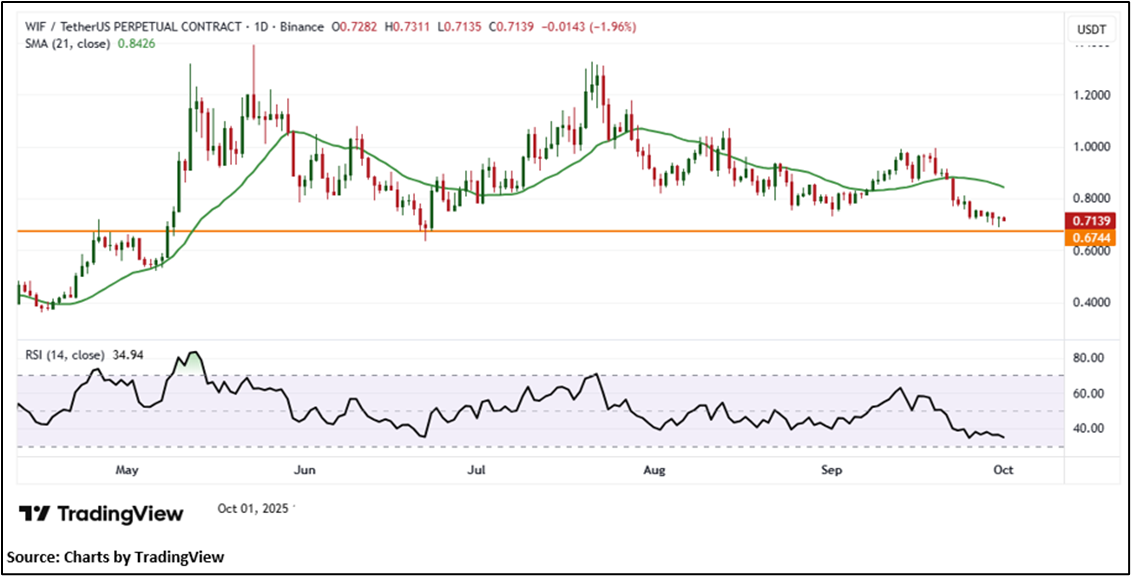
On the daily chart, WIF is holding above the horizontal trendline support near USD 0.6744, indicating a mildly positive bias. The 14-period RSI has recovered to ~34.94, signaling improving momentum and the potential for a short-term reversal. However, the stock remains below the 21-period SMA, which now serves as dynamic resistance. A sustained move above this level could strengthen bullish momentum and reinforce the near-term positive outlook.
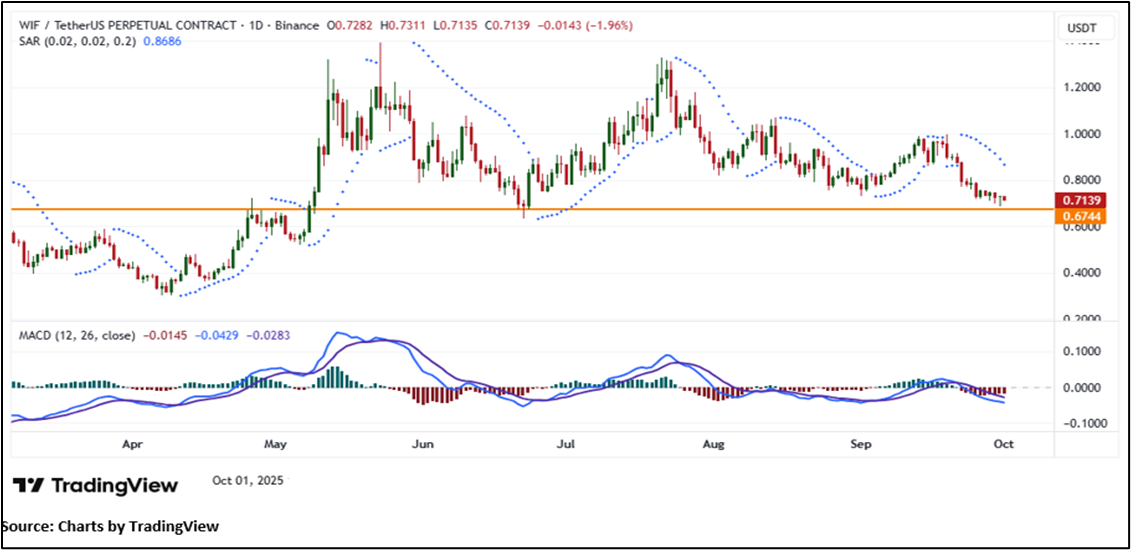
The MACD histogram remains below the centerline. Moreover, WIF is currently trading below the Parabolic SAR indicator, which may serve as an overhead resistance level. Now the next resistance level appears to be at USD 0.800, and prices may test this level in the coming sessions (1-2 weeks).
Section 3: Key Advantages and Disadvantages:
Disclosures:
Markets are trading in a highly volatile zone currently due to certain macro-economic issues and geopolitical tensions prevailing. Therefore, it is prudent to follow a cautious approach while making investment decisions.
Kalkine reports are prepared based on the crypto prices captured from either REFINITIV or Trading View. Typically, REFINITIV or Trading View may reflect crypto prices with a delay which could be a lag of 25-30 minutes. There can be no assurance that future results or events will be consistent with the information provided in the report. The information is subject to change without any prior notice.
Note 2: How to Read the Chart?
The Green colour line reflects the 21-period simple moving average (SMA) while the red line indicates the 50-period SMA. SMA helps to identify existing price trends and if the prices trade above the 21-period and 50-period SMA, then in general it shows an uptrend trend.
The Black colour line in the chart’s lower segment is a 14-period Relative Strength Index (RSI) which indicates momentum in trend. A reading of 70 or above suggests overbought status, while a reading of 30 or below suggests an oversold status.
The Blue colour bars in the chart’s lower segment show the volume of the Cryptocurrency. The volume is the quantity that changed hands during the given period. Cryptocurrencies with high volumes are more liquid compared to lesser once and higher volumes help in easier and faster execution of the order.
The Orange colour lines are the trend lines drawn by connecting two or more price points and used for trend identification purposes. The trend line also acts as a line of support and resistance.
Technical Indicators Defined: -
Support: A level at which the Cryptocurrency prices tend to find support if they are falling, and a downtrend may take a pause backed by demand or buying interest. Support 1 refers to the nearby support level for the Cryptocurrency and if the price breaches the level, then Support 2 may act as the crucial support level for the Cryptocurrency.
Resistance: A level at which the Cryptocurrency prices tend to find resistance when they are rising, and an uptrend may take a pause due to profit booking or selling interest. Resistance 1 refers to the nearby resistance level for the Cryptocurrency and if the price surpasses the level, then Resistance 2 may act as the crucial resistance level for the Cryptocurrency.
The reference date for all price data, currency, technical indicators, support, and resistance levels is October 01, 2025, at 06:00 PM, (GMT+10) Time in Sydney NSW, Australia. The S&P Cryptocurrency BDM Index in this report has been sourced from REFINITIV.
Abbreviations
CMP: Current Market Price
SMA: Simple Moving Average
RSI: Relative Strength Index
USD: United States dollar
Note: Trading decisions require a thorough analysis by individuals. Technical reports in general chart out metrics that may be assessed by individuals before any Cryptocurrency evaluation. The above are illustrative analytical factors used for evaluating Meme Cryptocurrency; other parameters can be looked at along with additional risks per se. Past performance is neither an indicator nor a guarantee of future performance.
Disclaimer
This report has been issued by Kalkine Limited (Company number 07903332), a private limited company, incorporated in England and Wales ("Kalkine”, “us”, “our”, “we”). Kalkine.co.uk and associated pages are published by Kalkine. Kalkine is authorised and regulated by the Financial Conduct Authority under reference number 579414.
The information in this report and on the Kalkine website has been prepared from a wide variety of sources, which Kalkine, to the best of its knowledge and belief, considers accurate. Kalkine has made every effort to ensure the reliability of information contained in its reports, newsletters and websites. All information represents our views at the date of publication and may change without notice. The information in this report does not constitute an offer to sell securities or other financial products or a solicitation of an offer to buy securities or other financial products. Our reports contain non personalized recommendations to invest in securities and other financial products.
Any information in this report relating to digital currency or other cryptoasset types (cryptoassets) is based on the law that applied at the time the report was prepared. The laws that apply to cryptoassets (and how a particular cryptoasset is regulated) may change. Investments in cryptoassets can be high risk and volatile. You should seek appropriate advice and consider your objectives and risk appetite before making any decision in relation to such products.
Kalkine does not offer financial advice based upon your personal financial situation or goals, and we shall not be held liable for any investment or trading losses you may incur by using the opinions expressed in our reports, publications, market updates, news alerts and corporate profiles. No information, whether oral or written, obtained by you from us or through or from the service shall create any warranty not expressly stated. Kalkine does not intend to exclude any liability which it is not permitted to exclude under applicable law or regulation. Kalkine’s non-personalised advice does not in any way endorse or recommend individuals, investment products or services for your personal financial situation. You should discuss your portfolios and the risk tolerance level appropriate for your personal financial situation, with a professional authorised financial planner and adviser. You should be aware that the value of any investment and the income from it can go down as well as up and you may not get back the amount invested. Past performance is not indicative of future results. You should also be aware that most cryptoassets are not regulated by the FCA and are not protected under the Financial Services Compensation Scheme or the Financial Ombudsman Service. Further, Capital Gains Tax (CGT) may be payable on profits made from investing in cryptoassets.
Please also read our Terms & Conditions for further information. Employees and/or associates of Kalkine and its related entities may hold interests in the securities or other financial products covered in this report or on the Kalkine website. Any such employees and associates are required to comply with certain safeguards, procedures and disclosures as required by law.
On the date of publishing this report (referred to on the Kalkine website), employees and/or associates of Kalkine and its related entities do not hold interests in any of the cryptoassets covered on the Kalkine website unless those persons comply with certain safeguards, procedures, and disclosures.
Kalkine Media Limited, an affiliate of Kalkine, may have received, or be entitled to receive, financial consideration in connection with providing information about certain entity(s) covered on its website including entities covered in this report.
Past performance is not a reliable indicator of future performance.
 Please wait processing your request...