Crypto Market Round-Up
Typically, cryptocurrencies are termed as digital currencies and use blockchain technology to record every transaction. Ripple (XRP), within the realm of blockchain technology, represents both a digital currency and a payment protocol aimed at enabling fast, cost-efficient, and secure cross-border transactions. Unlike conventional financial systems, Ripple leverages a decentralized network to streamline currency exchanges globally, providing a more efficient alternative for international money transfers. XRP has a market capitalization of ~USD 151.17 billion (as per TradingView as of October 30, 2025).
For the week ending October 24, 2025, the S&P Cryptocurrency Broad Digital Market (BDM) Index posted a solid gain, rising 239.59 points (or 3.92%) to close at 6,355.08. The index opened the week on a positive note and sustained its upward momentum throughout the period, reflecting broad-based strength across the digital asset space. As the new trading week began on October 27, the index continued to exhibit resilience, supported by a generally bullish tone in the cryptocurrency market. However, major digital assets such as Bitcoin and Ethereum experienced notable declines, tempering optimism and weighing on overall investor sentiment across the broader crypto landscape.
Having understood the S&P Cryptocurrency BDM Index movement over the last week and the scenario for the upcoming week, one crypto that seems ‘Bearish’ at the current level appears to be Ripple (XRP) Perpetual Futures based on the below technical parameters: -
Ripple (XRP):
Noted below are the generic insights, indicative entry price, support levels, and resistance for the next 1-2 weeks duration for the XRP:
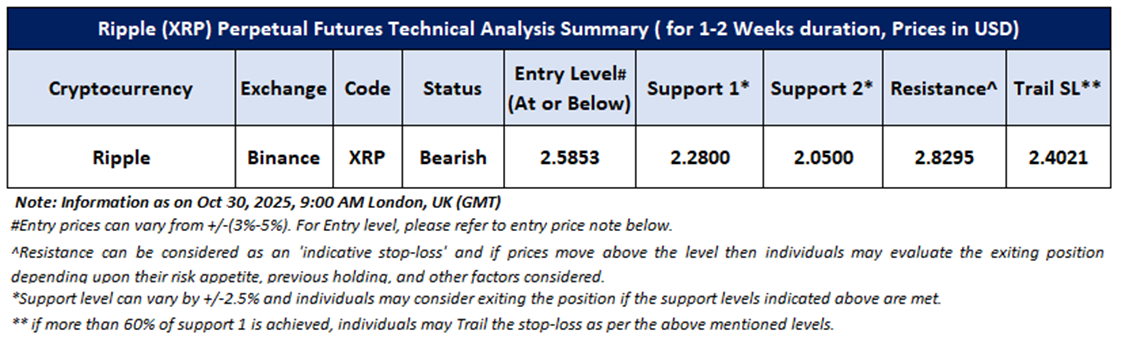
Entry level and Resistance Levels as mentioned herein are only indicative in nature as per trend analysis and further evaluation is required when looking at cryptocurrency under discussion.
Note: The reference Information in this report has been sourced from TradingView.
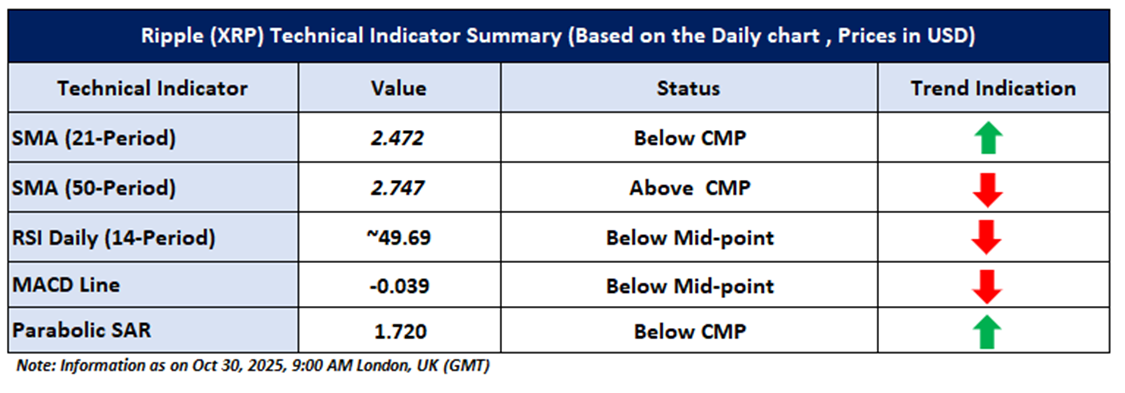
XRP Technical Analysis Summary (On the Daily Chart):
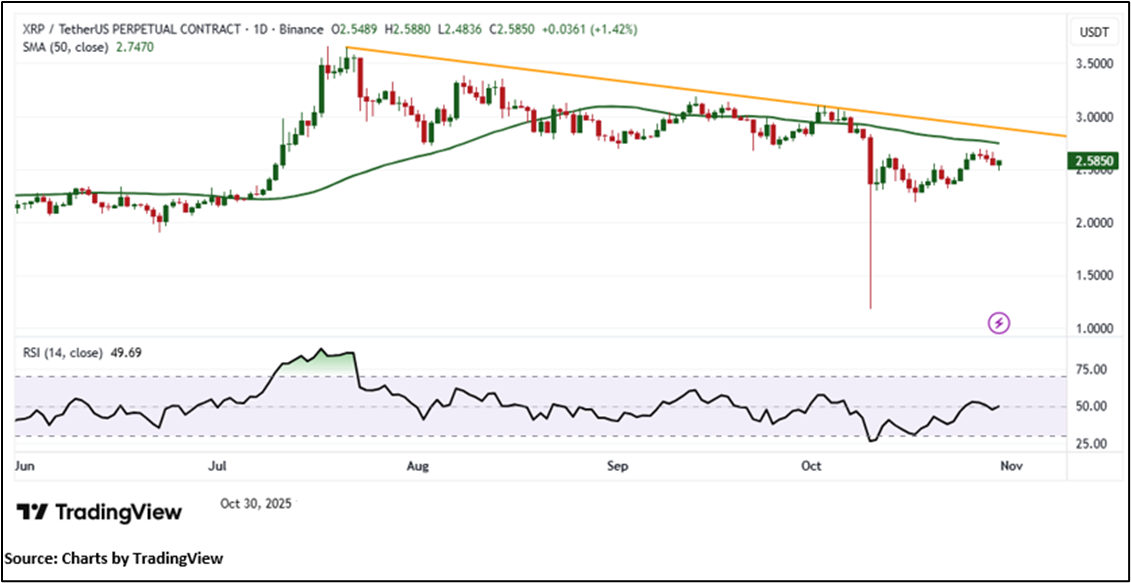
XRP is currently trading below a key horizontal resistance near $2.795, a historically significant level that has repeatedly capped upward movements. The overall price structure remains bearish, highlighting the persistence of downside momentum and a cautious market tone. Momentum indicators align with this outlook, as the 14-period Relative Strength Index (RSI) stands at 49.69, reflecting moderate strength but also signaling potential for renewed bearish momentum if selling pressure intensifies. Additionally, XRP continues to trade beneath its 50-period Simple Moving Average (SMA), which acts as a dynamic resistance level and reinforces the prevailing negative bias in the near term.
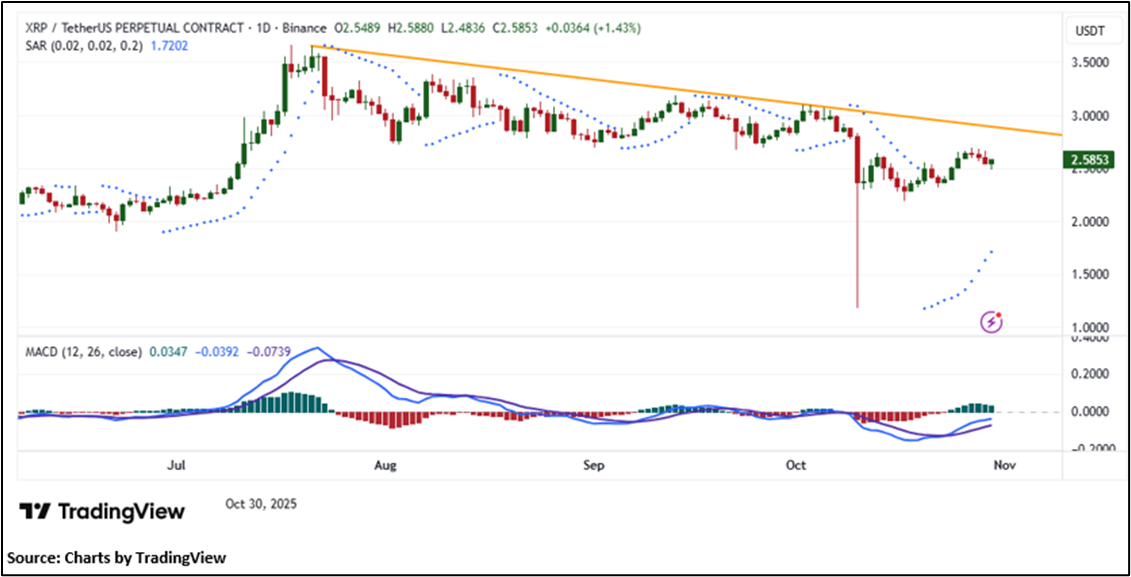
The MACD line remains positioned below the zero line, reaffirming the persistence of bearish momentum in the current trend. However, the price action is still trading above the Parabolic SAR, which continues to act as a near-term support indicator. Now the next support level appears to be at USD 2.280, and prices may test this level in the coming sessions (1-2 weeks).
Noted below are the illustrative points as key positives and risks when looking at Ripple (XRP) in the cryptocurrency space:-
Illustrative points as Positives:
- Speed and Scalability: One of XRP’s key advantages lies in its exceptional transaction speed and scalability. The XRP network can process transactions within seconds, supporting a capacity of up to 1,500 transactions per second. This high throughput positions XRP as a compelling solution for fast, cost-effective cross-border payments and real-time settlements.
- Strong Partnerships: Ripple, the company behind XRP, has forged strategic partnerships with major financial institutions worldwide, significantly enhancing the network’s credibility and adoption. These alliances have been instrumental in integrating XRP into mainstream financial systems, reinforcing its role as a bridge asset for global payment and liquidity solutions.
Illustrative points as Risks:
- Centralization Concerns: A key criticism of XRP revolves around its perceived centralization. Unlike fully decentralized cryptocurrencies such as Bitcoin, XRP’s ecosystem remains largely influenced by Ripple, the company behind its development and distribution. This degree of control has raised concerns regarding transparency, governance, and potential centralization of decision-making, which some critics argue may undermine the trustless principles of blockchain technology.
- Competition: XRP also operates within a highly competitive digital asset landscape, contending with major players like Bitcoin, Ethereum, and an expanding range of emerging altcoins. The rapid pace of innovation across the sector poses challenges for XRP’s market share and long-term growth potential, particularly if newer platforms introduce superior scalability, interoperability, or regulatory compliance frameworks that capture investor and institutional interest.
Conclusion:
Based on the above-mentioned price action analysis and technical indicators outlook, Ripple (XRP) may witness movement in the downside direction. The trend looks to be in an interesting space, and the currency looks ‘Bearish’ given the current price of USD 2.5853 as on October 30, 2025, at 9:00 AM, (GMT) Time in London, UK. However, volatility in the price should be borne in mind when looking at further evaluation for investment scenarios. Markets are trading in a highly volatile zone currently due to certain macro-economic issues and geopolitical tensions prevailing. Therefore, it is prudent to follow a cautious approach while making investment decisions.
Related Risks: Based on the technical analysis, the risks are defined as per risk-reward ratio (~0.80:1.00), however, returns are generated within 1-2 weeks’ time frame. This report may be looked at from high-risk perspective and recommendations are provided are for a short duration. Recommendations provided in this report are solely based on technical parameters, and the fundamental performance of the cryptocurrency has not been considered in the decision-making process. Other factors which could impact the cryptocurrency prices include market risks, regulatory risks, interest rates risks, currency risks, social and political instability risks etc.
Note 1: Trend Indications
Bullish Trend is generally used in information services and financial reporting as a trend typified with an upward momentum in prices based on the market sentiments, overall price action, and technical analysis. Typically, Resistance Levels or Indicative Stop loss levels need to be evaluated for exit triggers.
Bearish Trend is generally used in information services and financial reporting as a trend typified with a downward movement in prices based on the market sentiments, overall price action, and technical analysis. Typically, Support Levels or Indicative Stop loss levels need to be evaluated for exit triggers.
When we identify trends as ‘Bullish’ or ‘Bearish’ it is based on a technical analysis of the available data as we understand it and is not, and should not be considered as, either advice or a recommendation to buy, sell or hold the relevant cryptoassets.
Kalkine reports are prepared based on the crypto prices captured from either REFINITIV or Trading View. Typically, REFINITIV or Trading View may reflect crypto prices with a delay which could be a lag of 25-30 minutes. There can be no assurance that future results or events will be consistent with the information provided in the report. The information is subject to change without any prior notice.’
Note 2: How to Read the Chart?
The Green colour line reflects the 21-period simple moving average (SMA) while the red line indicates the 50-period SMA. SMA helps to identify existing price trends and if the prices trade above the 21-period and 50-period SMA, then in general it shows an uptrend trend.
The Black colour line in the chart’s lower segment is a 14-period Relative Strength Index (RSI) which indicates momentum in trend. A reading of 70 or above suggests overbought status, while a reading of 30 or below suggests an oversold status.
The Blue colour bars in the chart’s lower segment show the volume of the Cryptocurrency. The volume is the quantity that changed hands during the given period. Cryptocurrencies with high volumes are more liquid compared to lesser once and higher volumes help in easier and faster execution of the order.
The Orange colour lines are the trend lines drawn by connecting two or more price points and used for trend identification purposes. The trend line also acts as a line of support and resistance.
Technical Indicators Defined: -
Support: A level at which the Cryptocurrency prices tend to find support if they are falling, and a downtrend may take a pause backed by demand or buying interest. Support 1 refers to the nearby support level for the Cryptocurrency and if the price breaches the level, then Support 2 may act as the crucial support level for the Cryptocurrency.
Resistance: A level at which the Cryptocurrency prices tend to find resistance when they are rising, and an uptrend may take a pause due to profit booking or selling interest. Resistance 1 refers to the nearby resistance level for the Cryptocurrency and if the price surpasses the level, then Resistance 2 may act as the crucial resistance level for the Cryptocurrency.
Stop-loss: It is a level to protect further losses in case of unfavourable movement in the Cryptocurrency prices.
A trailing stop-loss is a modification of stop-loss in case of favourable movement in the price to protect the gains. It is suggested to Trail the Stop-Loss as per the aforementioned levels if the Cryptocurrency price achieves more than 60% of the Resistance 1. individuals, in general, might consider exiting from the position as per the Trailing Stop-Loss level if the price starts moving downwards after achieving more than 60% of Resistance 1. However, these indications need further evaluation basis associated risks and any change in trends.
The reference date for all price data, currency, technical indicators, support, and resistance levels is October 30, 2025 at 9:00 AM, (GMT) Time in London, UK. The S&P Cryptocurrency BDM Index in this report has been sourced from REFINITIV.
Abbreviations
CMP: Current Market Price
SMA: Simple Moving Average
RSI: Relative Strength Index
USD: United States dollar
Note: This publication is for informational purposes only based on technical analysis and does not reflect the fundamental validity of the cryptoasset. It in no way constitutes investment advice or a recommendation to buy, sell or hold financial instruments. Trading decisions require a thorough analysis by investors taking account of a range of factors, including in relation to cryptoassets in themselves, general market trends and an investor’s own ability and appetite to take risks and bear losses. Past performance is neither an indicator nor a guarantee of future performance.
Disclaimer
This report has been issued by Kalkine Limited (Company number 07903332), a private limited company, incorporated in England and Wales ("Kalkine”, “us”, “our”, “we”). Kalkine.co.uk and associated pages are published by Kalkine. Kalkine is authorised and regulated by the Financial Conduct Authority under reference number 579414.
The information in this report and on the Kalkine website has been prepared from a wide variety of sources, which Kalkine, to the best of its knowledge and belief, considers accurate. Kalkine has made every effort to ensure the reliability of information contained in its reports, newsletters and websites. All information represents our views at the date of publication and may change without notice. The information in this report does not constitute an offer to sell securities or other financial products or a solicitation of an offer to buy securities or other financial products. Our reports contain non personalized recommendations to invest in securities and other financial products.
Any information in this report relating to digital currency or other cryptoasset types (cryptoassets) is based on the law that applied at the time the report was prepared. The laws that apply to cryptoassets (and how a particular cryptoasset is regulated) may change. Investments in cryptoassets can be high risk and volatile. You should seek appropriate advice and consider your objectives and risk appetite before making any decision in relation to such products.
Kalkine does not offer financial advice based upon your personal financial situation or goals, and we shall not be held liable for any investment or trading losses you may incur by using the opinions expressed in our reports, publications, market updates, news alerts and corporate profiles. No information, whether oral or written, obtained by you from us or through or from the service shall create any warranty not expressly stated. Kalkine does not intend to exclude any liability which it is not permitted to exclude under applicable law or regulation. Kalkine’s non-personalised advice does not in any way endorse or recommend individuals, investment products or services for your personal financial situation. You should discuss your portfolios and the risk tolerance level appropriate for your personal financial situation, with a professional authorised financial planner and adviser. You should be aware that the value of any investment and the income from it can go down as well as up and you may not get back the amount invested. Past performance is not indicative of future results. You should also be aware that most cryptoassets are not regulated by the FCA and are not protected under the Financial Services Compensation Scheme or the Financial Ombudsman Service. Further, Capital Gains Tax (CGT) may be payable on profits made from investing in cryptoassets.
Please also read our Terms & Conditions for further information. Employees and/or associates of Kalkine and its related entities may hold interests in the securities or other financial products covered in this report or on the Kalkine website. Any such employees and associates are required to comply with certain safeguards, procedures and disclosures as required by law.
On the date of publishing this report (referred to on the Kalkine website), employees and/or associates of Kalkine and its related entities do not hold interests in any of the cryptoassets covered on the Kalkine website unless those persons comply with certain safeguards, procedures, and disclosures.
Kalkine Media Limited, an affiliate of Kalkine, may have received, or be entitled to receive, financial consideration in connection with providing information about certain entity(s) covered on its website including entities covered in this report.
Past performance is not a reliable indicator of future performance.
 Please wait processing your request...