Kalkine’s Global Travel & Leisure Report offers a comprehensive view of the key companies and evolving trends across the travel value chain covering countries including US, Canada, Australia, UK, and New Zealand. This includes airlines, hospitality chains, digital travel platforms, as well as the rapidly growing leisure, entertainment, and gaming segments that are redefining the way people engage with travel experiences.

Global Hotel and Resorts Market: A Dynamic Growth Trajectory:
- Travel & Tourism overall reached about $10.9 trillion in 2024 (10% of global GDP), with jobs at ~357 million; 2025 is on track to set fresh records (~USD 11.7 trillion, ~371 million jobs).
- RevPAR/ADR resilient: 2024 ended strong globally—e.g., UAE RevPAR +11%; Japan led APAC with recent RevPAR +27.6% into early 2025. U.S. Dec-2024 ADR was $156.67 with RevPAR +4.4% YoY.
- 2025 Outlook: Projections remain positive but modest: occupancy growth cut by 0.4 ppts, ADR at +1.6%, RevPAR at +1.8%. Higher-end hotels expected to lead performance; GOP and EBITDA margins seen improving slightly year-over-year.
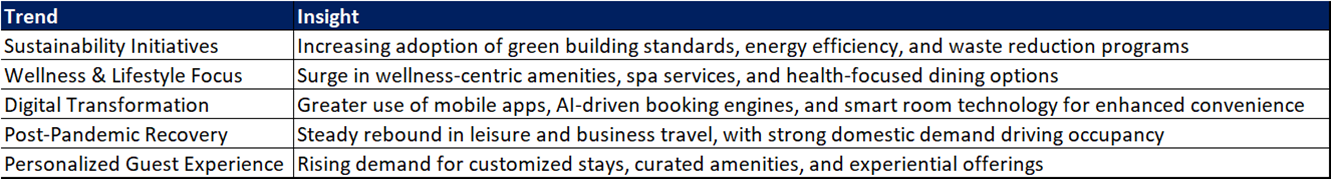
- Global travel trends show strong demand rebound in Japan/APAC with significant RevPAR gains, record 2025 tourism contribution in India driven by robust demand, while the U.K. faces policy-related headwinds dampening international spending versus 2019 levels.
- Global giants dominate: Marriott, Hilton, IHG, plus Wyndham and Choice (very large property counts in economy/midscale), and Hyatt in upper-upscale/luxury.


Between 2020 and 2024, the global hotel industry demonstrated a remarkable trajectory of recovery and growth:
- The pandemic devastated the hotel industry in 2020, with travel bans and lockdowns driving occupancy, ADR, and RevPAR to historic lows. Major chains reported record losses, focusing on cost control, workforce cuts, and liquidity preservation while offering limited services like quarantine stays and delivery
- Vaccination drives and phased reopenings in 2021 revived domestic leisure travel, though business travel remained weak. Staycations and drive-to destinations gained popularity, while hotels introduced “work-from-hotel” options. Hygiene protocols, flexible bookings, and contactless technology became critical to restoring guest confidence.
- Recovery accelerated as restrictions eased and international travel returned. Leisure demand led the rebound, with luxury resorts outperforming budget hotels. Supply growth slowed, supporting higher ADR. Group travel and MICE events cautiously resumed, while operational efficiency became a key focus for hoteliers.
- By 2023, occupancy approached or exceeded 2019 levels, while ADR and RevPAR surpassed pre-pandemic highs. China’s reopening fueled Asia-Pacific growth, and trends like “leisure” travel and extended stays gained traction. Sustainability and digitalization emerged as major drivers of competitiveness.
- The industry stabilized in 2024, prioritizing profitability through tech integration, dynamic pricing, and contactless operations. Challenges included labor shortages and rising costs, prompting asset-light strategies. ESG commitments grew in importance, while Asia-Pacific led growth and Europe faced cost and geopolitical pressures.
Kalkine’s Global Travel & Leisure Report covers the Investment Highlights, Key Financial Metrics, Risks, Technical Analysis along with the Valuation, Target Price, and Recommendation on Park Hotels & Resorts Inc (NYSE: PK).
Section 1: Company Overview and Fundamentals Insights
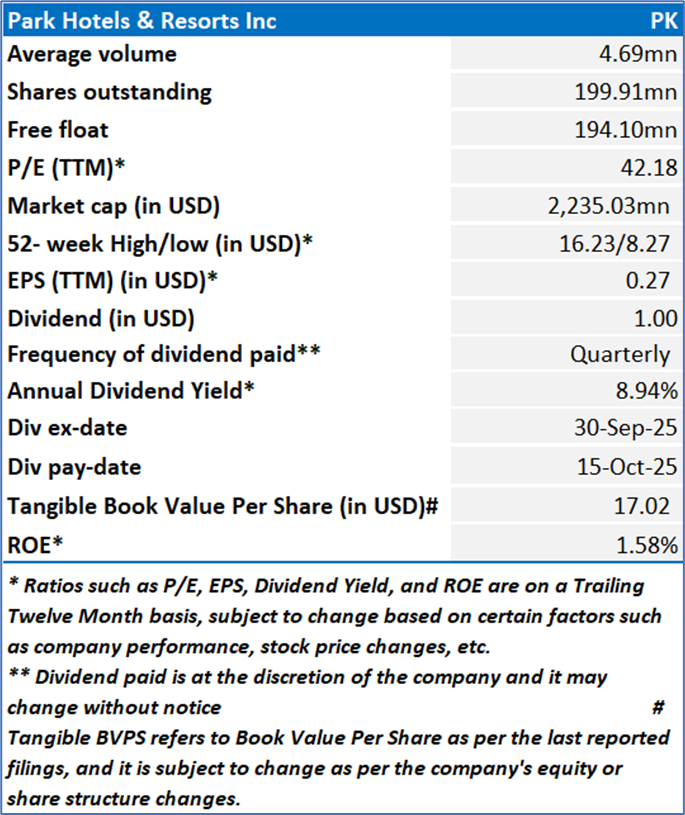
Company Overview: Park Hotels & Resorts Inc (NYSE: PK) operates as a lodging-focused real estate investment trust (REIT), managing a broad portfolio of hotels and resorts that hold substantial real estate value.
Kalkine’s Global Travel and Leisure Report covers the Investment Highlights, Key Financial Metrics, Risks, and Technical Analysis along with the Valuation, Target Price, and Recommendation on the stock.
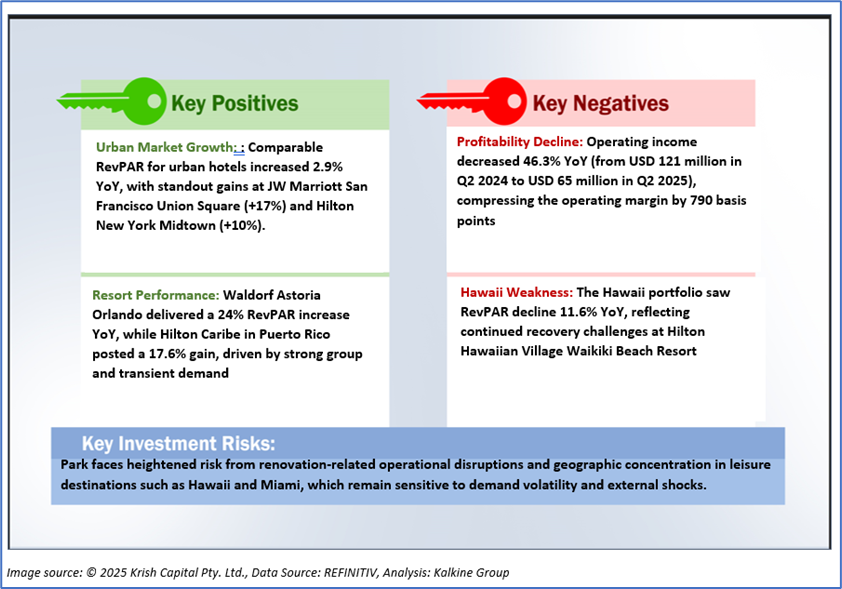
1.2 The Key Positives, Negatives, Investment Highlights, and Risks
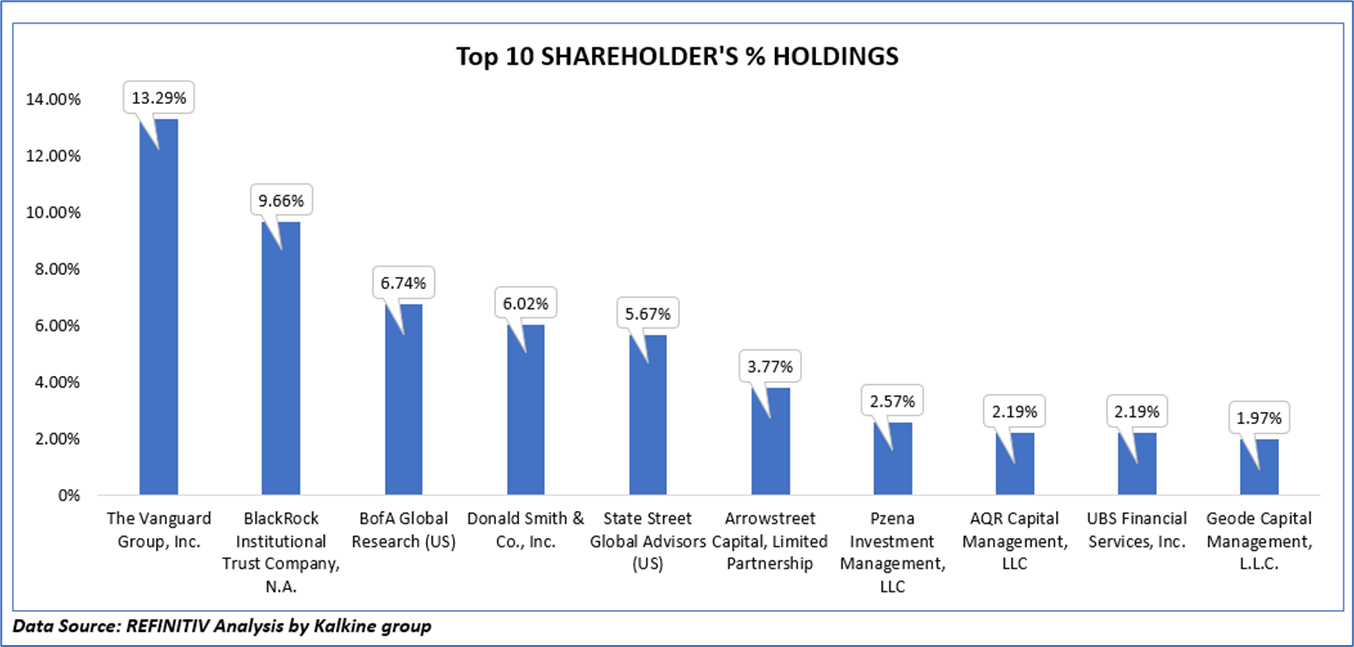
1.3 Top 10 Shareholders:
The top 10 shareholders together form ~54.08% of the total shareholding. The Vanguard Group, Inc. and BlackRock Institutional Trust Company, N.A. hold maximum stakes of 13.29% and 9.66%, respectively.
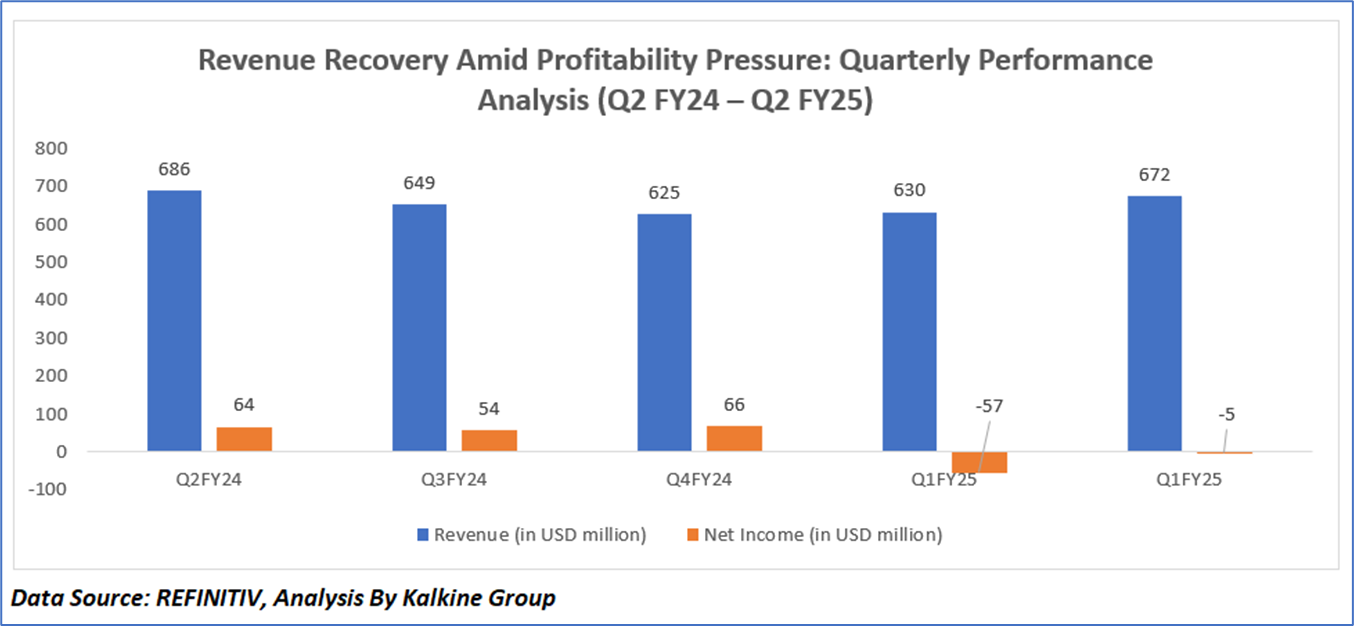
1.4 Key Metrics:
Park Hotels & Resorts experienced a sequential revenue decline from Q2 FY24 (USD 686 million) to Q4 FY24 (USD 625 million), largely due to softer leisure demand, modest ADR pressure, and renovation-related disruptions in key properties. Q1 FY25 remained relatively stable at USD 630 million, while Q2 FY25 showed a strong rebound to USD 672 million, supported by improved group bookings and seasonal demand recovery. Net income, which remained positive through FY24 (USD 54 million–USD 66 million), turned negative in FY25 with a sharp drop to negative USD 57 million in Q1, primarily driven by higher operating costs, interest expenses, and the timing of asset sales. However, Q2 FY25 witnessed a significant improvement, narrowing the loss to negative USD 5 million, reflecting operational efficiencies and RevPAR recovery. Looking ahead, sustained demand in business travel and continued cost discipline could help restore profitability, while the company’s high-quality real estate portfolio positions it well to capture upside as macroeconomic conditions stabilize.
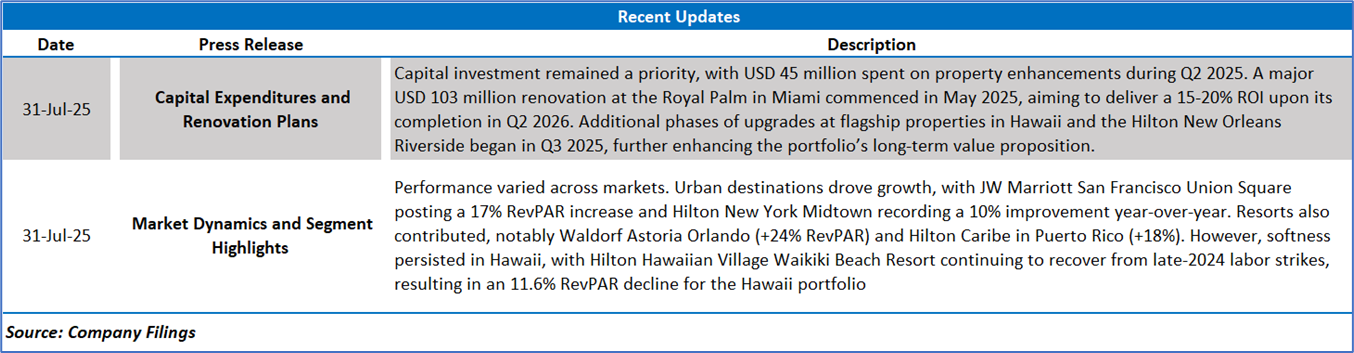
Section 2: Business Updates, Financial and Operational Highlights
2.1 Recent Business Updates:
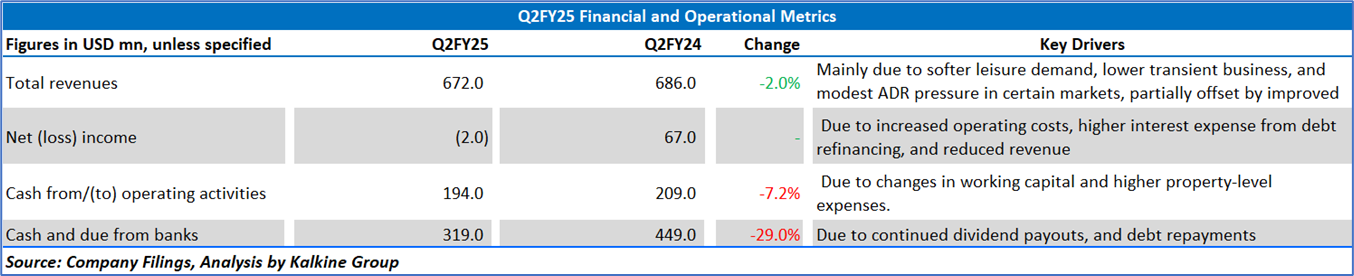
2.2 Q2FY25 Results Highlights (for the 03 months ended June 30, 2025): Below are some key financial highlights:
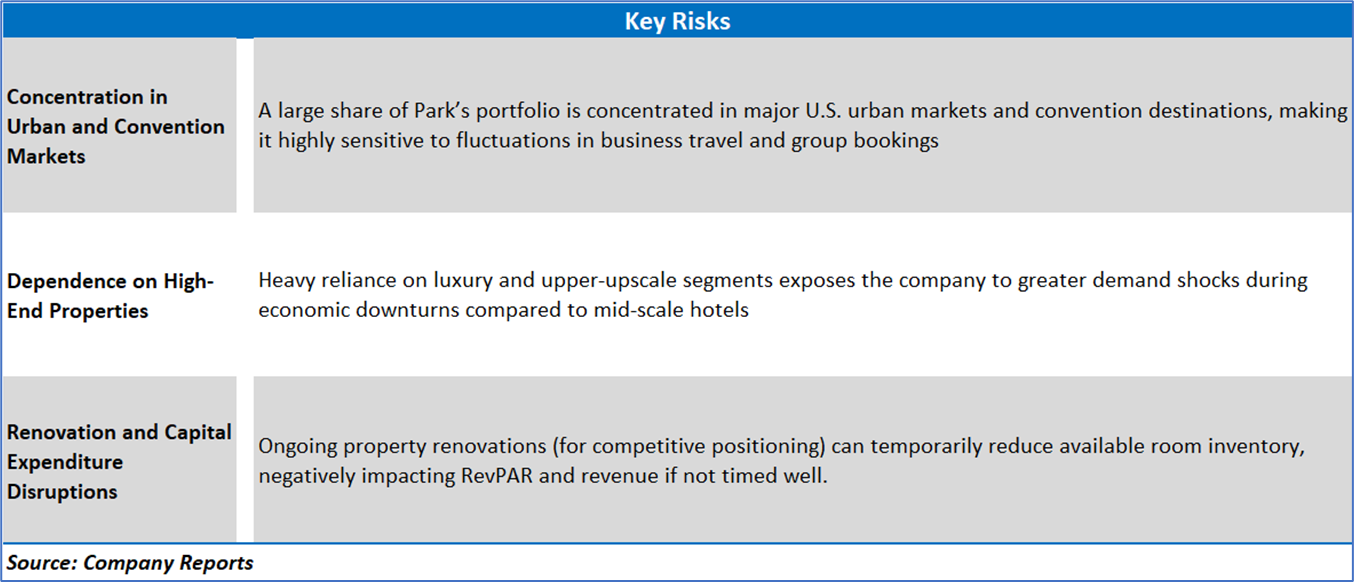
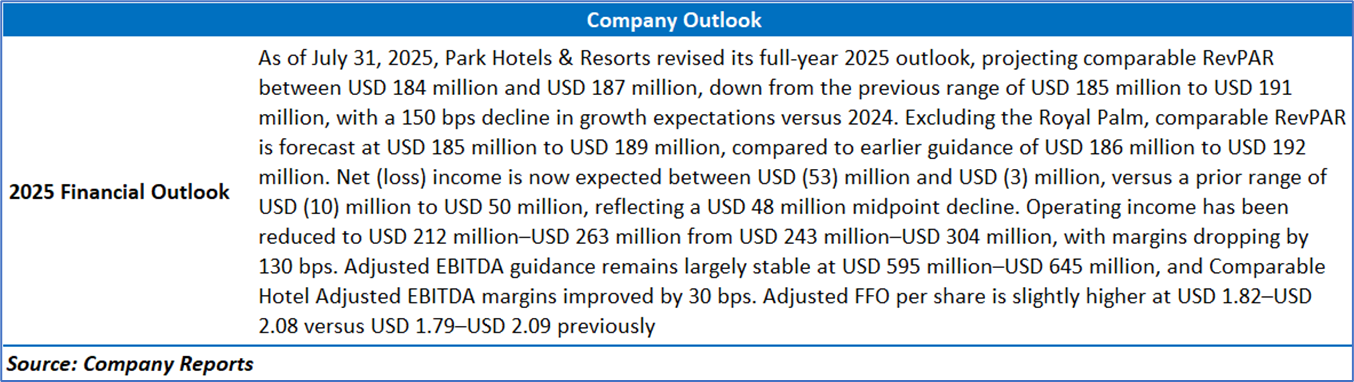
Section 3: Key Risks and Outlook:
Section 4: Stock Recommendation Summary
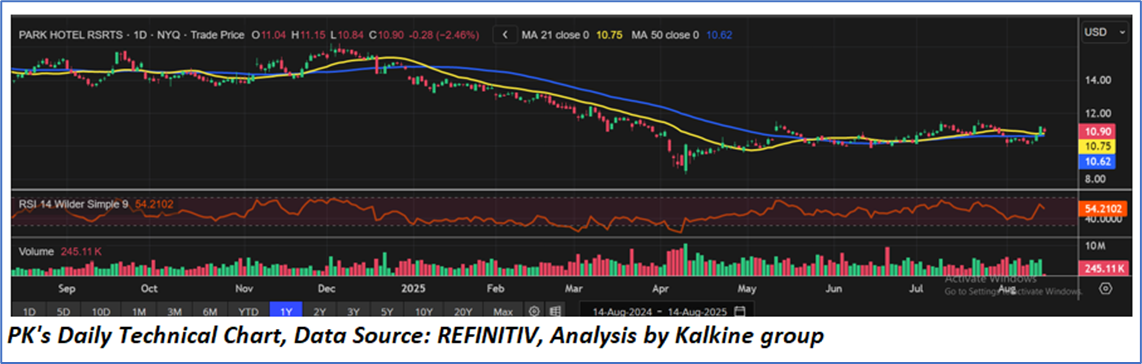
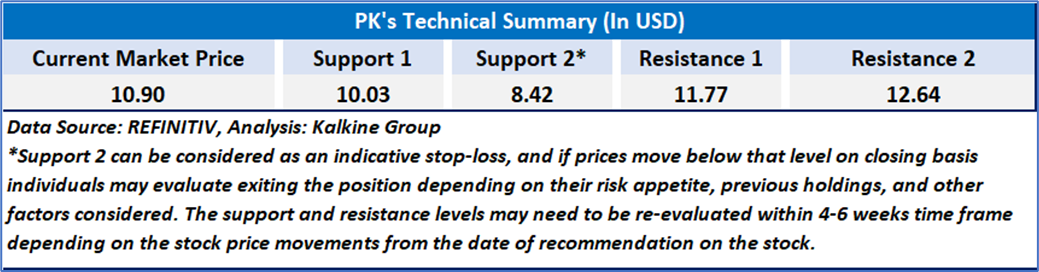
- Price Performance and Technical Summary
- The stock has been in a prolonged downtrend from late 2024 through early 2025, with lower highs and lower lows visible until around April 2025. However, from May 2025 onwards, the price appears to have stabilized and entered a consolidation phase, trading mostly sideways.
- The 50-day MA is still trending downward but flattening, suggesting that the bearish momentum is slowing. The 21-day MA has recently crossed above the 50-day MA, forming a bullish crossover, which could indicate a potential trend reversal if sustained. Current price (USD 10.90) is slightly above both moving averages, a positive sign for near-term momentum.
- RSI is at 54.21, which is neutral but leaning slightly bullish. It is above the midpoint (50), indicating improving momentum without being overbought.
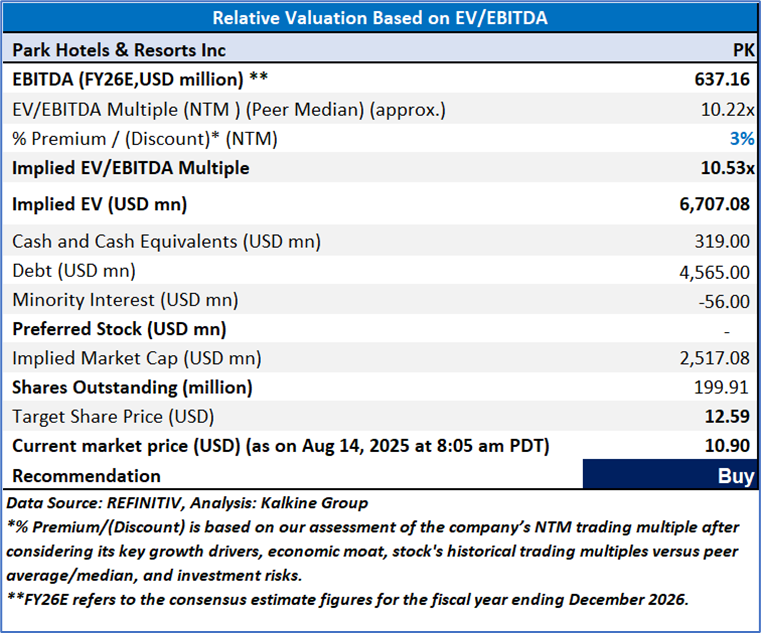
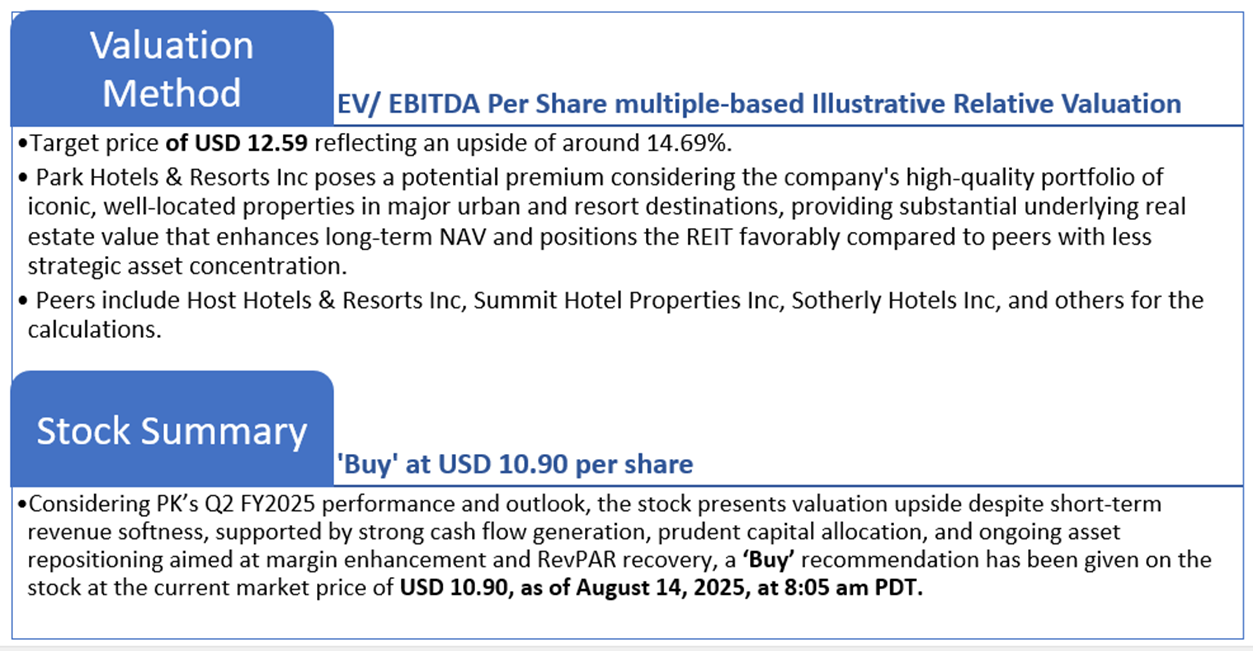
4.2 Fundamental Valuation
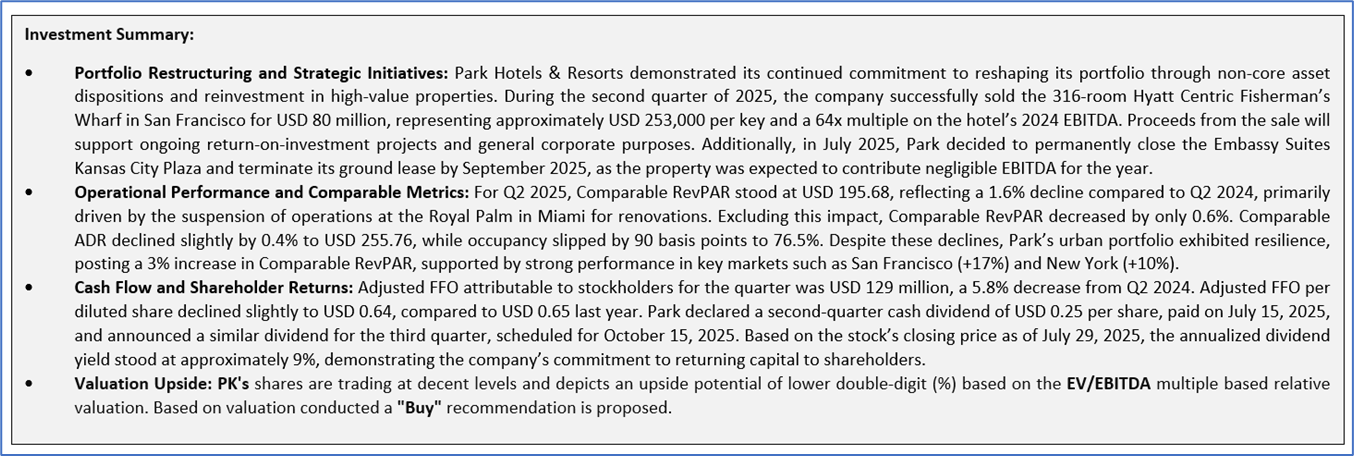
Valuation Methodology: EV/EBITDA Multiple Based Relative Valuation (Illustrative)
Markets are trading in a highly volatile zone currently due to certain macro-economic issues and geopolitical tensions prevailing. Therefore, it is prudent to follow a cautious approach while investing.
Note 1: Past performance is neither an indicator nor a guarantee of future performance.
Note 2: The reference date for all price data, currency, technical indicators, support, and resistance levels is 14 August 2025. The reference data in this report has been partly sourced from REFINITIV.
Note 3: Investment decisions should be made depending on an individual's appetite for upside potential, risks, holding duration, and any previous holdings. An 'Exit' from the stock can be considered if the Target Price mentioned as per the Valuation and or the technical levels provided has been achieved and is subject to the factors discussed above.
Note 4: Dividend Yield may vary as per the stock price movement.
Note 5: Kalkine reports are prepared based on the stock prices captured either from REFINITIV or Trading View. Typically, REFINITIV or Trading View may reflect stock prices with a delay which could be a lag of 25-30 minutes. There can be no assurance that future results or events will be consistent with the information provided in the report. The information is subject to change without any prior notice.
Technical Indicators Defined: -
Support: A level at which the stock prices tend to find support if they are falling, and a downtrend may take a pause backed by demand or buying interest. Support 1 refers to the nearby support level for the stock and if the price breaches the level, then Support 2 may act as the crucial support level for the stock.
Resistance: A level at which the stock prices tend to find resistance when they are rising, and an uptrend may take a pause due to profit booking or selling interest. Resistance 1 refers to the nearby resistance level for the stock and if the price surpasses the level, then Resistance 2 may act as the crucial resistance level for the stock.
Stop-loss: It is a level to protect further losses in case of unfavourable movement in the stock prices.
Disclaimer-
This report has been issued by Kalkine Limited (Company number 07903332), a private limited company, incorporated in England and Wales ("Kalkine”). Kalkine.co.uk and associated pages are published by Kalkine. Kalkine is authorised and regulated by the Financial Conduct Authority under reference number 579414.
The information in this report and on the Kalkine website has been prepared from a wide variety of sources, which Kalkine, to the best of its knowledge and belief, considers accurate. Kalkine has made every effort to ensure the reliability of information contained in its reports, newsletters and websites. All information represents our views at the date of publication and may change without notice. The information in this report does not constitute an offer to sell securities or other financial products or a solicitation of an offer to buy securities or other financial products. Our reports contain non personalized recommendations to invest in securities and other financial products.
Kalkine does not offer financial advice based upon your personal financial situation or goals, and we shall not be held liable for any investment or trading losses you may incur by using the opinions expressed in our reports, publications, market updates, news alerts and corporate profiles. Kalkine does not intend to exclude any liability which it is not permitted to exclude under applicable law or regulation. Kalkine’s non-personalised advice does not in any way endorse or recommend individuals, investment products or services for your personal financial situation. You should discuss your portfolios and the risk tolerance level appropriate for your personal financial situation, with a professional authorised financial planner and adviser. You should be aware that the value of any investment and the income from it can go down as well as up and you may not get back the amount invested.
Please also read our Terms & Conditions for further information. Employees and/or associates of Kalkine and its related entities may hold interests in the securities or other financial products covered in this report or on the Kalkine website. Any such employees and associates are required to comply with certain safeguards, procedures and disclosures as required by law.
Kalkine Media Limited, an affiliate of Kalkine, may have received, or be entitled to receive, financial consideration in connection with providing information about certain entity(s) covered on its website including entities covered in this report.
Past performance is not a reliable indicator of future performance.

 Please wait processing your request...