
Kalkine’s Global Tariff Report delivers objective, data-driven insights into key global sectors impacted by tariff fluctuations. It assesses how these changes influence equity valuations across affected industries, with a focus on trade-sensitive sectors that often attract increased investor attention during times of tariff-related uncertainty. The report also highlights defensive and countercyclical segments that tend to show resilience—or even outperformance—amid disruptions in global trade dynamics.
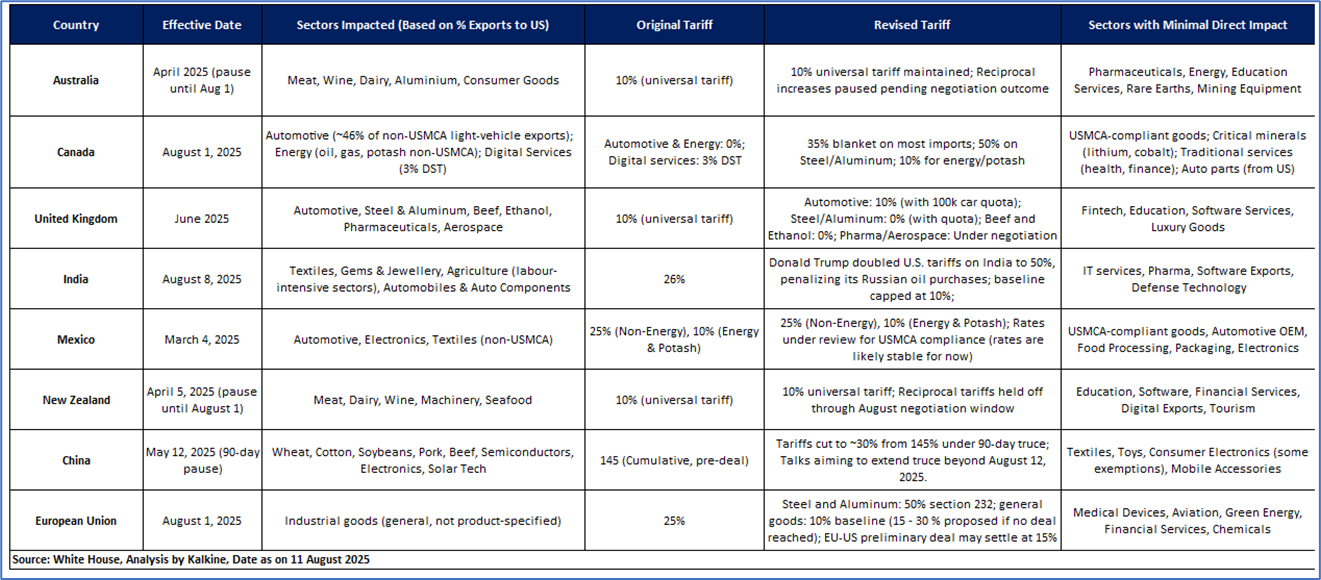
As illustrated in the table below, several key sectors in different countries are directly impacted by the recent tariff announcement from President Trump.

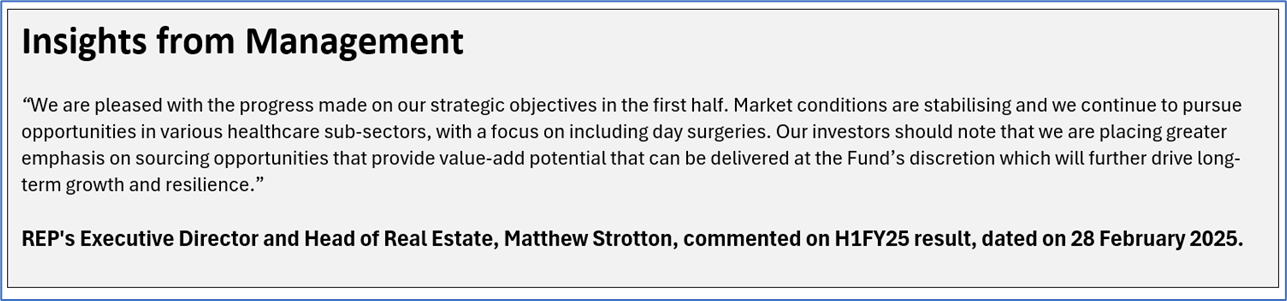
Key Highlights
On August 7, 2025, President Trump’s sweeping “reciprocal” tariffs took effect, imposing 10–50% duties on imports from 90+ countries. First announced on April 2, “Liberation Day,” the move marks a major global trade shift.
- Baseline Tariffs: A 10% minimum tariff applies to most countries, while about 40 nations with which the U.S. runs trade deficits face a 15% base rate.
- High Tariff Targets – India & Brazil: Both face 50% tariffs. India will see an added 25% duty from August 27, 2025, over its Russian oil imports. Brazil’s rate is partly tied to legal actions against ex-President Bolsonaro.
- Canada & Switzerland: Canada is hit with 35% tariffs on non-USMCA-compliant goods, citing poor cooperation on fentanyl control. Switzerland faces a 39% tariff, triggering emergency trade talks.
- China & Pharmaceuticals: China remains under a 30% tariff amid an extended trade truce (until August 12, with a possible 90-day extension). A 250% tariff on pharmaceuticals has been threatened but not enacted.
- Industry-Specific Tariffs: Steel, aluminum, and copper imports face 50% tariffs; cars and parts are taxed at 25%. Some agreements, like with the EU, cap these at lower rates (e.g., 15%).
- Major Trade Deals: The EU locked in a 15% tariff rate through a deal involving USD 750 billion in U.S. energy purchases and USD 600 billion in investments by 2028. Japan secured the same rate with a USD 550 billion U.S. investment commitment.
- Tariff Rates for Key Partners: The UK, South Korea, Vietnam, Indonesia, and the Philippines negotiated tariff rates between 10% and 20%. Mexico received a 90-day delay on new tariffs but still faces a 25% rate on non-USMCA goods.
- De Minimis Exemption Removed: As of July 30, 2025, Trump ended the global tariff exemption for shipments under USD 800, significantly affecting low-cost importers like Shein and Temu.
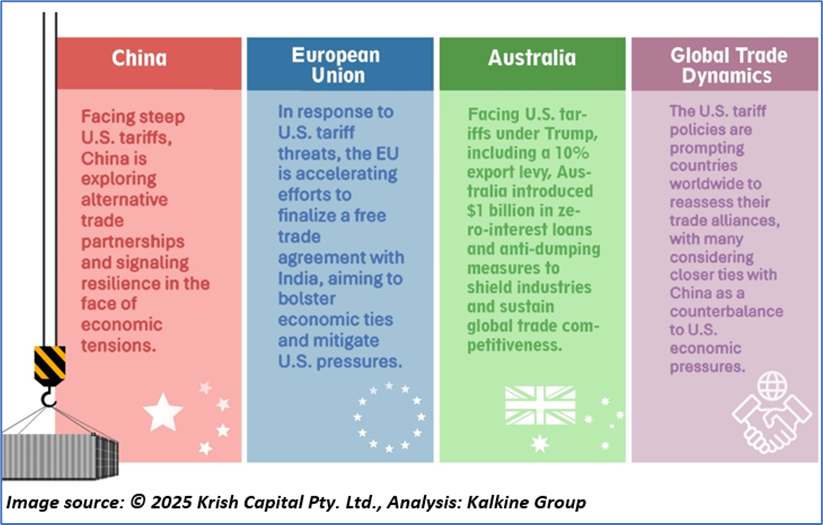
Global Implications of Tariffs

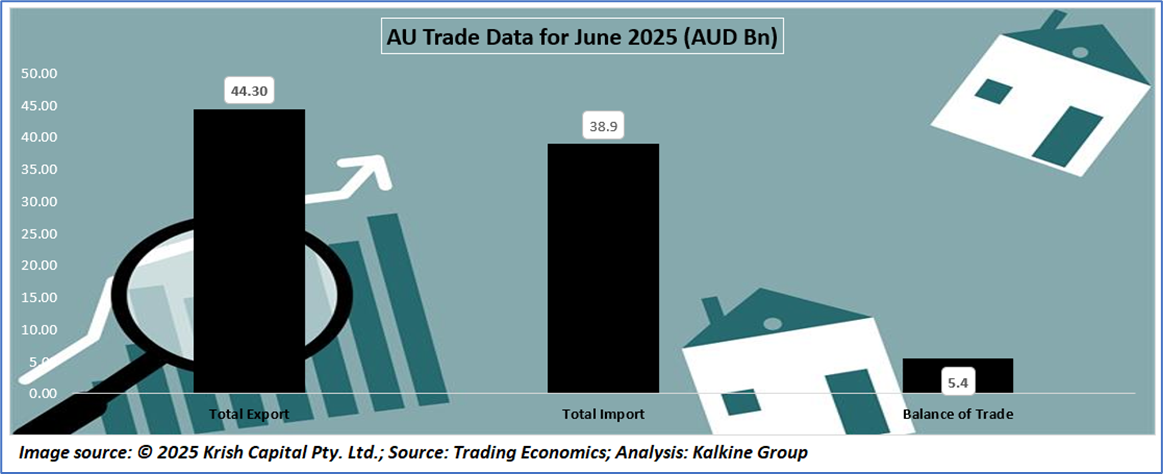
As of mid-2025, Australia's external sector indicators present a mixed economic outlook. The balance of trade showed a surplus of AUD 5.37 billion in June 2025, a significant improvement from the previous figure of AUD 1.6 billion, driven by exports of AUD 44.3 billion, surpassing imports at AUD 38.95 billion. Despite this, the current account remained in deficit at AUD -14.66 billion in March 2025, though slightly improved from AUD -16.31 billion in the previous quarter, equating to -2.1% of GDP. External debt reached a record high of AUD 2.69 trillion, reflecting ongoing borrowing needs. Terms of trade declined to 114 points from 119, suggesting less favorable trade conditions. On the capital side, capital flows decreased to AUD 6.23 billion in March, and foreign direct investment saw a notable rise to AUD 81 billion by the end of 2024. In tourism, 611,180 arrivals were recorded in May 2025, slightly down from the previous month.

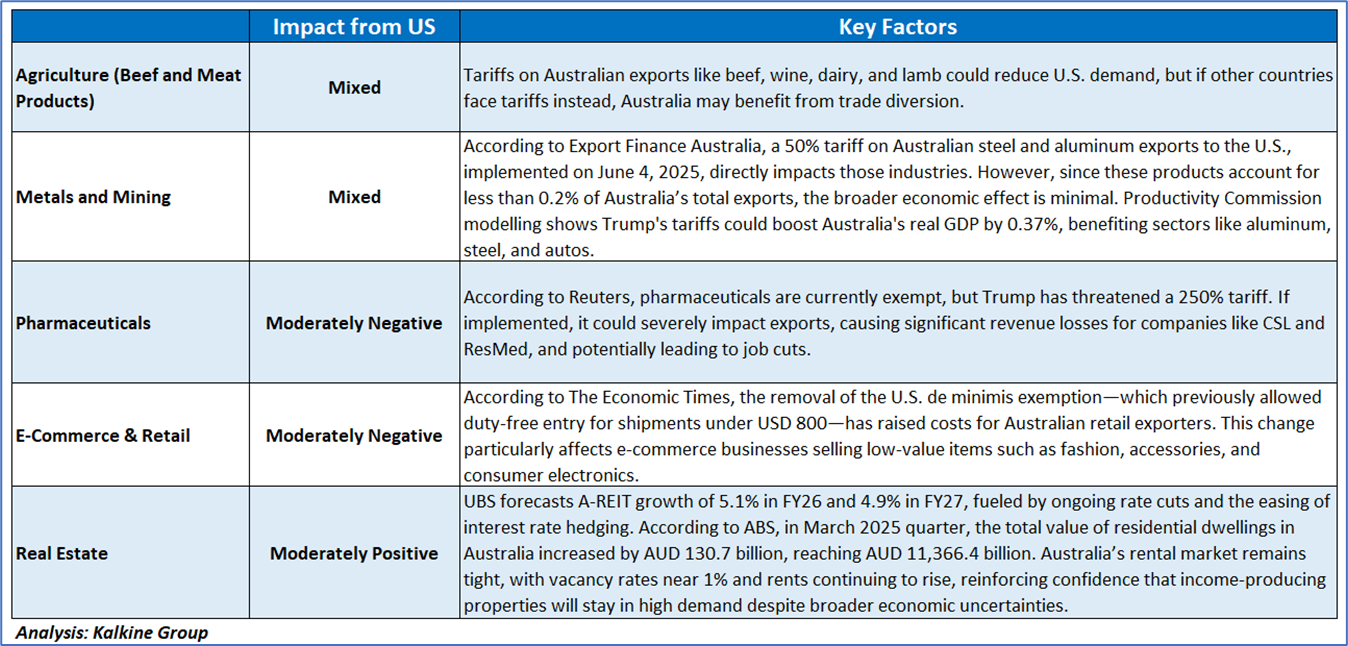
As of August 11, 2025, U.S. tariffs under President Trump—effective since April 2025—impose a 10% baseline on most Australian exports, with higher rates on metals (50%) and autos (25%). While real estate isn't directly affected, indirect impacts arise from global economic slowdown, shifting interest rates, and trade disruptions. Australia’s diversified economy and low reliance on the U.S. market (around 4% of exports) offer some resilience against tariff impacts.
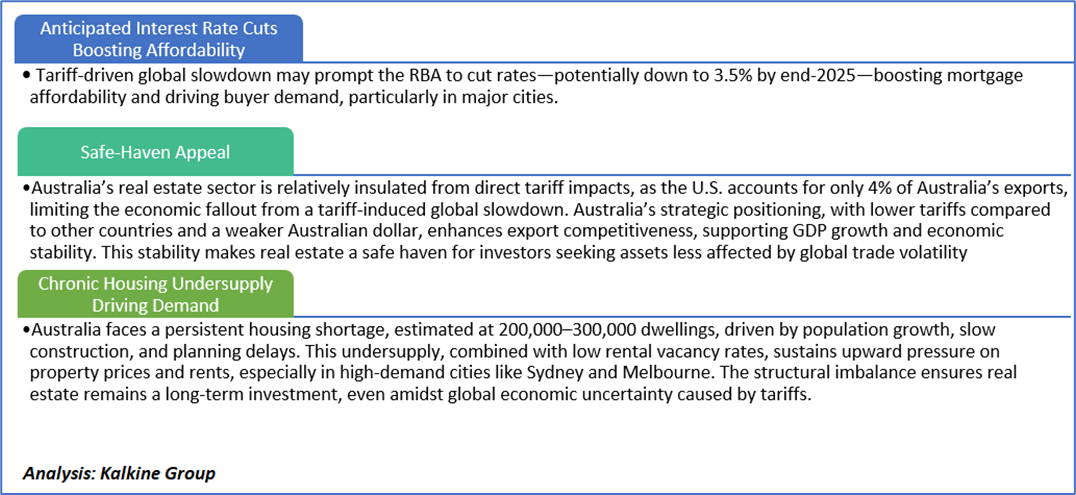
The real estate sector (including residential, commercial, and industrial segments) is expected to have varied impacts. A tariff-induced global slowdown could lead the RBA to cut rates, potentially down to 3.6% by late 2025. Lower borrowing costs are expected to enhance mortgage affordability and boost demand in key markets such as Sydney and Melbourne. Domain’s FY25–26 Price Forecast Report predicts ongoing property price growth over the next 12 months, with major capital cities leading the national trend.

The Australian Real Estate sector remains attractive despite U.S. tariff concerns due to several key factors:
Amid elevated Market Volatility and Tariff pressures, RAM Essential Services Property Fund (ASX: REP) stands out as a defensive pick within the Real Estate sector, supported by rigorous fundamental and technical research
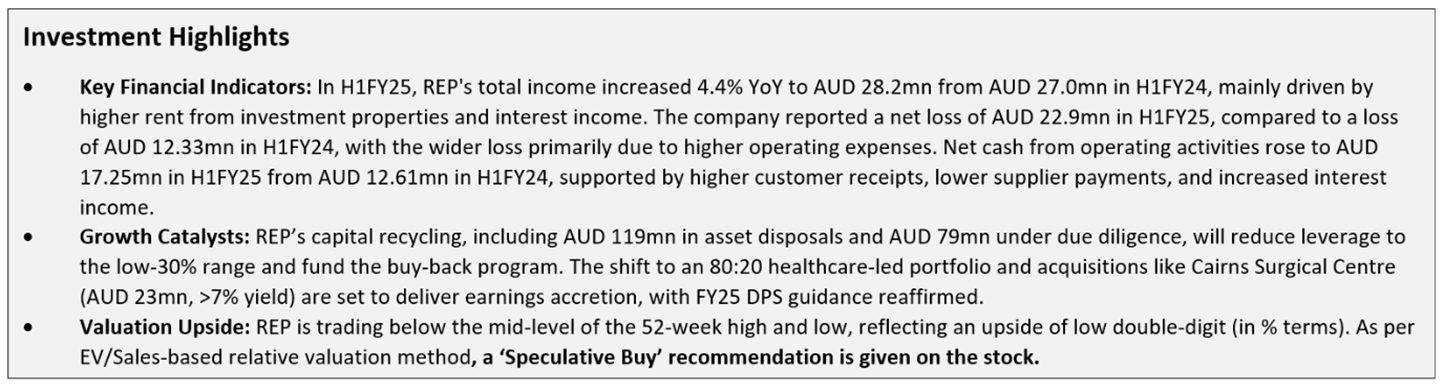
Kalkine’s Global Tariff Report covers the Investment Highlights, Key Financial Metrics, Risks, Technical Analysis along with the Valuation, Target Price, and Recommendation on the RAM Essential Services Property Fund (ASX: REP).
Section 1: Company Overview and Fundamentals Insights
Company Overview: RAM Essential Services Property Fund (ASX: REP) is an ASX-listed REIT with a diversified portfolio of medical and essential retail properties, anchored by high-quality tenants, aiming to deliver stable income and long-term growth. Kalkine’s Global Tariff Report covers the Investment Highlights, Key Financial Metrics, Risks, and Technical Analysis along with the Valuation, Target Price, and Recommendation on the stock.
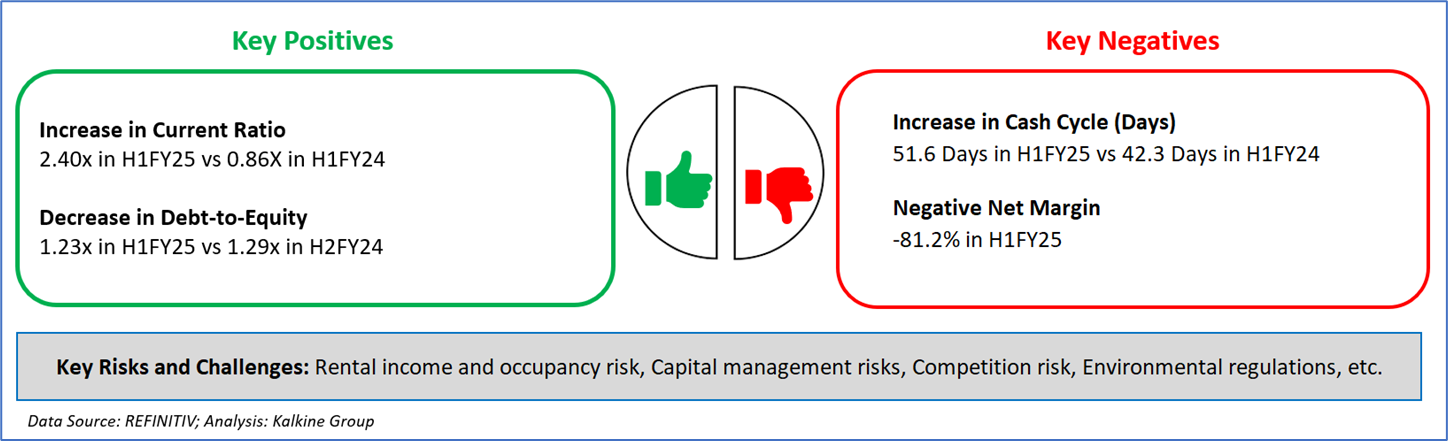
1.2 The Key Positives, Negatives, Investment Highlights, and Risks
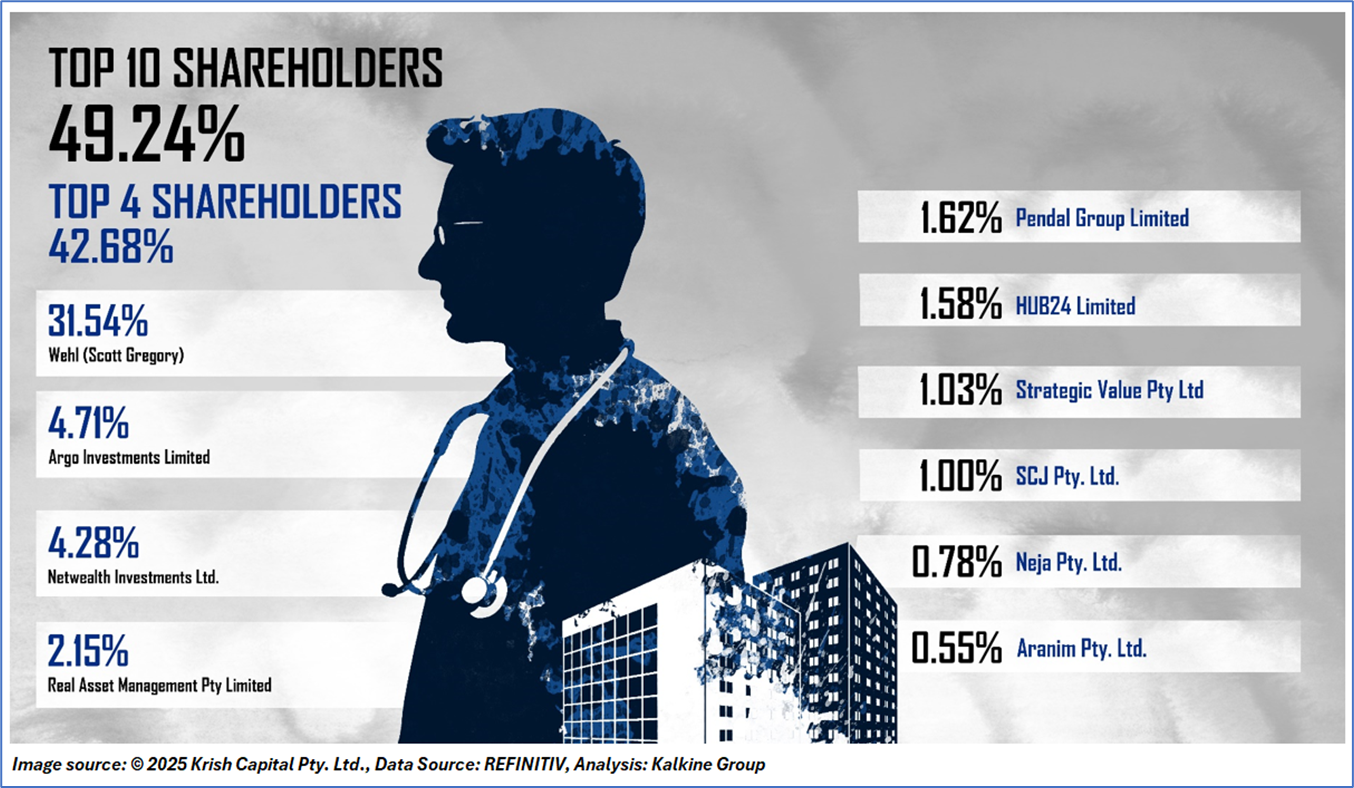
1.3 Top 10 Shareholders:
The top 10 shareholders together form ~49.24% of the total shareholding. Wehl (Scott Gregory) and Argo Investments Limited hold maximum stakes of 31.54% and 4.71%, respectively.
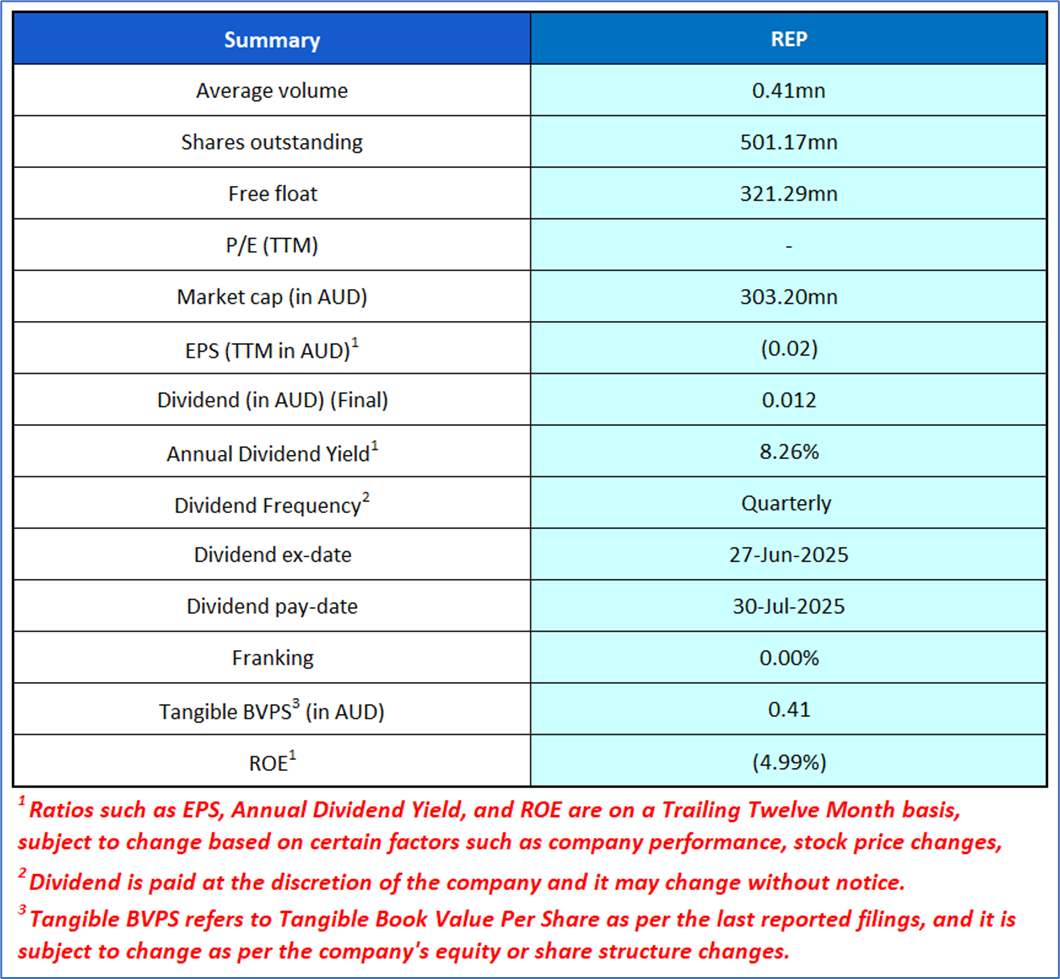
1.4 Key Metrics: REP’s current ratio increased to 2.40x in H1FY25 compared to 0.86x in H1FY24. Below is captured other metrics:
Section 2: Business Updates, Financial and Operational Highlights
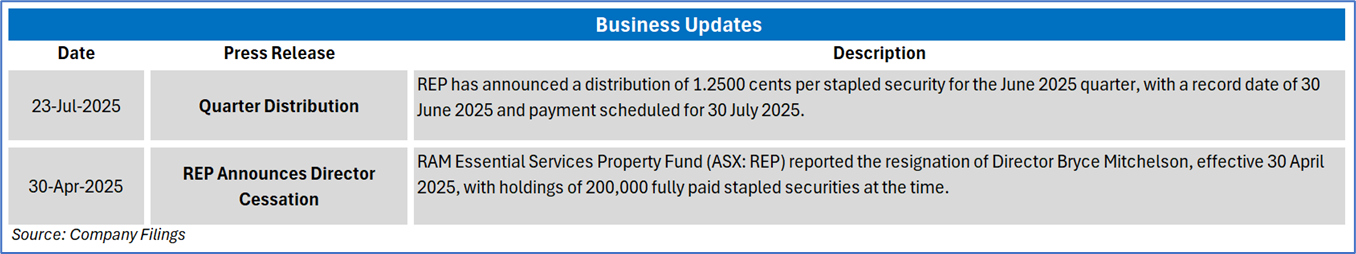
2.1 Recent Business Updates:
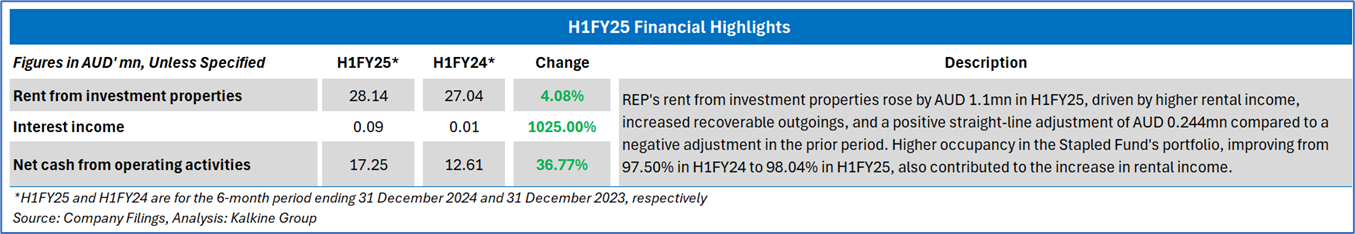
2.2 H1FY25 Results Highlights (for the 06 months ended 31 December 2024): Below mentioned are some key financial highlights:
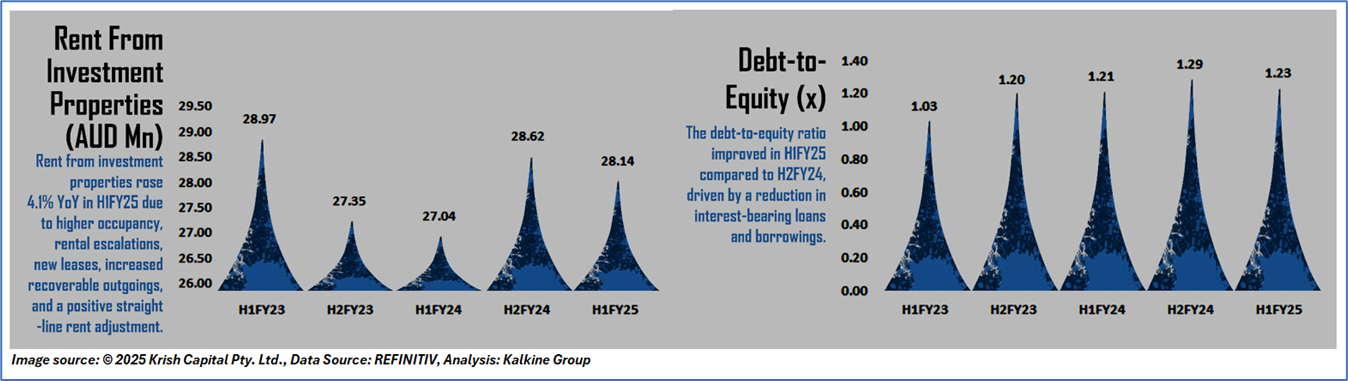
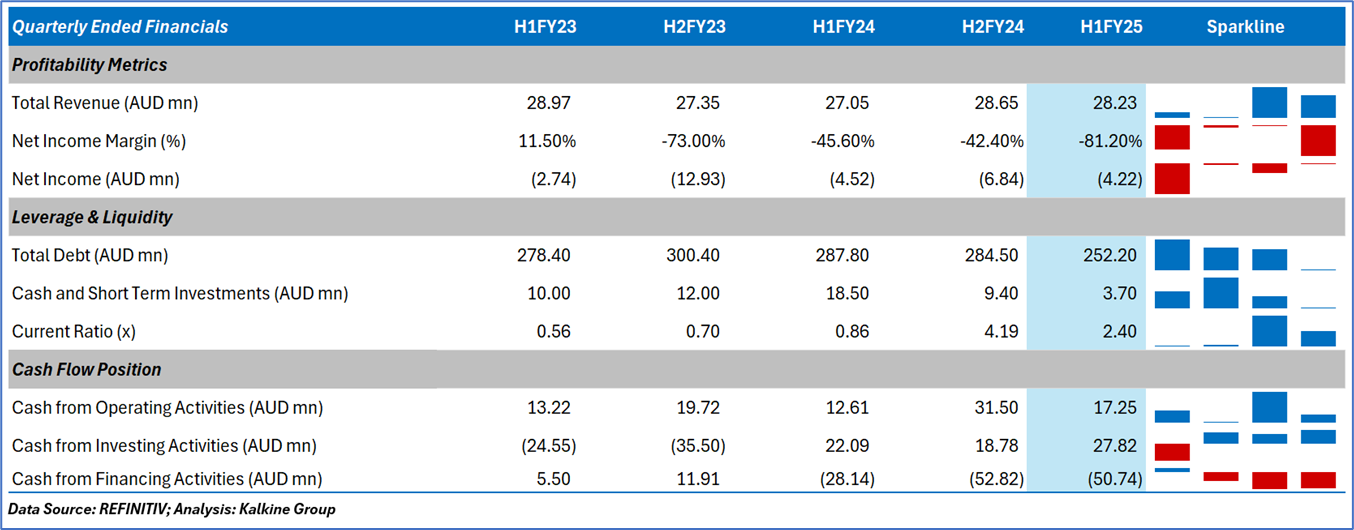
2.3 Historical Financial Trend
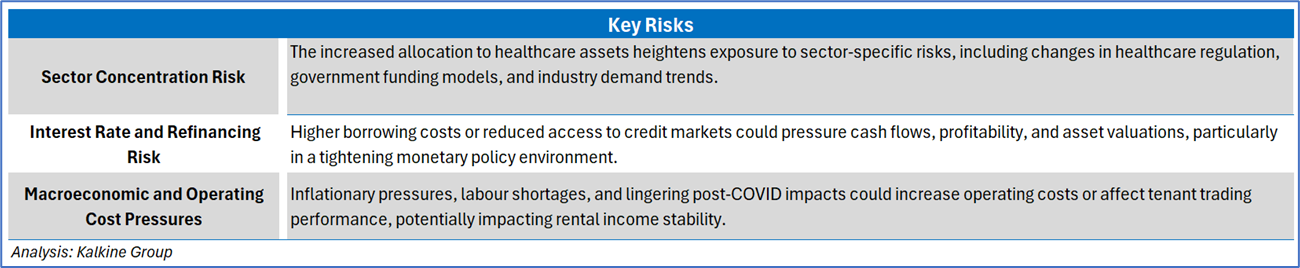
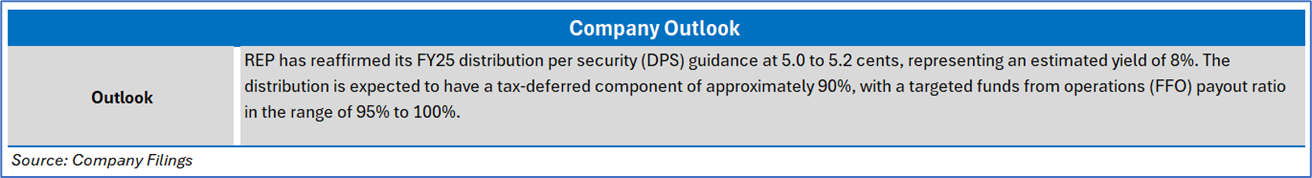
Section 3: Key Risks and Outlook:
Section 4: Stock Recommendation Summary
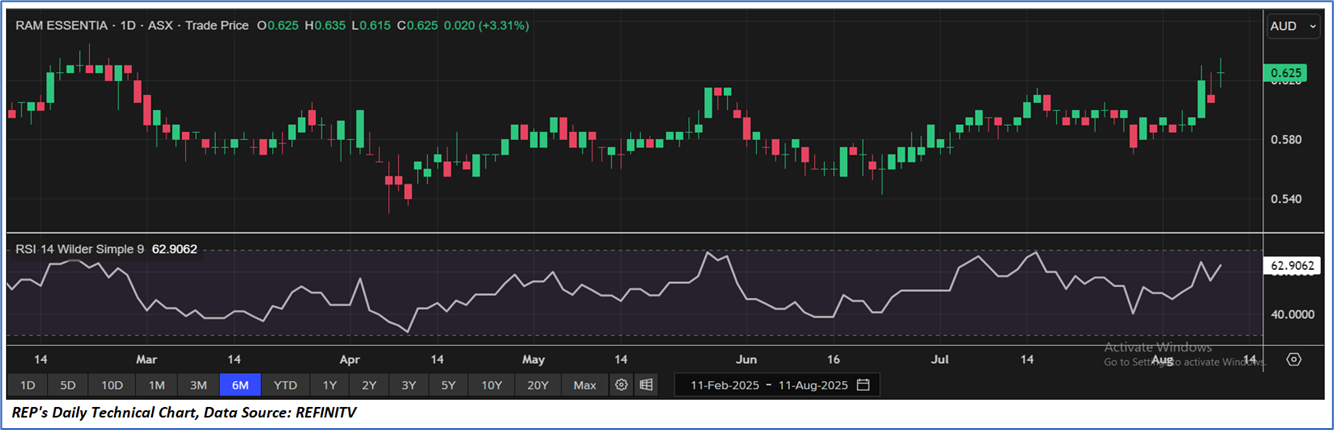
4.1 Price Performance and Technical Summary
The stock has increased by ~8.70% in the last three months, whereas over the past one year, stock has decreased by ~2.34%. The stock has a 52-week low and 52-week high of AUD 0.530 and AUD 0.725, respectively, and is currently trading below the 52-week high-low average. The REP was last covered in a report dated ‘06 February 2023’.
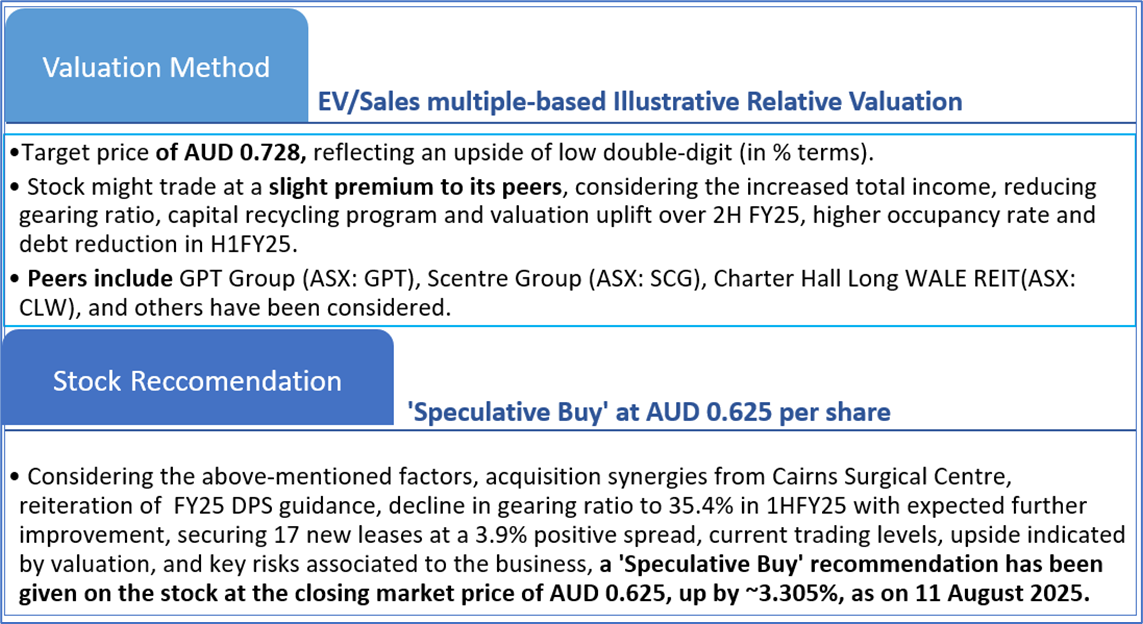
4.2 Fundamental Valuation and Stock Recommendation
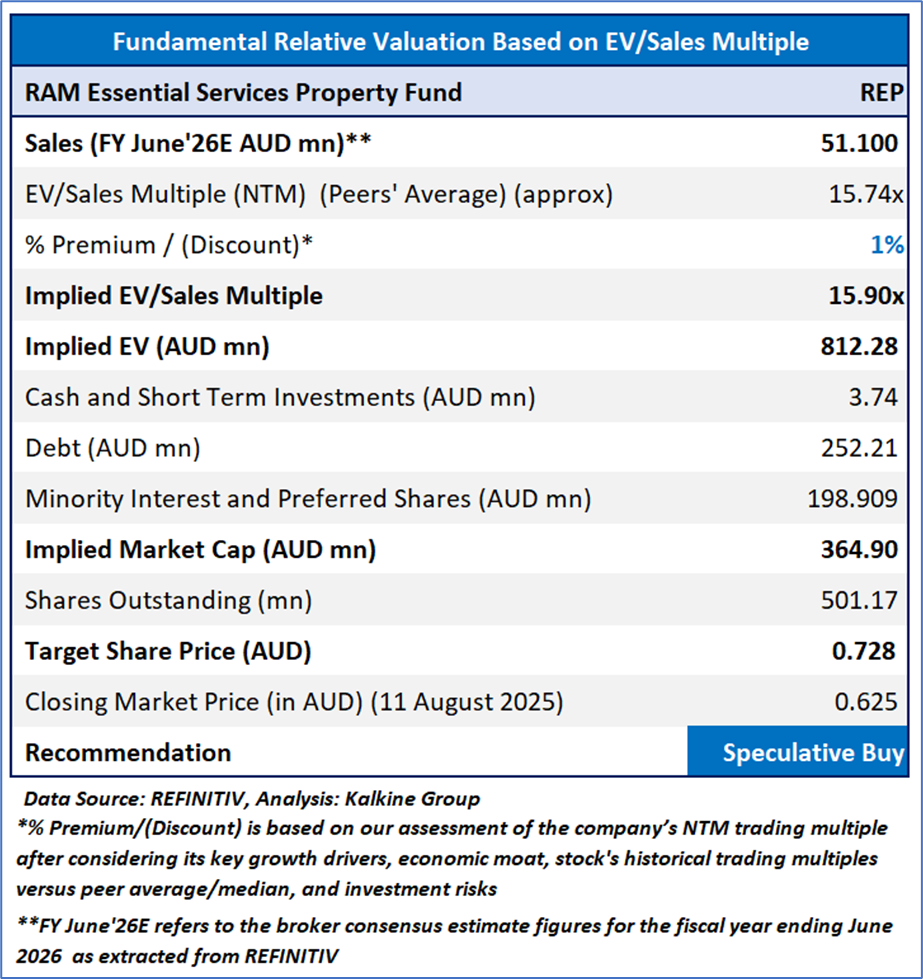
Markets are trading in a highly volatile zone currently due to certain macro-economic issues and geopolitical tensions prevailing. Therefore, it is prudent to follow a cautious approach while investing.
Note 1: Past performance is neither an indicator nor a guarantee of future performance.
Note 2: The reference date for all price data, currency, technical indicators, support, and resistance levels is 11 August 2025. The reference data in this report has been partly sourced from REFINITIV.
Note 3: Investment decisions should be made depending on an individual's appetite for upside potential, risks, holding duration, and any previous holdings. An 'Exit' from the stock can be considered if the Target Price mentioned as per the Valuation and or the technical levels provided have been achieved and is subject to the factors discussed above.
Note 4: Dividend Yield may vary as per the stock price movement.
Note 5: Kalkine reports are prepared based on the stock prices captured either from REFINITIV or Trading View. Typically, REFINITIV or Trading View may reflect stock prices with a delay which could be a lag of 25-30 minutes. There can be no assurance that future results or events will be consistent with the information provided in the report. The information is subject to change without any prior notice.
Technical Indicators Defined: -
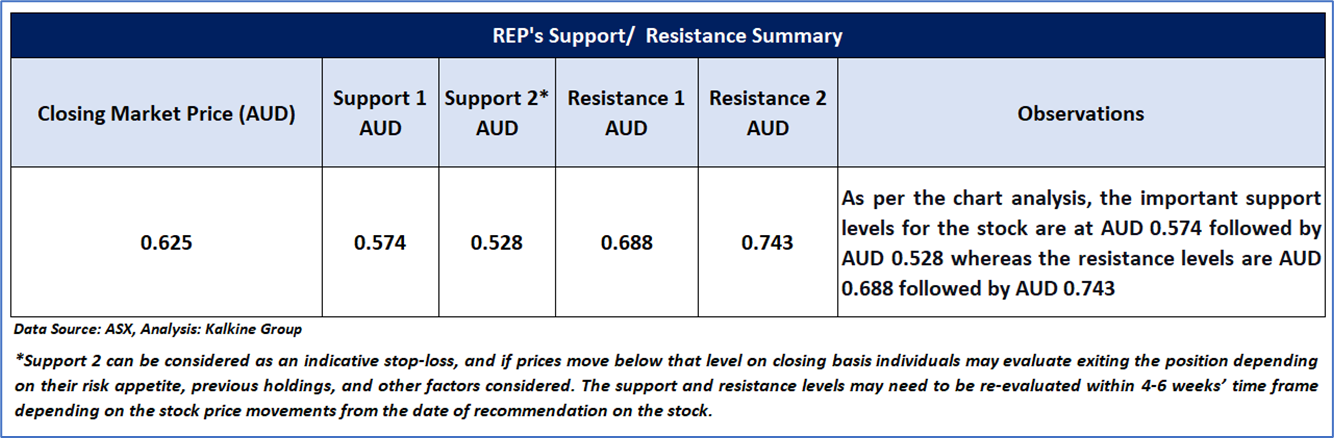
Support: A level at which the stock prices tend to find support if they are falling, and a downtrend may take a pause backed by demand or buying interest. Support 1 refers to the nearby support level for the stock and if the price breaches the level, then Support 2 may act as the crucial support level for the stock.
Resistance: A level at which the stock prices tend to find resistance when they are rising, and an uptrend may take a pause due to profit booking or selling interest. Resistance 1 refers to the nearby resistance level for the stock and if the price surpasses the level, then Resistance 2 may act as the crucial resistance level for the stock.
Stop-loss: It is a level to protect further losses in case of unfavourable movement in the stock prices.
Disclaimer-
This report has been issued by Kalkine Limited (Company number 07903332), a private limited company, incorporated in England and Wales ("Kalkine”). Kalkine.co.uk and associated pages are published by Kalkine. Kalkine is authorised and regulated by the Financial Conduct Authority under reference number 579414.
The information in this report and on the Kalkine website has been prepared from a wide variety of sources, which Kalkine, to the best of its knowledge and belief, considers accurate. Kalkine has made every effort to ensure the reliability of information contained in its reports, newsletters and websites. All information represents our views at the date of publication and may change without notice. The information in this report does not constitute an offer to sell securities or other financial products or a solicitation of an offer to buy securities or other financial products. Our reports contain non personalized recommendations to invest in securities and other financial products.
Kalkine does not offer financial advice based upon your personal financial situation or goals, and we shall not be held liable for any investment or trading losses you may incur by using the opinions expressed in our reports, publications, market updates, news alerts and corporate profiles. Kalkine does not intend to exclude any liability which it is not permitted to exclude under applicable law or regulation. Kalkine’s non-personalised advice does not in any way endorse or recommend individuals, investment products or services for your personal financial situation. You should discuss your portfolios and the risk tolerance level appropriate for your personal financial situation, with a professional authorised financial planner and adviser. You should be aware that the value of any investment and the income from it can go down as well as up and you may not get back the amount invested.
Please also read our Terms & Conditions for further information. Employees and/or associates of Kalkine and its related entities may hold interests in the securities or other financial products covered in this report or on the Kalkine website. Any such employees and associates are required to comply with certain safeguards, procedures and disclosures as required by law.
Kalkine Media Limited, an affiliate of Kalkine, may have received, or be entitled to receive, financial consideration in connection with providing information about certain entity(s) covered on its website including entities covered in this report.
Past performance is not a reliable indicator of future performance.

 Please wait processing your request...