Section 1: Company Overview and Fundamentals
1.1 Company Overview:
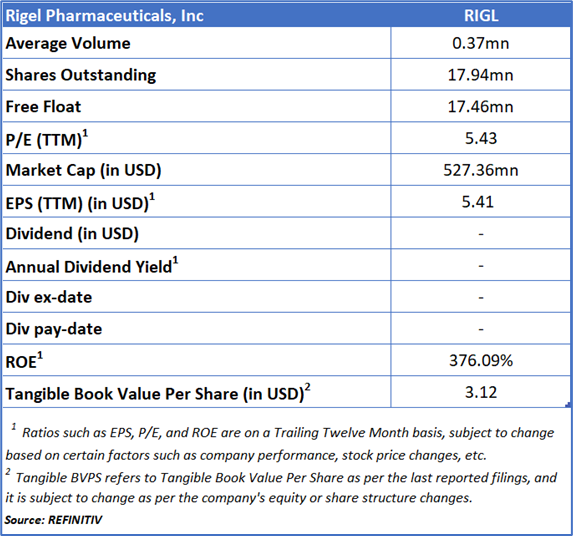
Rigel Pharmaceuticals, Inc (NASDAQ: RIGL) is a biotechnology firm dedicated to developing innovative therapies aimed at enhancing the quality of life for patients suffering from hematologic disorders and cancer. The company concentrates on advancing products that target key signaling pathways essential to the underlying mechanisms of these diseases.
Kalkine’s Diversified Opportunities Report covers the Company Overview, Key positives & negatives, Investment summary, Key investment metrics, Top 10 shareholding, Business updates and insights into company recent financial results, Key Risks & Outlook, Price performance and technical summary, Target Price, and Recommendation on the stock.
Stock Performance:
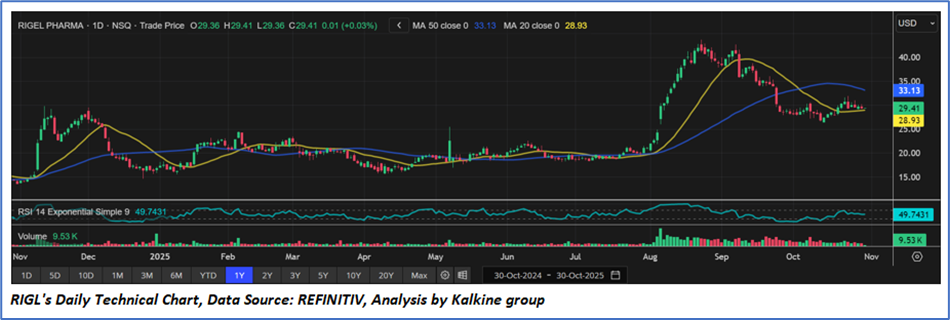
- Rigel Pharmaceuticals has experienced a strong bullish run since mid-July 2025, with prices surging from around USD 20 to a peak near USD 40 in early September. However, the stock has since undergone a correction phase, currently consolidating around the USD 29-30 range.
- The 20-day moving average (MA 20 = USD 28.93) is slightly below the current price, indicating short-term support. Meanwhile, the 50-day moving average (MA 50 = USD 33.13) is trending above the price, suggesting medium-term resistance.
- The Relative Strength Index (RSI = 49.74) is neutral, hovering around the midpoint of 50, suggesting a balanced momentum with neither overbought nor oversold conditions.
- Volume activity has tapered off since the early September rally, implying that recent price movements lack strong conviction from traders. A volume uptick on a breakout above resistance would confirm renewed buying interest.
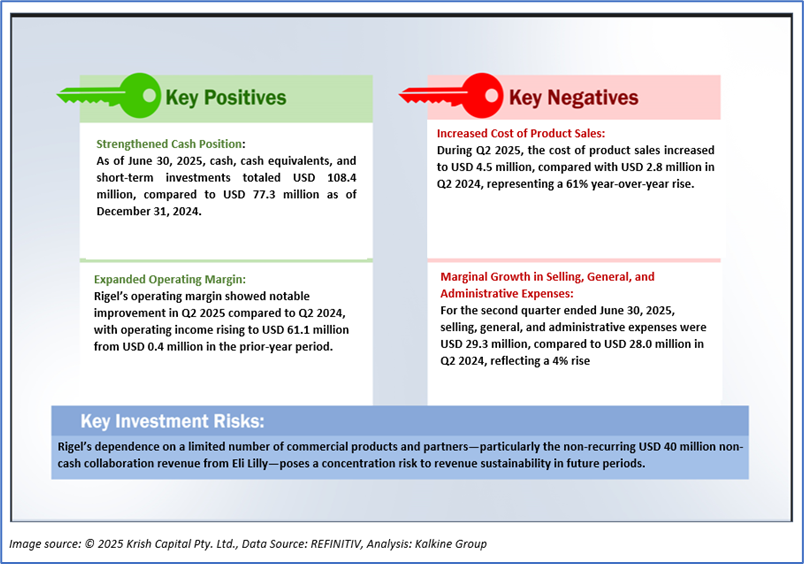
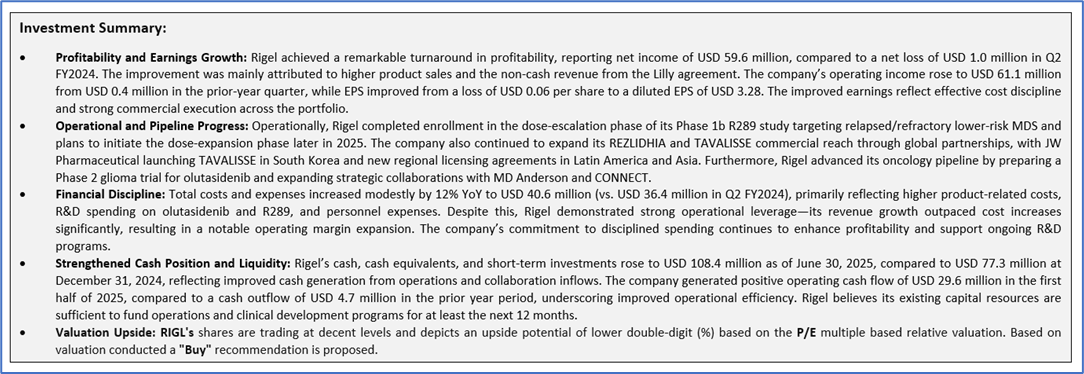
1.2 The Key Positives, Negatives, and Investment summary
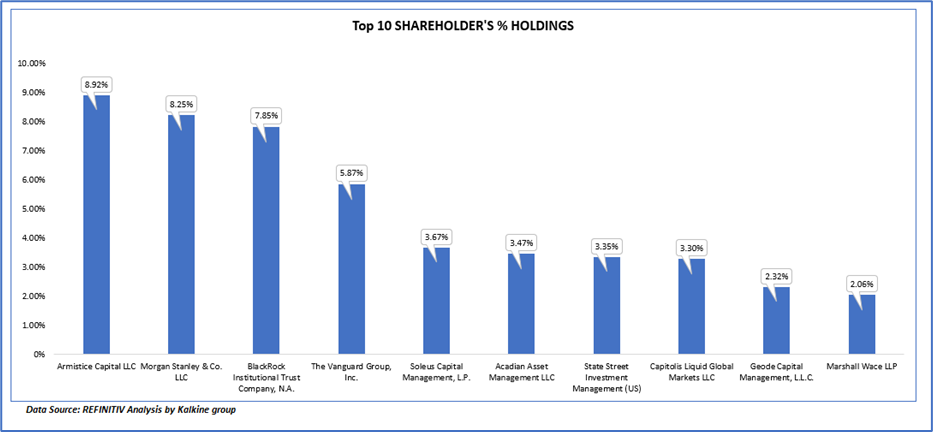
1.3 Top 10 shareholders:
The top 10 shareholders together form ~ 49.04% of the total shareholding, signifying concentrated shareholding. Armistice Capital LLC and Morgan Stanley & Co. LLC are the biggest shareholders, holding the maximum stake in the company at 8.92% and 8.25%, respectively.
1.4 Key Metrics:
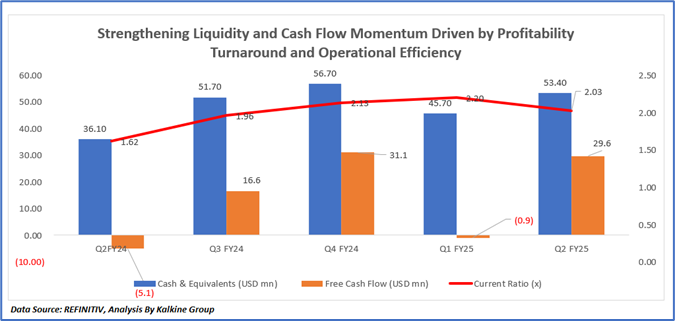
The graph illustrates Rigel Pharmaceuticals’ notable financial improvement from Q2 FY2024 to Q2 FY2025, marked by consistent strengthening in liquidity, free cash flow, and short-term solvency. Cash and equivalents rose steadily from USD 36.1 million in Q2 FY2024 to USD 53.4 million in Q2 FY2025, reflecting higher operating inflows driven by a 176% year-over-year increase in total revenue and a 76% rise in net product sales. The sharp improvement in free cash flow—from a negative USD 5.1 million in Q2 FY2024 to a positive USD 29.6 million in Q2 FY2025—was primarily attributed to strong earnings growth, operational efficiency, and the USD 40 million non-cash revenue recognized from the company’s collaboration with Eli Lilly. Meanwhile, the current ratio improved from 1.62x to 2.03x over the same period, indicating enhanced liquidity and balance sheet strength. The brief dip in cash and ratio levels in Q1 FY2025 reflected timing differences in receivables and working capital adjustments, which subsequently normalized by Q2. Overall, the trend underscores Rigel’s transformation from a loss-making, cash-consuming position to a profitable and cash-generating phase, supported by disciplined cost management, expanding product sales, and strategic collaboration revenues.
Section 2: Business Updates and Corporate Business Highlights
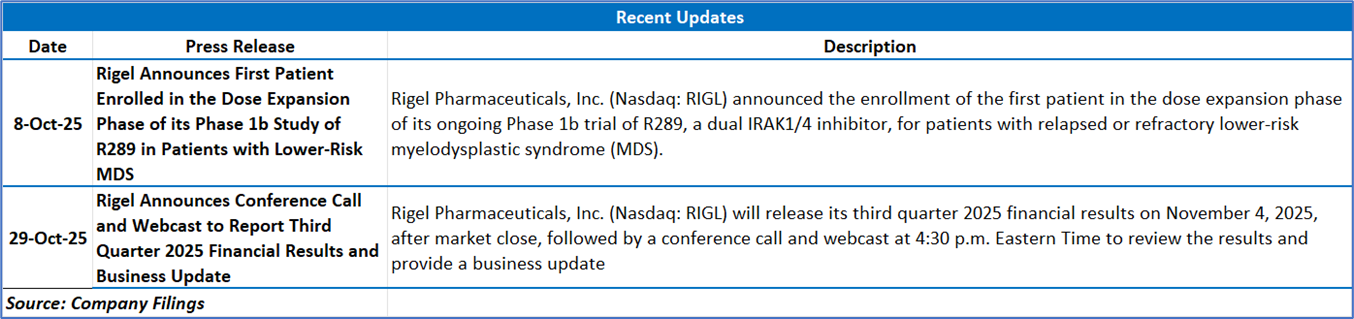
2.1 Recent Business Updates
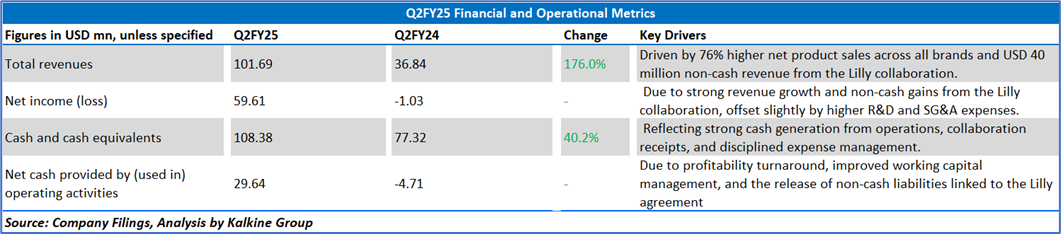
2.2 Insights of Q2FY25:
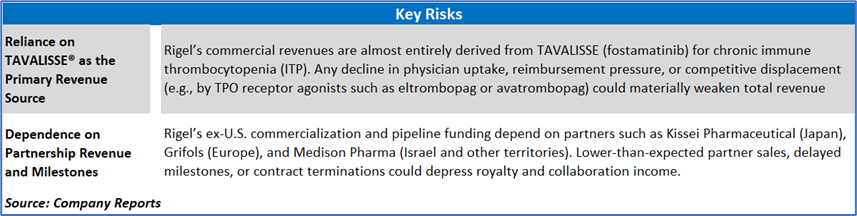
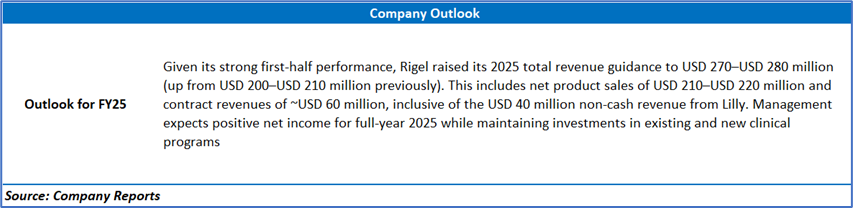
Section 3: Key Risks & Outlook
Section 4: Stock Recommendation Summary:
4.1 Price Performance and Technical Summary:
Stock Performance:
- Rigel Pharmaceuticals has experienced a strong bullish run since mid-July 2025, with prices surging from around USD 20 to a peak near USD 40 in early September. However, the stock has since undergone a correction phase, currently consolidating around the USD 29-30 range.
- The 20-day moving average (MA 20 = USD 28.93) is slightly below the current price, indicating short-term support. Meanwhile, the 50-day moving average (MA 50 = USD 33.13) is trending above the price, suggesting medium-term resistance.
- The Relative Strength Index (RSI = 49.74) is neutral, hovering around the midpoint of 50, suggesting a balanced momentum with neither overbought nor oversold conditions.
- Volume activity has tapered off since the early September rally, implying that recent price movements lack strong conviction from traders. A volume uptick on a breakout above resistance would confirm renewed buying interest.
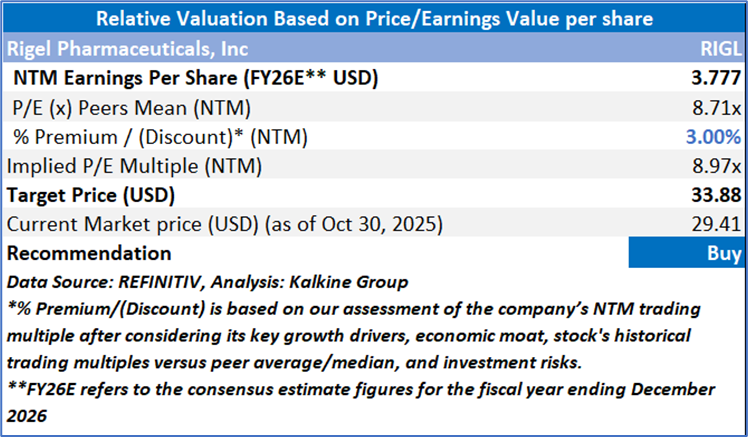
4.2 Fundamental Valuation
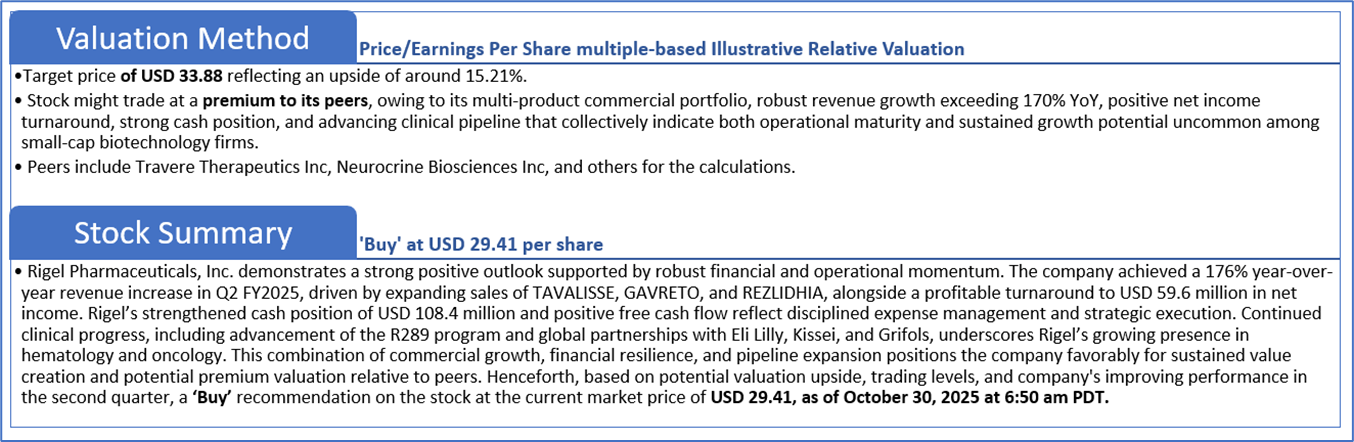
Valuation Methodology: Price/Earnings Multiple Based Relative Valuation
Markets are trading in a highly volatile zone currently due to certain macroeconomic issues and geopolitical tensions prevailing. Therefore, it is prudent to follow a cautious approach while investing.
Note 1: Past performance is not a reliable indicator of future performance.
Note 2: The reference date for all price data, currency, technical indicators, support, and resistance levels is October 30, 2025. The reference data in this report has been partly sourced from REFINITIV.
Note 3: Investment decisions should be made depending on an individual's appetite for upside potential, risks, holding duration, and any previous holdings. An 'Exit' from the stock can be considered if the Target Price mentioned as per the Valuation and or the technical levels provided has been achieved and is subject to the factors discussed above.
Note 4: The report publishing date is as per the Pacific Time Zone.
Technical Indicators Defined: -
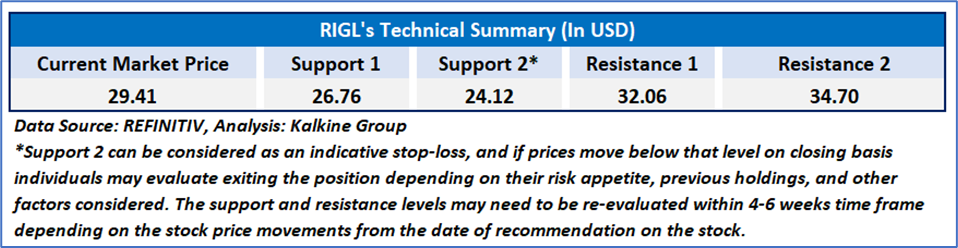
Support: A level at which the stock prices tend to find support if they are falling, and a downtrend may take a pause backed by demand or buying interest. Support 1 refers to the nearby support level for the stock and if the price breaches the level, then Support 2 may act as the crucial support level for the stock.
Resistance: A level at which the stock prices tend to find resistance when they are rising, and an uptrend may take a pause due to profit booking or selling interest. Resistance 1 refers to the nearby resistance level for the stock and if the price surpasses the level, then Resistance 2 may act as the crucial resistance level for the stock.
Stop-loss: It is a level to protect against further losses in case of unfavorable movement in the stock prices.
Disclaimer-
This report has been issued by Kalkine Limited (Company number 07903332), a private limited company, incorporated in England and Wales ("Kalkine”). Kalkine.co.uk and associated pages are published by Kalkine. Kalkine is authorised and regulated by the Financial Conduct Authority under reference number 579414.
The information in this report and on the Kalkine website has been prepared from a wide variety of sources, which Kalkine, to the best of its knowledge and belief, considers accurate. Kalkine has made every effort to ensure the reliability of information contained in its reports, newsletters and websites. All information represents our views at the date of publication and may change without notice. The information in this report does not constitute an offer to sell securities or other financial products or a solicitation of an offer to buy securities or other financial products. Our reports contain non personalized recommendations to invest in securities and other financial products.
Kalkine does not offer financial advice based upon your personal financial situation or goals, and we shall not be held liable for any investment or trading losses you may incur by using the opinions expressed in our reports, publications, market updates, news alerts and corporate profiles. Kalkine does not intend to exclude any liability which it is not permitted to exclude under applicable law or regulation. Kalkine’s non-personalised advice does not in any way endorse or recommend individuals, investment products or services for your personal financial situation. You should discuss your portfolios and the risk tolerance level appropriate for your personal financial situation, with a professional authorised financial planner and adviser. You should be aware that the value of any investment and the income from it can go down as well as up and you may not get back the amount invested.
Please also read our Terms & Conditions for further information. Employees and/or associates of Kalkine and its related entities may hold interests in the securities or other financial products covered in this report or on the Kalkine website. Any such employees and associates are required to comply with certain safeguards, procedures and disclosures as required by law.
Kalkine Media Limited, an affiliate of Kalkine, may have received, or be entitled to receive, financial consideration in connection with providing information about certain entity(s) covered on its website including entities covered in this report.
Past performance is not a reliable indicator of future performance.

 Please wait processing your request...