Section 1: Company Overview and Fundamentals
1.1 Company Overview:
Shutterstock, Inc (NYSE: SSTK) operates a global creative platform that connects businesses and brands with high-quality digital content. The company delivers its content through a portfolio of brands, including Shutterstock, Pond5, TurboSquid, PicMonkey, PremiumBeat, Splash News, Bigstock, and Offset. The flagship Shutterstock brand offers a diverse range of content, including images, videos, music, and editorial material. Pond5, a video-centric marketplace, enhances the company's offerings by focusing primarily on video content while also providing images and music.
Kalkine’s Dividend Income Report covers the Company Overview, Key positives & negatives, Investment summary, Key investment metrics, Top 10 shareholding, Business updates and insights into company recent financial results, Key Risks & Outlook, Price performance and technical summary, Target Price, and Recommendation on the stock.
Price Performance:
- The 21-day EMA has crossed above the 50-day SMA, which can be interpreted as a bullish crossover, potentially marking a short-term trend reversal. Price is currently above both moving averages, reinforcing near-term bullish sentiment.
- RSI (14) stands at 57.89, which is in the neutral-to-bullish range. It's approaching the 60–70 zone, which could indicate strengthening momentum, but not yet overbought.
- Volume appears modestly elevated during recent upward moves, indicating accumulation. The spike in volume on up days (notably in May) supports the bullish breakout.
- The stock had been in a clear downtrend from mid-2024 through early 2025, marked by lower highs and lower lows, however, a potential trend reversal is forming. The recent price action shows a break above both the 21-day EMA (18.45) and the 50-day SMA (17.37), a bullish signal suggesting upward momentum.

1.2 The Key Positives, Negatives, and Investment summary


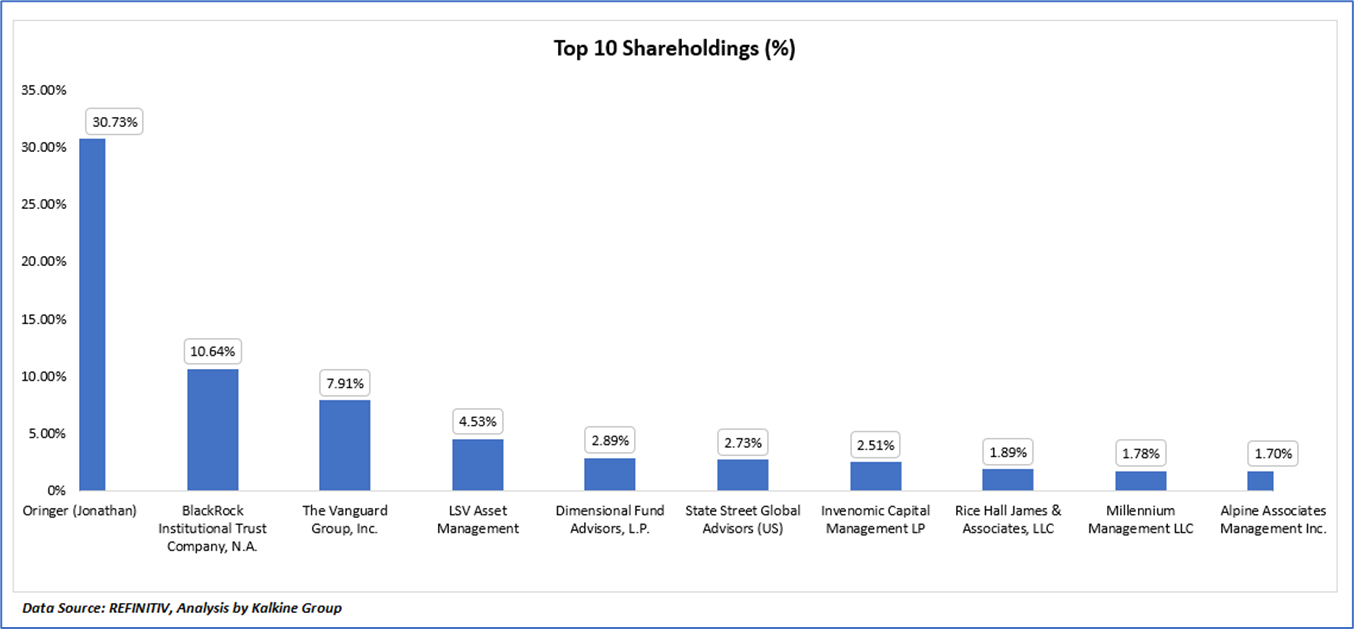
1.3 Top 10 shareholders:
The top 10 shareholders together form ~67.30% of the total shareholding, signifying concentrated shareholding. Oringer (Jonathan) and BlackRock Institutional Trust Company, N.A. are the biggest shareholders, holding the maximum stake in the company at ~30.73% and ~10.64%, respectively.
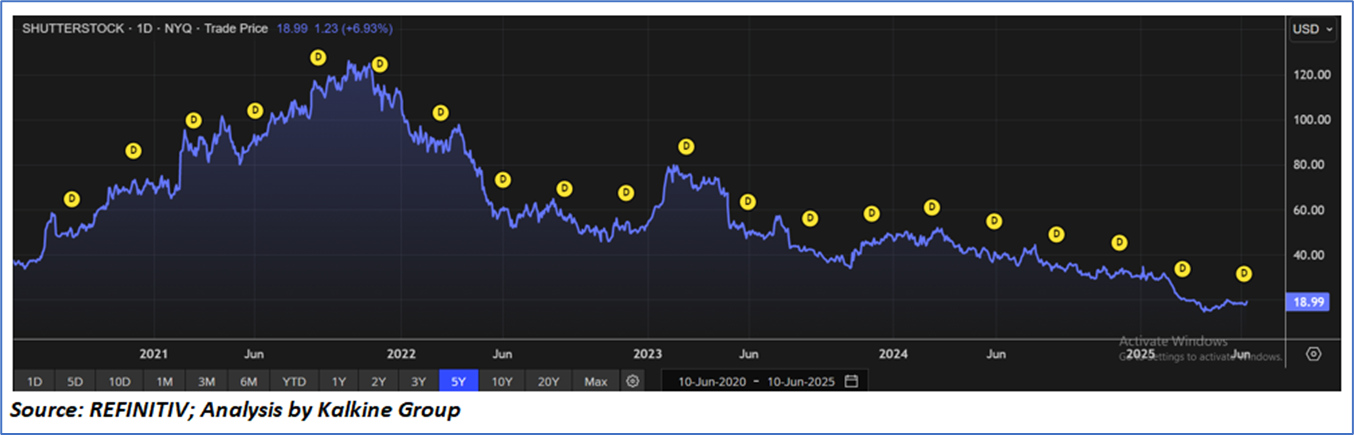
1.4 Dividend payments with impressive dividend yield:
Over the past five years, Shutterstock Inc. has demonstrated a consistent commitment to returning value to shareholders through regular quarterly dividend payments, as indicated by the uninterrupted series of dividends on the chart. This pattern has held steady despite a significant and prolonged decline in the company’s stock price—from a peak of over USD 120 in late 2021 to approximately USD 19 by mid-2025. The consistency in dividends, without any visible cuts or suspensions, suggests that Shutterstock either maintained adequate cash flows or prioritized its dividend policy even during challenging periods. While this may appeal to income-focused investors, it also raises concerns about the long-term sustainability of such payouts if the company’s underlying financial performance and stock trajectory continue to deteriorate. Maintaining dividends in a weakening market environment could potentially strain resources or limit future flexibility.
1.5 Key Metrics
The chart displays the group's quarterly revenue and gross profit (in USD million) from Q1 FY24 to Q1 FY25. Revenue showed a general upward trend from USD 214.3 million in Q1 FY24 to a peak of USD 250.6 million in Q3 FY24, followed by a slight dip to USD 242.6 million in Q1 FY25. The growth is attributed to strong performance in its Content product offering, which grew by USD 29.1 million (17%), accounting for 84% of total revenue. Gross profit followed a similar pattern, increasing from USD 126.1 million in Q1 FY24 to USD 146.0 million in Q3 FY24, then dipping in Q4 FY24 before slightly recovering to USD 141.7 million in Q1 FY25. The profitability is driven by strong revenue growth, especially from the Content product offering, which grew 17% y-o-y and contributed significantly to total revenue. The acquisition of Envato in July 2024 also positively impacted profitability, enhancing gross profit. However, these gains were partially offset by a 2% decline in revenue from the Data, Distribution, and Services segment and a 1% unfavorable impact from foreign currency fluctuations.

Section 2: Business Updates and Financial Highlights
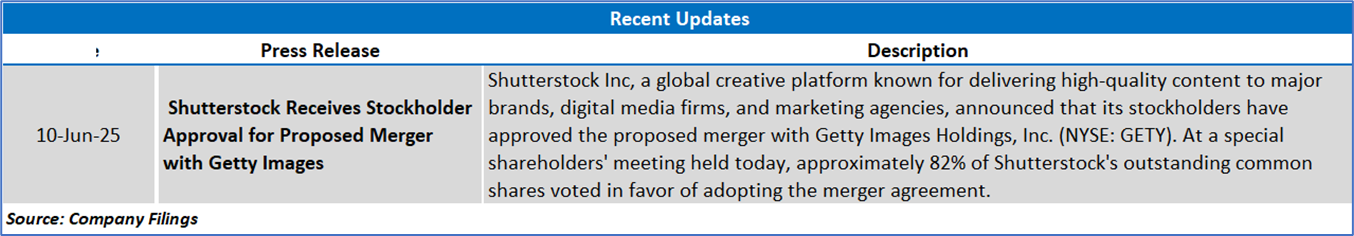
2.1 Recent Updates:
The below picture gives an overview of the recent updates:
2.2 Insights of Q1 FY25:

Section 3: Key Risks and Outlook:

Section 4: Stock Recommendation Summary:
4.1 Technical Summary:
Price Performance:
- The 21-day EMA has crossed above the 50-day SMA, which can be interpreted as a bullish crossover, potentially marking a short-term trend reversal. Price is currently above both moving averages, reinforcing near-term bullish sentiment.
- RSI (14) stands at 57.89, which is in the neutral-to-bullish range. It's approaching the 60–70 zone, which could indicate strengthening momentum, but not yet overbought.
- Volume appears modestly elevated during recent upward moves, indicating accumulation. The spike in volume on up days (notably in May) supports the bullish breakout.
- The stock had been in a clear downtrend from mid-2024 through early 2025, marked by lower highs and lower lows, however, a potential trend reversal is forming. The recent price action shows a break above both the 21-day EMA (18.45) and the 50-day SMA (17.37), a bullish signal suggesting upward momentum.


4.2 Fundamental Valuation
Valuation Methodology: Price/Earnings Per Share Multiple Based Relative Valuation


Markets are trading in a highly volatile zone currently due to certain macroeconomic issues and geopolitical tensions prevailing. Therefore, it is prudent to follow a cautious approach while investing.
Note 1: Past performance is not a reliable indicator of future performance.
Note 2: The reference date for all price data, currency, technical indicators, support, and resistance levels is June 10, 2024. The reference data in this report has been partly sourced from REFINITIV.
Note 3: Investment decisions should be made depending on an individual's appetite for upside potential, risks, holding duration, and any previous holdings. An 'Exit' from the stock can be considered if the Target Price mentioned as per the Valuation and or the technical levels provided has been achieved and is subject to the factors discussed above.
Note 4: The report publishing date is as per the Pacific Time Zone.
Technical Indicators Defined: -
Support: A level at which the stock prices tend to find support if they are falling, and a downtrend may take a pause backed by demand or buying interest. Support 1 refers to the nearby support level for the stock and if the price breaches the level, then Support 2 may act as the crucial support level for the stock.
Resistance: A level at which the stock prices tend to find resistance when they are rising, and an uptrend may take a pause due to profit booking or selling interest. Resistance 1 refers to the nearby resistance level for the stock and if the price surpasses the level, then Resistance 2 may act as the crucial resistance level for the stock.
Stop-loss: It is a level to protect against further losses in case of unfavorable movement in the stock prices.
Disclaimer-
This report has been issued by Kalkine Limited (Company number 07903332), a private limited company, incorporated in England and Wales ("Kalkine”). Kalkine.co.uk and associated pages are published by Kalkine. Kalkine is authorised and regulated by the Financial Conduct Authority under reference number 579414.
The information in this report and on the Kalkine website has been prepared from a wide variety of sources, which Kalkine, to the best of its knowledge and belief, considers accurate. Kalkine has made every effort to ensure the reliability of information contained in its reports, newsletters and websites. All information represents our views at the date of publication and may change without notice. The information in this report does not constitute an offer to sell securities or other financial products or a solicitation of an offer to buy securities or other financial products. Our reports contain non personalized recommendations to invest in securities and other financial products.
Kalkine does not offer financial advice based upon your personal financial situation or goals, and we shall not be held liable for any investment or trading losses you may incur by using the opinions expressed in our reports, publications, market updates, news alerts and corporate profiles. Kalkine does not intend to exclude any liability which it is not permitted to exclude under applicable law or regulation. Kalkine’s non-personalised advice does not in any way endorse or recommend individuals, investment products or services for your personal financial situation. You should discuss your portfolios and the risk tolerance level appropriate for your personal financial situation, with a professional authorised financial planner and adviser. You should be aware that the value of any investment and the income from it can go down as well as up and you may not get back the amount invested.
Please also read our Terms & Conditions for further information. Employees and/or associates of Kalkine and its related entities may hold interests in the securities or other financial products covered in this report or on the Kalkine website. Any such employees and associates are required to comply with certain safeguards, procedures and disclosures as required by law.
Kalkine Media Limited, an affiliate of Kalkine, may have received, or be entitled to receive, financial consideration in connection with providing information about certain entity(s) covered on its website including entities covered in this report.
Past performance is not a reliable indicator of future performance.
 Please wait processing your request...