Section 1: Company Overview and Fundamentals
1.1 Company Overview:
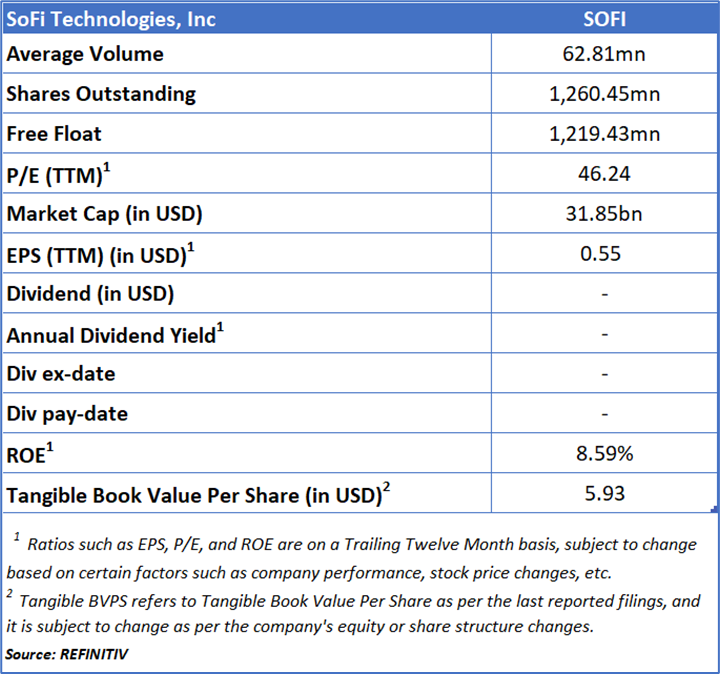
SoFi Technologies Inc (NASDAQ: SOFI) operates as a member-focused, integrated digital financial services platform. Through its lending and financial services offerings, the company enables members to borrow, save, spend, invest, and safeguard their finances. Its operations are organized across three segments: Lending, Technology Platform, and Financial Services.
Kalkine’s Diversified Opportunities Report covers the Company Overview, Key positives & negatives, Investment summary, Key investment metrics, Top 10 shareholding, Business updates and insights into company recent financial results, Key Risks & Outlook, Price performance and technical summary, Target Price, and Recommendation on the stock.
Stock Performance:
- After a strong multi-month rally, the stock has transitioned into a consolidation phase marked by lower highs, indicating fading upside momentum.
- The share price is trading below both the 20-day (USD 27.47) and 50-day (USD 28.2) moving averages, reflecting short-term technical weakness.
- Trading volumes have moderated compared with the advance phase, pointing to reduced buying conviction at higher price levels.
- RSI is near the low-30s, close to oversold territory, confirming bearish momentum while also limiting immediate downside risk.
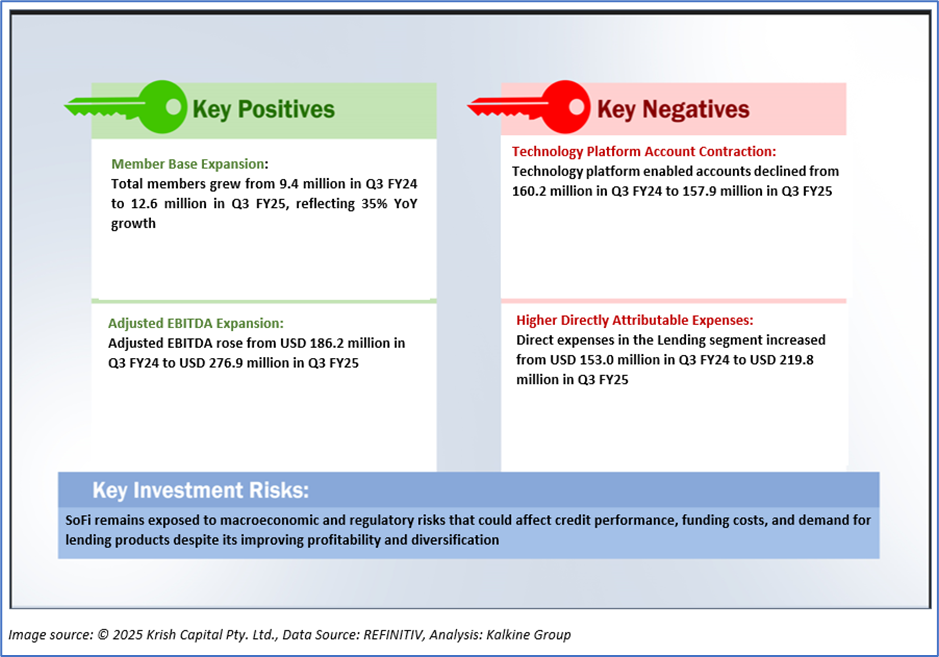
1.2 The Key Positives, Negatives, and Investment summary
1.3 Top 10 shareholders:
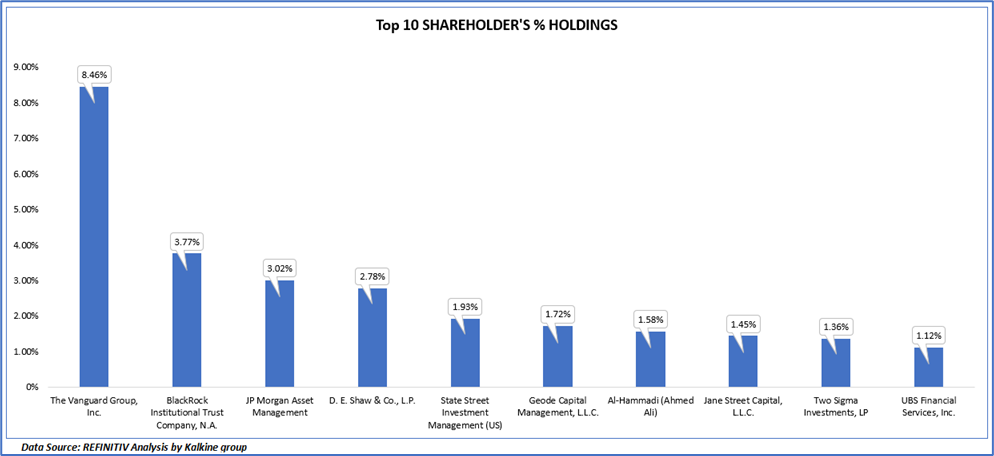
The top 10 shareholders together form ~ 27.18% of the total shareholding, signifying concentrated shareholding. The Vanguard Group, Inc. and BlackRock Institutional Trust Company, N.A. are the biggest shareholders, holding the maximum stake in the company at 8.46% and 3.77%, respectively.
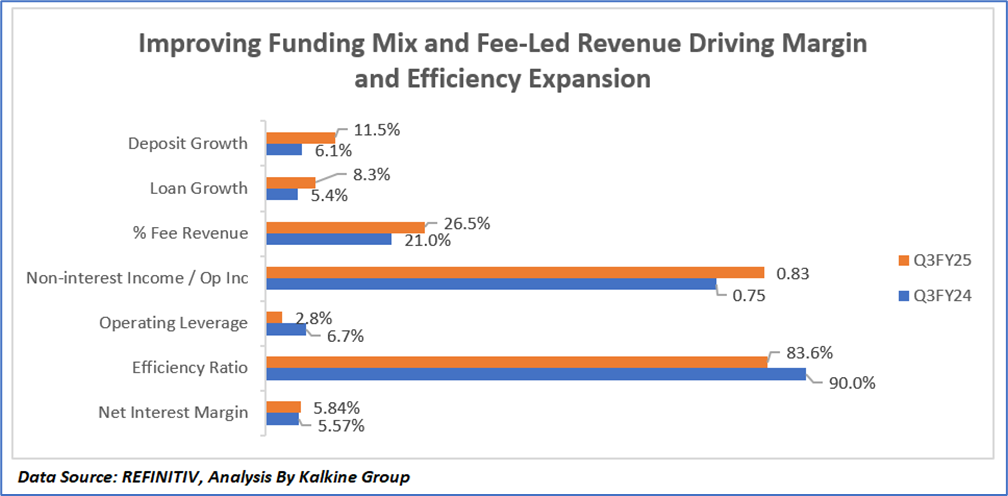
1.4 Key Metrics:
The trends shown in the chart reflect SoFi’s continued shift toward a more diversified and capital-light operating model in Q3 FY25. Deposit growth accelerated as higher direct deposit adoption, competitive rates, and stronger brand engagement drove funding inflows, while loan growth improved on the back of robust demand across personal, student, and home lending alongside higher platform-driven originations. The rising share of fee revenue and higher non-interest income relative to operating income were driven by the rapid scaling of the Loan Platform Business, interchange, brokerage, and referral fees, improving revenue quality. Net interest margin expanded as lower-cost consumer deposits replaced more expensive wholesale funding, partially offsetting modest yield pressure. Although operating leverage moderated due to increased investments in technology, AI, and brand building, overall efficiency improved as revenue growth outpaced expense growth, underscoring improving economics and long-term earnings durability.
Section 2: Business Updates and Corporate Business Highlights
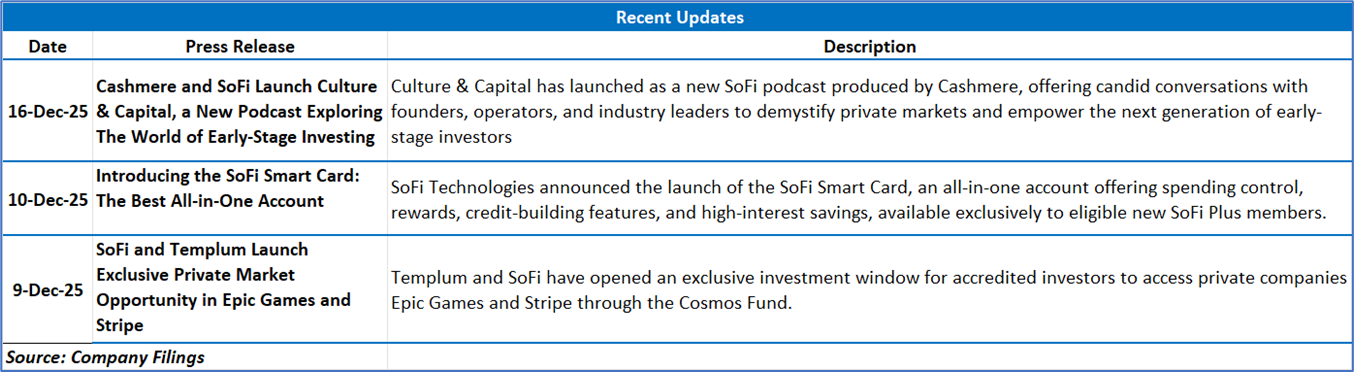
2.1 Recent Business Updates
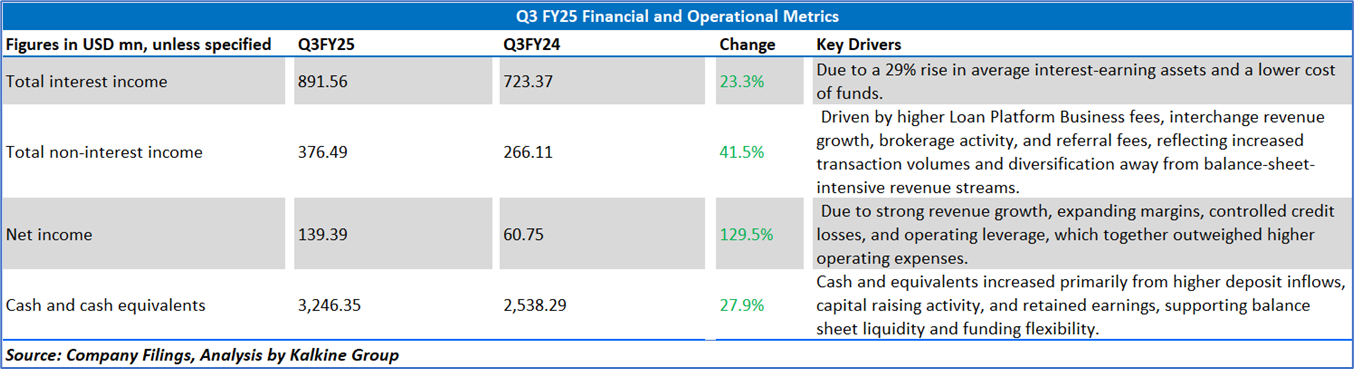
2.2 Insights of Q3FY25:
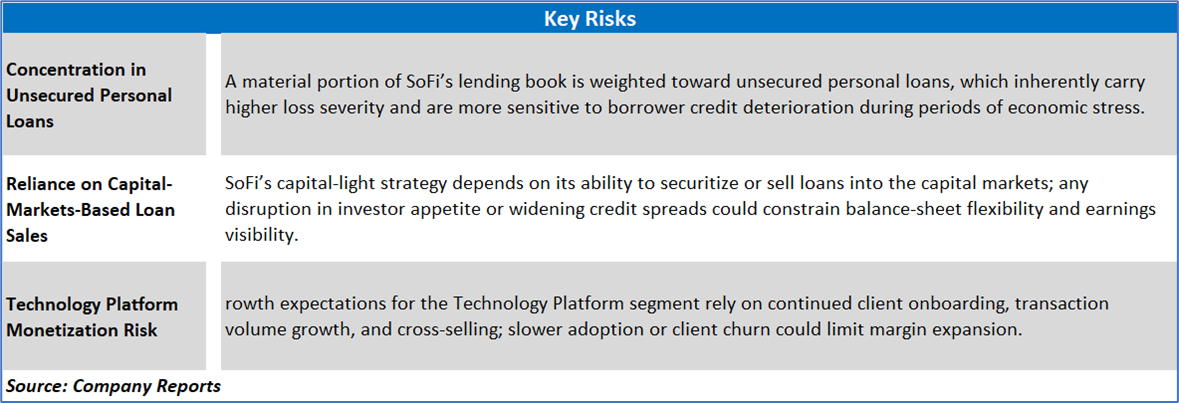
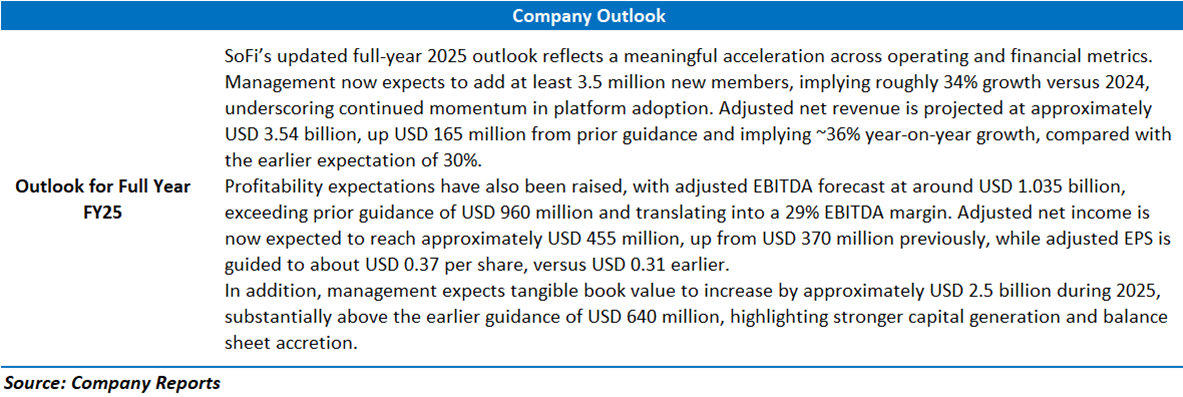
Section 3: Key Risks & Outlook
Section 4: Stock Recommendation Summary:
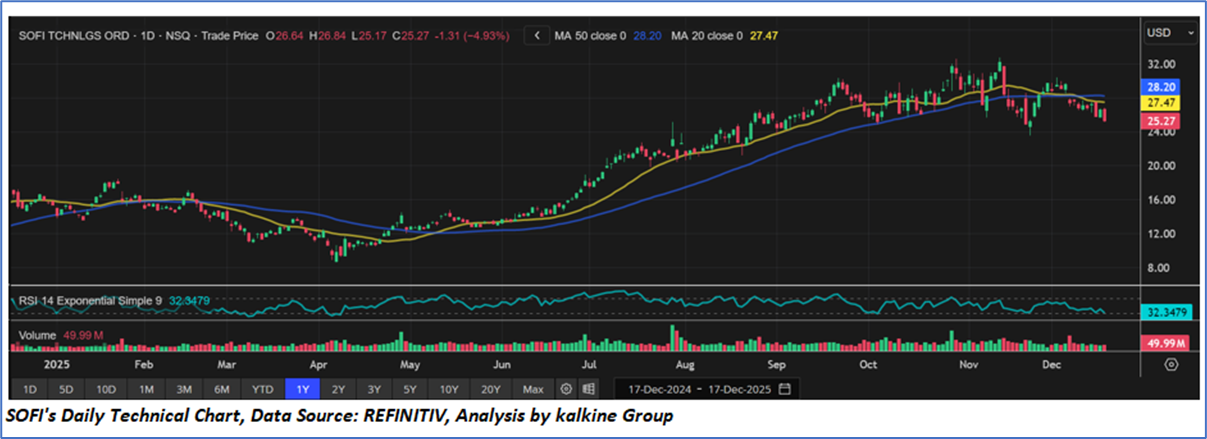
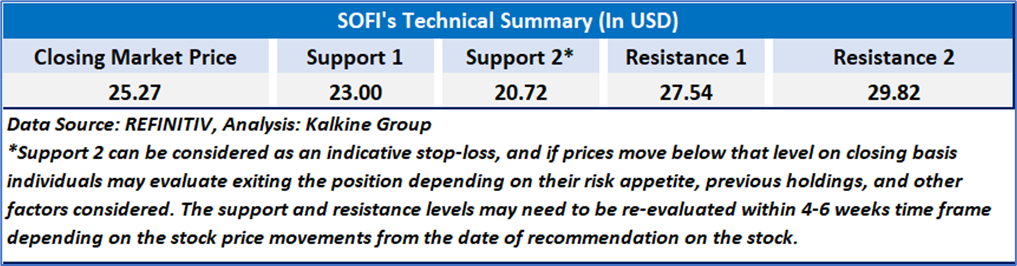
4.1 Price Performance and Technical Summary:
Stock Performance:
- After a strong multi-month rally, the stock has transitioned into a consolidation phase marked by lower highs, indicating fading upside momentum.
- The share price is trading below both the 20-day (USD 27.47) and 50-day USD 28.2) moving averages, reflecting short-term technical weakness.
- Trading volumes have moderated compared with the advance phase, pointing to reduced buying conviction at higher price levels.
- RSI is near the low-30s, close to oversold territory, confirming bearish momentum while also limiting immediate downside risk.
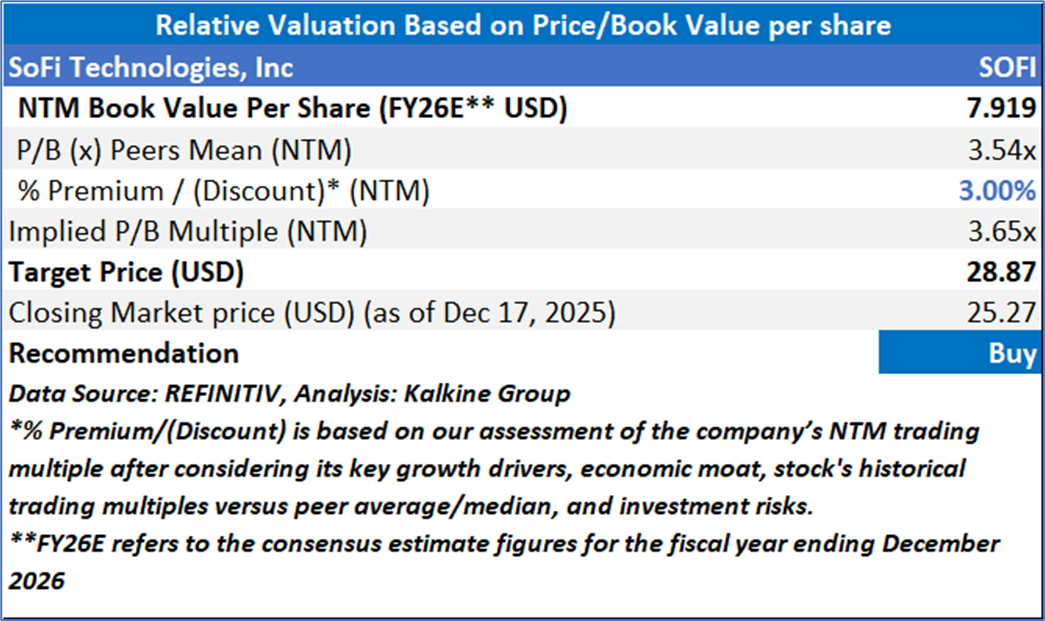
4.2 Fundamental Valuation
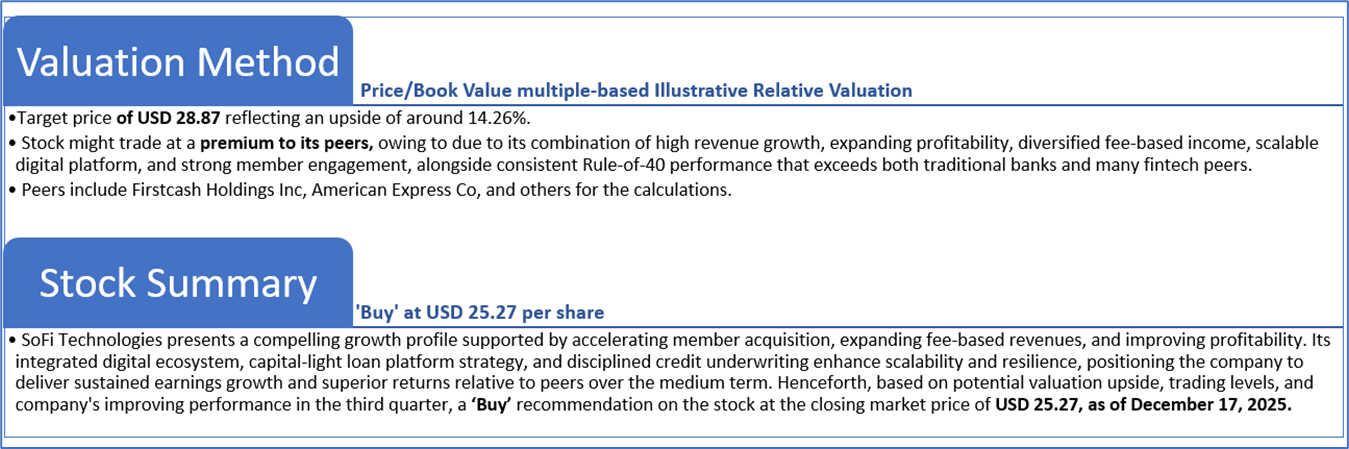
Valuation Methodology: Price/Book Value Multiple Based Relative Valuation
Markets are trading in a highly volatile zone currently due to certain macroeconomic issues and geopolitical tensions prevailing. Therefore, it is prudent to follow a cautious approach while investing.
Note 1: Past performance is not a reliable indicator of future performance.
Note 2: The reference date for all price data, currency, technical indicators, support, and resistance levels is December 17, 2025. The reference data in this report has been partly sourced from REFINITIV.
Note 3: Investment decisions should be made depending on an individual's appetite for upside potential, risks, holding duration, and any previous holdings. An 'Exit' from the stock can be considered if the Target Price mentioned as per the Valuation and or the technical levels provided has been achieved and is subject to the factors discussed above.
Note 4: The report publishing date is as per the Pacific Time Zone.
Technical Indicators Defined: -
Support: A level at which the stock prices tend to find support if they are falling, and a downtrend may take a pause backed by demand or buying interest. Support 1 refers to the nearby support level for the stock and if the price breaches the level, then Support 2 may act as the crucial support level for the stock.
Resistance: A level at which the stock prices tend to find resistance when they are rising, and an uptrend may take a pause due to profit booking or selling interest. Resistance 1 refers to the nearby resistance level for the stock and if the price surpasses the level, then Resistance 2 may act as the crucial resistance level for the stock.
Stop-loss: It is a level to protect against further losses in case of unfavorable movement in the stock prices.
Disclaimer-
This report has been issued by Kalkine Limited (Company number 07903332), a private limited company, incorporated in England and Wales ("Kalkine”). Kalkine.co.uk and associated pages are published by Kalkine. Kalkine is authorised and regulated by the Financial Conduct Authority under reference number 579414.
The information in this report and on the Kalkine website has been prepared from a wide variety of sources, which Kalkine, to the best of its knowledge and belief, considers accurate. Kalkine has made every effort to ensure the reliability of information contained in its reports, newsletters and websites. All information represents our views at the date of publication and may change without notice. The information in this report does not constitute an offer to sell securities or other financial products or a solicitation of an offer to buy securities or other financial products. Our reports contain non personalized recommendations to invest in securities and other financial products.
Kalkine does not offer financial advice based upon your personal financial situation or goals, and we shall not be held liable for any investment or trading losses you may incur by using the opinions expressed in our reports, publications, market updates, news alerts and corporate profiles. Kalkine does not intend to exclude any liability which it is not permitted to exclude under applicable law or regulation. Kalkine’s non-personalised advice does not in any way endorse or recommend individuals, investment products or services for your personal financial situation. You should discuss your portfolios and the risk tolerance level appropriate for your personal financial situation, with a professional authorised financial planner and adviser. You should be aware that the value of any investment and the income from it can go down as well as up and you may not get back the amount invested.
Please also read our Terms & Conditions for further information. Employees and/or associates of Kalkine and its related entities may hold interests in the securities or other financial products covered in this report or on the Kalkine website. Any such employees and associates are required to comply with certain safeguards, procedures and disclosures as required by law.
Kalkine Media Limited, an affiliate of Kalkine, may have received, or be entitled to receive, financial consideration in connection with providing information about certain entity(s) covered on its website including entities covered in this report.
Past performance is not a reliable indicator of future performance.

 Please wait processing your request...