Section 1: Company Overview and Fundamentals
1.1 Company Overview:
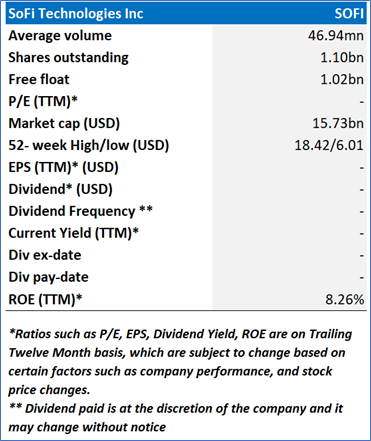
SoFi Technologies, Inc. (NASDAQ: SOFI) is a provider of financial services. The Company, through its lending and financial services products, allows members to borrow, save, spend, invest, and protect their money. It operates through three segments: Lending, Technology Platform and Financial Services. The Lending Segment offers personal loans, student loans, home loans and related servicing. Its platform supports the full transaction lifecycle, including credit application, underwriting, approval, funding, and servicing.
Kalkine’s American Tech Report covers the Company Overview, Key positives & negatives, Investment summary, Key investment metrics, Top 10 shareholding, Business updates and insights into company recent financial results, Key Risks & Outlook, Price performance and technical summary, Target Price, and Recommendation on the stock.
Price Performance:
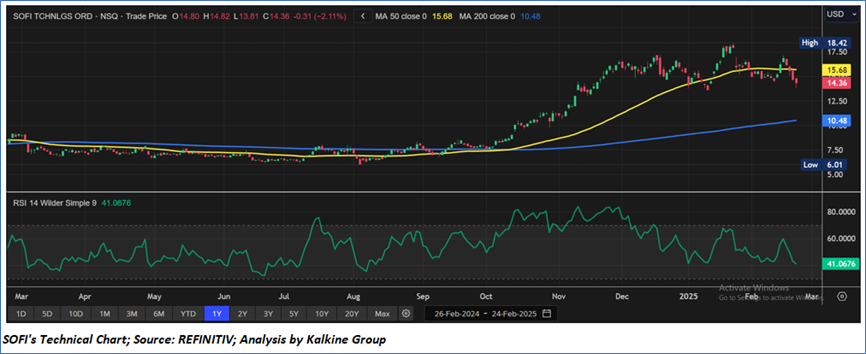
- SOFI's share price has been corrected by 8.53% in the past three months. On the other hand, in the long term, the stock has given a return of 87.22% over the past six months.
- The stock is leaning towards the higher band of its 52-week range of USD 18.42 and 52-week low price of USD 6.01, with the current price near an important support area of USD 13.00-USD 14.00, therefore an expectation of upward movement if the levels sustain.
- The price is currently between both its short-term (50-day) SMA and long-term (200-day) SMA, with the current RSI of 41.07, moving towards oversold zone, with expectations of upward movement.
1.2 The Key Positives, Negatives, and Investment summary

1.3 Top 10 shareholders:
The top 10 shareholders together form ~27.11% of the total shareholding, signifying concentrated shareholding. The Vanguard Group, Inc., and BlackRock Institutional Trust Company, N.A. are the biggest shareholders, holding the maximum stake in the company at ~8.95% and ~3.84%, respectively.

1.4 Key Metrics:
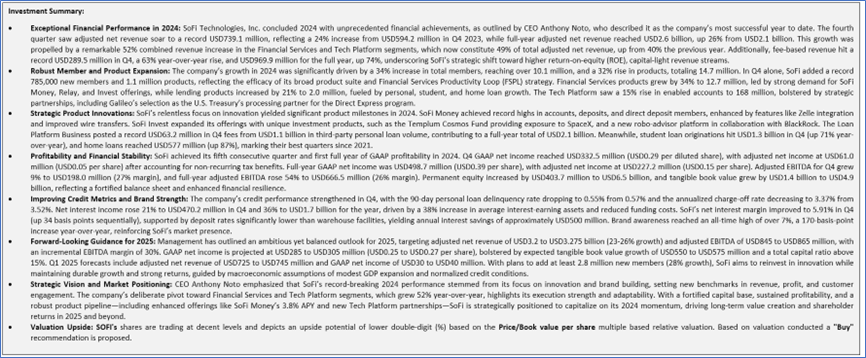
From 2020 to 2024, SoFi Technologies, Inc. demonstrated remarkable financial growth, with total net revenue increasing significantly from USD751 million in 2020 to a record USD3,766 million in 2024, reflecting a compound annual growth rate (CAGR) of approximately 50%, driven by robust expansion in its financial services and technology platforms. Total noninterest income also rose steadily, reaching USD958 million in 2024 from USD388 million in 2020, underscoring the success of fee-based and capital-light revenue streams, such as loan platform fees and interchange revenue. However, despite consistent revenue growth, SoFi reported net losses from 2020 to 2023, ranging from USD224.05 million to USD300.74 million, primarily due to high operating costs, investments in growth, and macroeconomic challenges; the pivotal shift to a net income of USD498.67 million in 2024 marks its first year of GAAP profitability, signaling improved operational efficiency, cost management, and a strategic focus on higher-margin products, as evidenced by its record adjusted EBITDA and member growth in Q4 2024. This turnaround highlights SoFi’s resilience and ability to leverage its innovative fintech model, though sustained profitability will depend on managing credit risks, interest rate volatility, and competitive pressures in 2025 and beyond.

Section 2: Business Updates and Financial Highlights
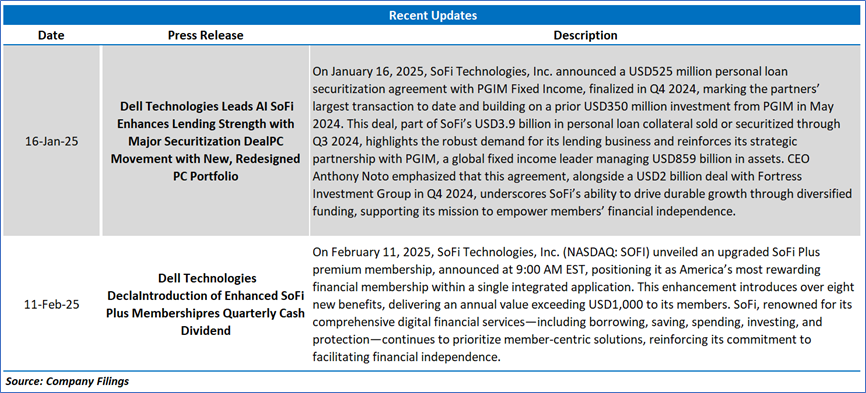
2.1 Recent Updates:
The below picture gives an overview of the recent updates:
2.2 Insights of FY24:

Section 3: Key Risks and Outlook:


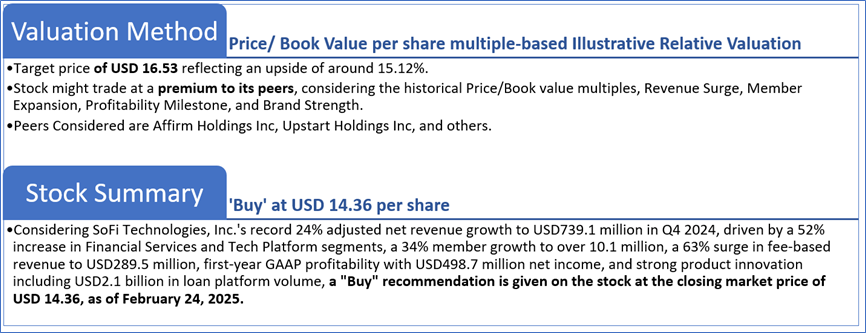
Section 4: Stock Recommendation Summary:
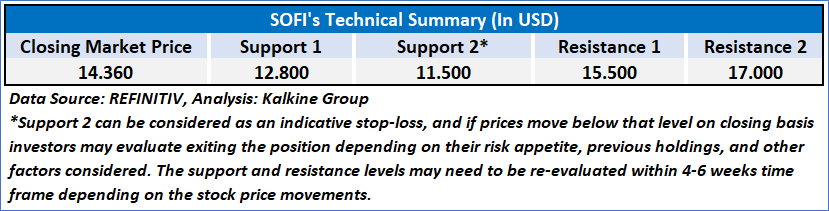
4.1 Technical Summary:
Price Performance:
- SOFI's share price has been corrected by 8.53% in the past three months. On the other hand, in the long term, the stock has given a return of 87.22% over the past six months.
- The stock is leaning towards the higher band of its 52-week range of USD 18.42 and 52-week low price of USD 6.01, with the current price near an important support area of USD 13.00-USD 14.00, therefore an expectation of upward movement if the levels sustain.
- The price is currently between both its short-term (50-day) SMA and long-term (200-day) SMA, with the current RSI of 41.07, moving towards oversold zone, with expectations of upward movement.
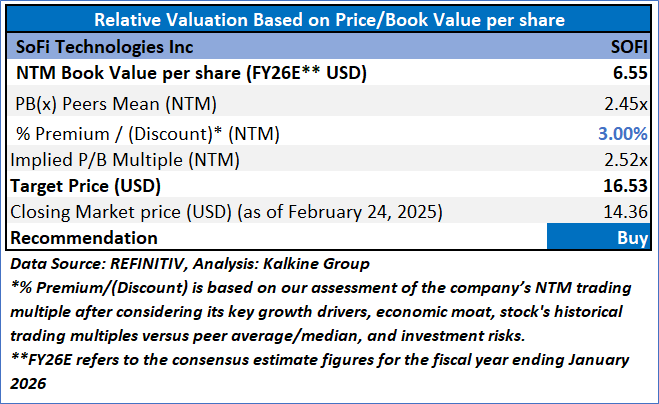
4.2 Fundamental Valuation
Valuation Methodology: Price/Book Value Per Share Multiple Based Relative Valuation
Markets are trading in a highly volatile zone currently due to certain macroeconomic issues and geopolitical tensions prevailing. Therefore, it is prudent to follow a cautious approach while investing.
Note 1: Past performance is not a reliable indicator of future performance.
Note 2: The reference date for all price data, currency, technical indicators, support, and resistance levels is February 24, 2025. The reference data in this report has been partly sourced from REFINITIV.
Note 3: Investment decisions should be made depending on an individual's appetite for upside potential, risks, holding duration, and any previous holdings. An 'Exit' from the stock can be considered if the Target Price mentioned as per the Valuation and or the technical levels provided has been achieved and is subject to the factors discussed above.
Note 4: The report publishing date is as per the Pacific Time Zone.
Technical Indicators Defined: -
Support: A level at which the stock prices tend to find support if they are falling, and a downtrend may take a pause backed by demand or buying interest. Support 1 refers to the nearby support level for the stock and if the price breaches the level, then Support 2 may act as the crucial support level for the stock.
Resistance: A level at which the stock prices tend to find resistance when they are rising, and an uptrend may take a pause due to profit booking or selling interest. Resistance 1 refers to the nearby resistance level for the stock and if the price surpasses the level, then Resistance 2 may act as the crucial resistance level for the stock.
Stop-loss: It is a level to protect against further losses in case of unfavorable movement in the stock prices.
Disclaimer-
This report has been issued by Kalkine Limited (Company number 07903332), a private limited company, incorporated in England and Wales ("Kalkine”). Kalkine.co.uk and associated pages are published by Kalkine. Kalkine is authorised and regulated by the Financial Conduct Authority under reference number 579414.
The information in this report and on the Kalkine website has been prepared from a wide variety of sources, which Kalkine, to the best of its knowledge and belief, considers accurate. Kalkine has made every effort to ensure the reliability of information contained in its reports, newsletters and websites. All information represents our views at the date of publication and may change without notice. The information in this report does not constitute an offer to sell securities or other financial products or a solicitation of an offer to buy securities or other financial products. Our reports contain non personalized recommendations to invest in securities and other financial products.
Kalkine does not offer financial advice based upon your personal financial situation or goals, and we shall not be held liable for any investment or trading losses you may incur by using the opinions expressed in our reports, publications, market updates, news alerts and corporate profiles. Kalkine does not intend to exclude any liability which it is not permitted to exclude under applicable law or regulation. Kalkine’s non-personalised advice does not in any way endorse or recommend individuals, investment products or services for your personal financial situation. You should discuss your portfolios and the risk tolerance level appropriate for your personal financial situation, with a professional authorised financial planner and adviser. You should be aware that the value of any investment and the income from it can go down as well as up and you may not get back the amount invested.
Please also read our Terms & Conditions for further information. Employees and/or associates of Kalkine and its related entities may hold interests in the securities or other financial products covered in this report or on the Kalkine website. Any such employees and associates are required to comply with certain safeguards, procedures and disclosures as required by law.
Kalkine Media Limited, an affiliate of Kalkine, may have received, or be entitled to receive, financial consideration in connection with providing information about certain entity(s) covered on its website including entities covered in this report.
Past performance is not a reliable indicator of future performance.
 Please wait processing your request...