Section 1: Company Overview and Fundamentals
1.1Company Overview:
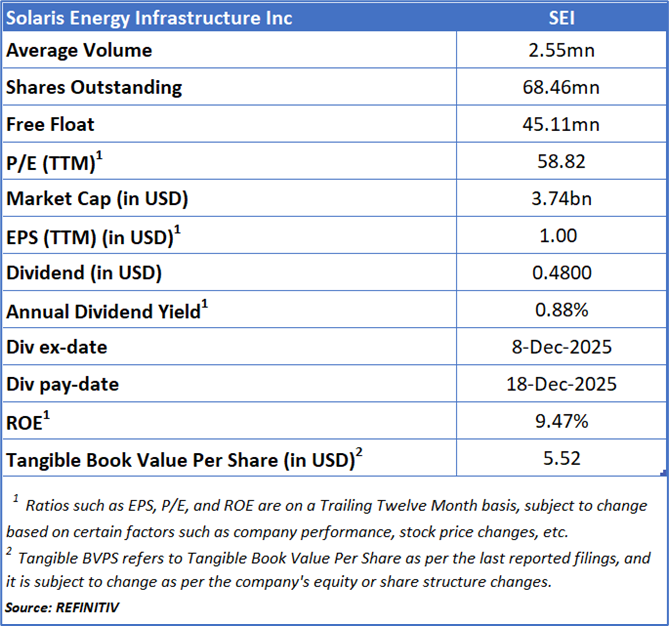
Solaris Energy Infrastructure Inc (NYSE: SEI) delivers portable, scalable, equipment-driven solutions that support distributed power generation and facilitate the handling of raw materials used in oil and natural gas well completions. The company operates through two primary segments: Solaris Power Solutions and Solaris Logistics Solutions.
Kalkine’s Diversified Opportunities Report covers the Company Overview, Key positives & negatives, Investment summary, Key investment metrics, Top 10 shareholding, Business updates and insights into company recent financial results, Key Risks & Outlook, Price performance and technical summary, Target Price, and Recommendation on the stock.
Stock Performance:
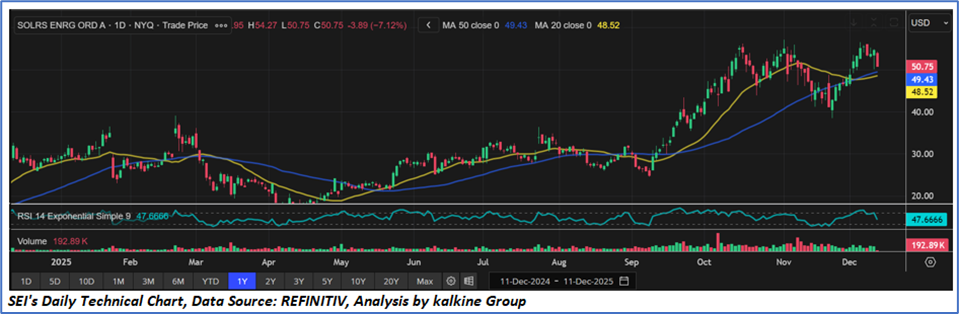
- Over the past year, the stock has maintained a broad upward trend, particularly strengthening from August through November, where it produced a pronounced series of higher highs and higher lows. The recent pullback in early December appears to be a normal correction within the broader uptrend.
- Over the last few months, MA20 remains above the MA50, indicating short-term bullish momentum. Despite the recent decline, the price is above the MA50 (USD 49.43) and hovering near the MA20, which is flattening, showing a loss of upward momentum but not yet a trend reversal.
- Current RSI is 47.66, implying that the stock is in the neutral zone (neither overbought nor oversold) and momentum has cooled from its October–November highs.
- Recent red volume bars indicate increased selling pressure during the decline. However, volume is not excessively high, suggesting the pullback may not represent institutional capitulation.
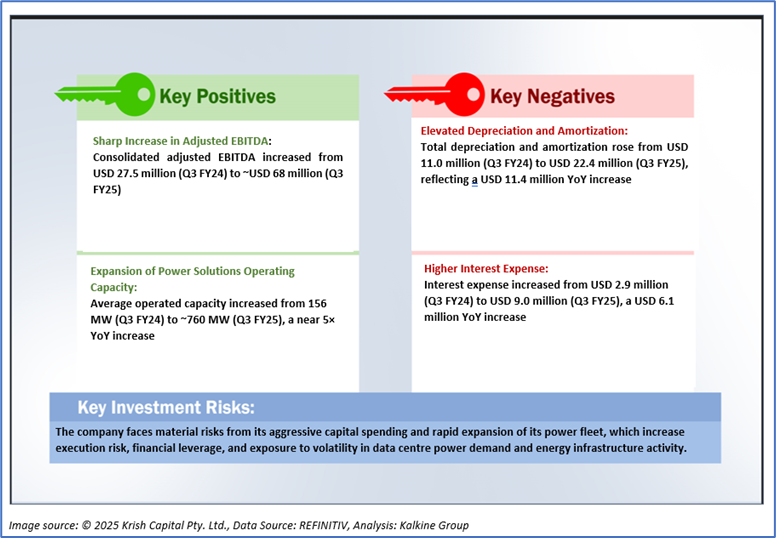
1.2 The Key Positives, Negatives, and Investment summary
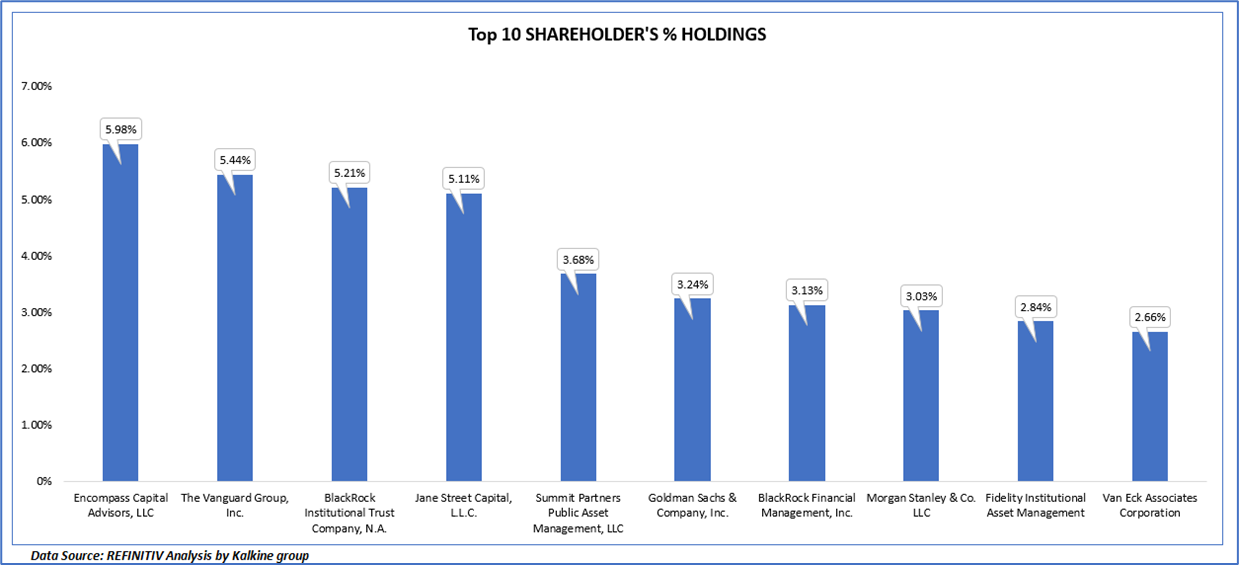
1.3 Top 10 shareholders:
The top 10 shareholders together form ~ 40.33% of the total shareholding, signifying concentrated shareholding. Encompass Capital Advisors, LLC and The Vanguard Group, Inc are the biggest shareholders, holding the maximum stake in the company at 5.98% and 5.44%, respectively.
1.4 Key Metrics:
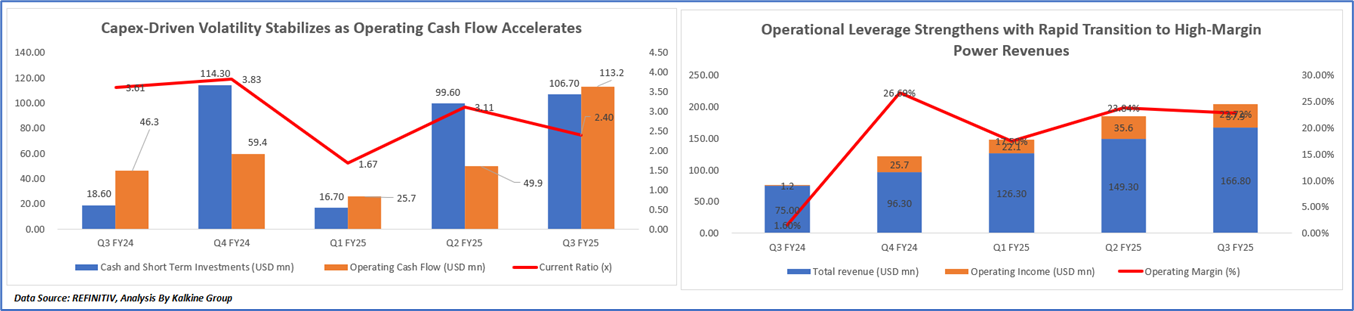
The trends in cash, operating cash flow, and the current ratio reflect Solaris Energy Infrastructure’s rapid transition from a stable, logistics-focused business to a capital-intensive, high-growth power solutions platform. Cash and the current ratio remain healthy in FY24, supported by steady Logistics Solutions performance and strong year-end collections. However, both metrics decline sharply in Q1 FY25 as the company enters a heavy investment cycle, deploying substantial capital into turbines, equipment held for lease, and working capital tied to rapid expansion, all while new assets are not yet fully revenue-generating. As additional megawatts begin operating in Q2 FY25, cash flow strengthens and liquidity improves, driven by higher Power Solutions revenue and better receivables conversion. By Q3 FY25, record revenue and strong segment profitability further lift cash and operating cash flow, though the current ratio moderates due to elevated payables, higher receivables, and ongoing capex commitments required to scale the power fleet. Overall, the movements in these metrics are driven primarily by the timing of large growth investments followed by revenue activation of deployed power assets.
Considering the profitability trend analysis, it is evident that Solaris Energy Infrastructure is transitioning from a logistics-centric business to a rapidly scaling power-solutions platform. Revenue and operating income are low in Q3 FY24 because the Power Solutions segment is still in its early stages, resulting in minimal margins. By Q4 FY24 and Q1 FY25, revenue rises as additional megawatts are deployed, but margins fluctuate due to timing gaps between turbine commissioning and revenue recognition, higher depreciation, and increased SG&A tied to expansion. A sharper improvement emerges in Q2 FY25 as a significantly larger installed power base begins generating high-margin leasing revenue, driving a strong uplift in operating income and margin. In Q3 FY25, record revenue and continued fleet scaling further boost profitability, although operating margin moderates slightly as depreciation, workforce expansion, and integration of newly acquired capabilities increase operating costs.
Section 2: Business Updates and Corporate Business Highlights
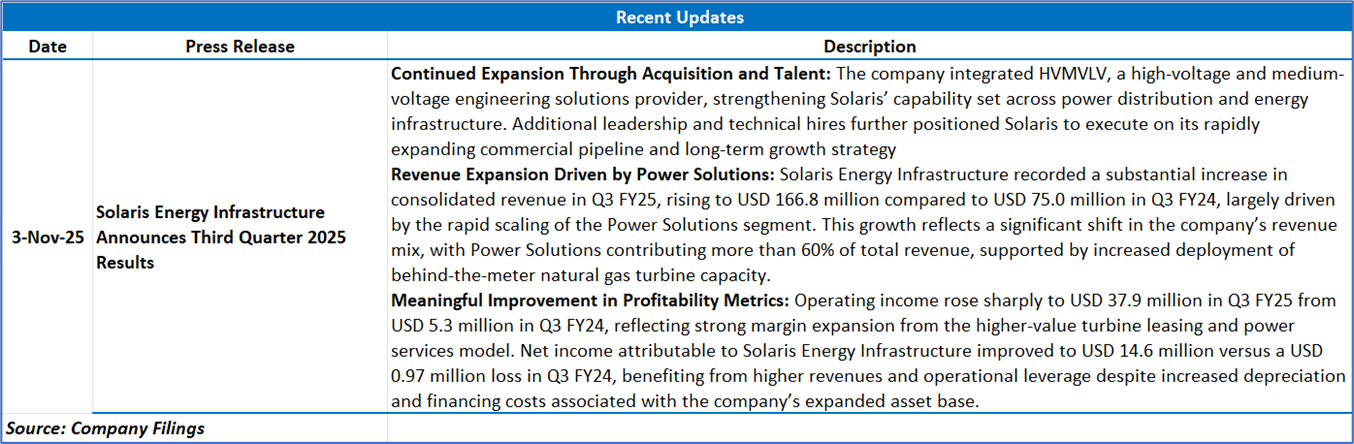
2.1 Recent Business Updates
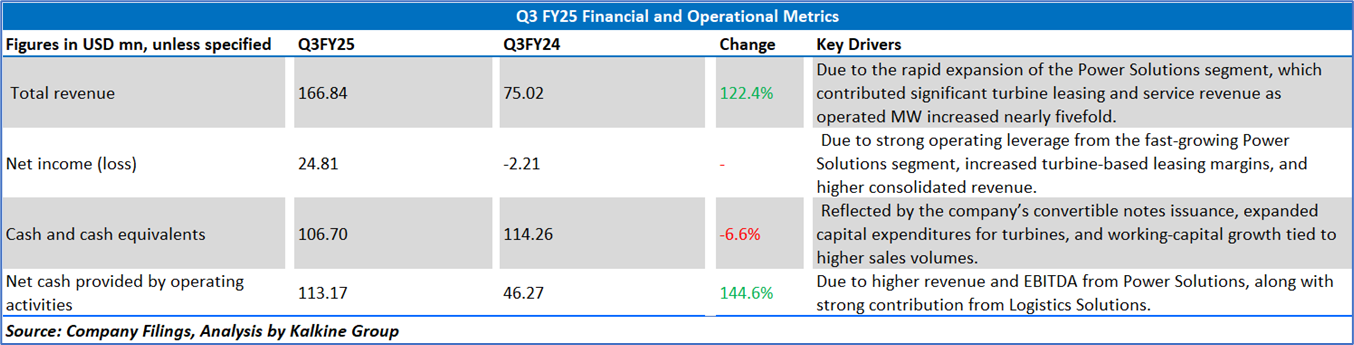
2.2 Insights of Q3FY25:
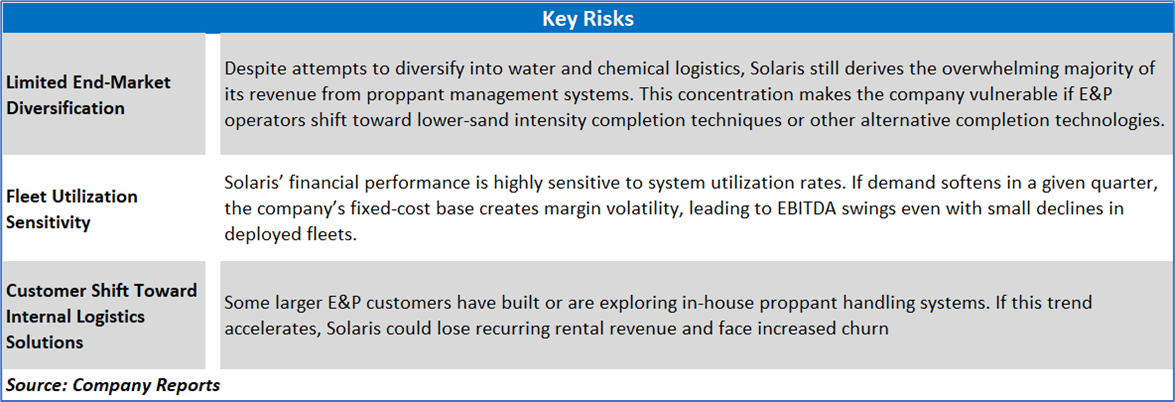
Section 3: Key Risks & Outlook
Section 4: Stock Recommendation Summary:
4.1 Price Performance and Technical Summary:
Stock Performance:
- Over the past year, the stock has maintained a broad upward trend, particularly strengthening from August through November, where it produced a pronounced series of higher highs and higher lows. The recent pullback in early December appears to be a normal correction within the broader uptrend.
- Over the last few months, MA20 remains above the MA50, indicating short-term bullish momentum. Despite the recent decline, the price is above the MA50 (USD 49.43) and hovering near the MA20, which is flattening, showing a loss of upward momentum but not yet a trend reversal.
- Current RSI is 47.66, implying that the stock is in the neutral zone (neither overbought nor oversold) and momentum has cooled from its October–November highs.
- Recent red volume bars indicate increased selling pressure during the decline. However, volume is not excessively high, suggesting the pullback may not represent institutional capitulation.
4.2 Fundamental Valuation
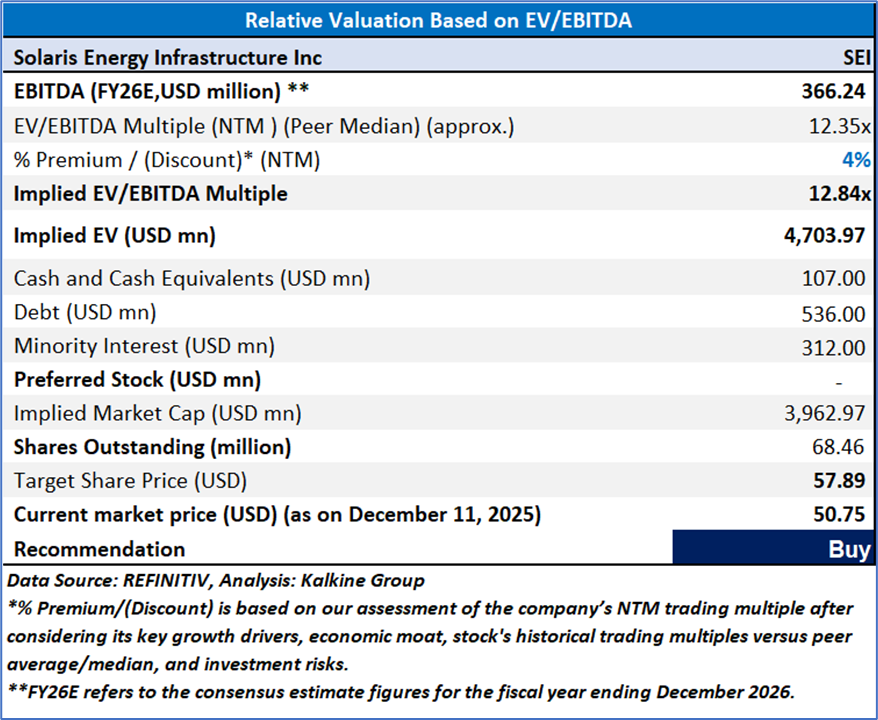
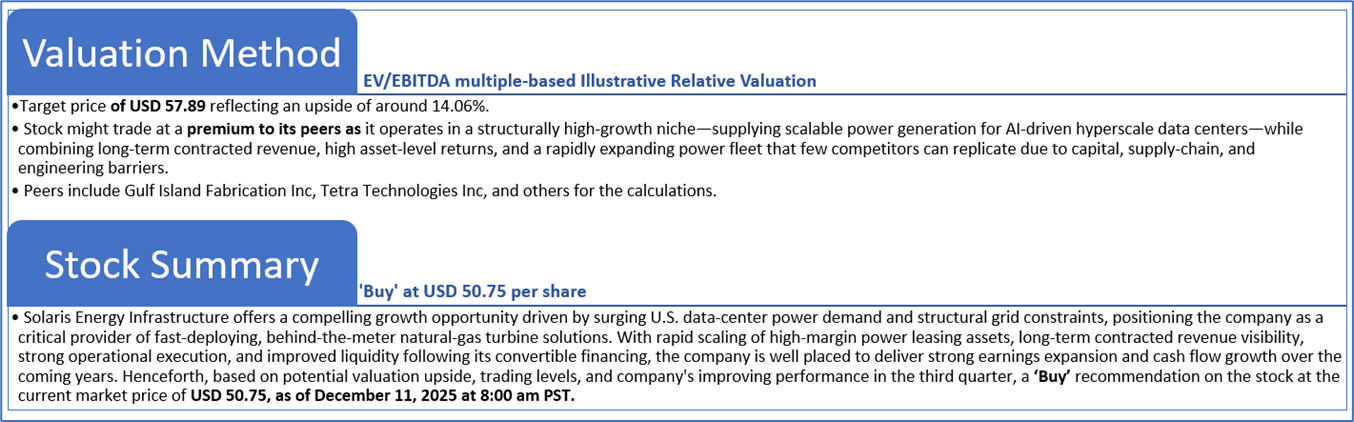
Valuation Methodology: EV/EBITDA Multiple Based Relative Valuation
Markets are trading in a highly volatile zone currently due to certain macroeconomic issues and geopolitical tensions prevailing. Therefore, it is prudent to follow a cautious approach while investing.
Note 1: Past performance is not a reliable indicator of future performance.
Note 2: The reference date for all price data, currency, technical indicators, support, and resistance levels is December 11, 2025. The reference data in this report has been partly sourced from REFINITIV.
Note 3: Investment decisions should be made depending on an individual's appetite for upside potential, risks, holding duration, and any previous holdings. An 'Exit' from the stock can be considered if the Target Price mentioned as per the Valuation and or the technical levels provided has been achieved and is subject to the factors discussed above.
Note 4: The report publishing date is as per the Pacific Time Zone.
Technical Indicators Defined: -
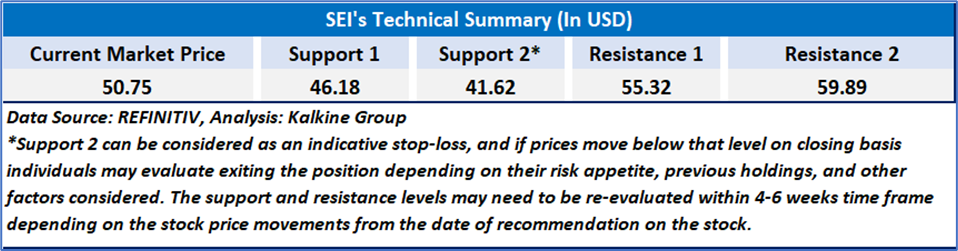
Support: A level at which the stock prices tend to find support if they are falling, and a downtrend may take a pause backed by demand or buying interest. Support 1 refers to the nearby support level for the stock and if the price breaches the level, then Support 2 may act as the crucial support level for the stock.
Resistance: A level at which the stock prices tend to find resistance when they are rising, and an uptrend may take a pause due to profit booking or selling interest. Resistance 1 refers to the nearby resistance level for the stock and if the price surpasses the level, then Resistance 2 may act as the crucial resistance level for the stock.
Stop-loss: It is a level to protect against further losses in case of unfavorable movement in the stock prices.
Disclaimer-
This report has been issued by Kalkine Limited (Company number 07903332), a private limited company, incorporated in England and Wales ("Kalkine”). Kalkine.co.uk and associated pages are published by Kalkine. Kalkine is authorised and regulated by the Financial Conduct Authority under reference number 579414.
The information in this report and on the Kalkine website has been prepared from a wide variety of sources, which Kalkine, to the best of its knowledge and belief, considers accurate. Kalkine has made every effort to ensure the reliability of information contained in its reports, newsletters and websites. All information represents our views at the date of publication and may change without notice. The information in this report does not constitute an offer to sell securities or other financial products or a solicitation of an offer to buy securities or other financial products. Our reports contain non personalized recommendations to invest in securities and other financial products.
Kalkine does not offer financial advice based upon your personal financial situation or goals, and we shall not be held liable for any investment or trading losses you may incur by using the opinions expressed in our reports, publications, market updates, news alerts and corporate profiles. Kalkine does not intend to exclude any liability which it is not permitted to exclude under applicable law or regulation. Kalkine’s non-personalised advice does not in any way endorse or recommend individuals, investment products or services for your personal financial situation. You should discuss your portfolios and the risk tolerance level appropriate for your personal financial situation, with a professional authorised financial planner and adviser. You should be aware that the value of any investment and the income from it can go down as well as up and you may not get back the amount invested.
Please also read our Terms & Conditions for further information. Employees and/or associates of Kalkine and its related entities may hold interests in the securities or other financial products covered in this report or on the Kalkine website. Any such employees and associates are required to comply with certain safeguards, procedures and disclosures as required by law.
Kalkine Media Limited, an affiliate of Kalkine, may have received, or be entitled to receive, financial consideration in connection with providing information about certain entity(s) covered on its website including entities covered in this report.
Past performance is not a reliable indicator of future performance.

 Please wait processing your request...