Kalkine’s Global Travel & Leisure Report offers a comprehensive view of the key companies and evolving trends across the travel value chain covering countries including US, Canada, Australia, UK, and New Zealand. This includes airlines, hospitality chains, digital travel platforms, as well as the rapidly growing leisure, entertainment, and gaming segments that are redefining the way people engage with travel experiences.

Airline Service and Cargo Market: A Dynamic Growth Trajectory:
- Global aviation revenues reached ~USD 970–990 billion in 2024, with passenger traffic recovering to ~102% of 2019 levels, signaling a fully normalized demand environment.
- 2025 passenger demand is projected to grow ~5–6% YoY, while aircraft delivery delays keep supply tight, supporting stronger fares and load factors.
- North America remains the most profitable region, generating over 60% of global airline net income, driven by strong U.S. leisure travel and diversified revenue models.
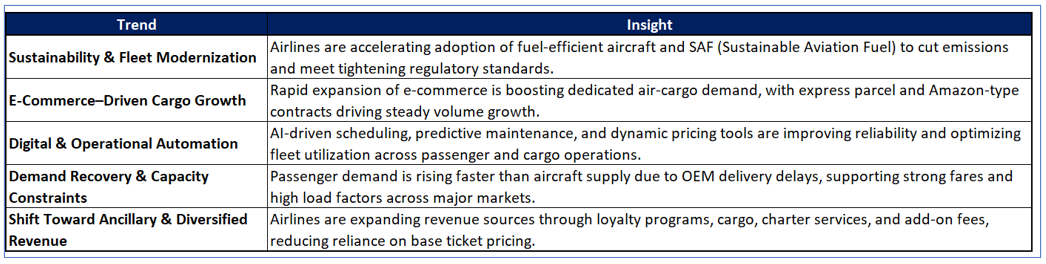
- Air cargo volumes are expected to grow ~4% YoY in 2025, with e-commerce–driven demand benefiting carriers with dedicated freighters—relevant for SNCY’s Amazon-based cargo operations.
- Fuel costs remain elevated at ~USD 110–120/bbl equivalent for 2025, maintaining pressure on margins and increasing the competitive advantage of low-cost and hybrid carriers with efficient cost structures.


- 2020 – Industry Collapse and Cargo Becomes the Lifeline: The aviation sector suffered an unprecedented contraction, with global passenger traffic down ~65% and airline losses exceeding USD 130 billion, driven by border closures and grounded fleets. Air cargo, supported by booming e-commerce and supply-chain bottlenecks, grew to over 35% of total airline revenue, which is its highest share in history. Cargo yields surged more than 40%, freighter capacity ran at peak utilization, and dedicated cargo operators became essential to global trade continuity.
- 2021 – Domestic Recovery Begins, Cargo Demand Stays Elevated: Passenger demand recovered to ~50% of 2019 levels, led by U.S. leisure travel, with TSA throughput rising steadily from March onward. Airlines restructured fleets, renegotiated leases, and pushed digital ticketing and contactless operations. Cargo volumes grew an additional 6–8%, benefiting from persistent supply-chain disruptions, tight belly capacity, and e-commerce growth exceeding 20% annually. Hybrid carriers with freighter arrangements, like Sun Country, began emerging as operationally advantaged models.
- 2022 – International Reopening, Strong Revenue Rebound, Supply Constraints: Global passenger demand climbed to ~70–75% of 2019, with strong gains in Europe and early APAC reopening phases. Airline revenues recovered to approximately USD 780–800 billion, and load factors improved to 80–81%, though staffing shortages and aircraft delivery delays constrained supply. Cargo performance peaked, with yields still ~25–30% above 2019, supported by resilient e-commerce and high-value goods transport. North America became the first region to exceed its pre-pandemic financial performance.
- 2023 – Full Passenger Recovery and Cargo Normalization at a Higher Base: Passenger traffic returned to 100% of 2019 levels, and global airline revenue exceeded USD 900 billion, marking full top-line recovery. Load factors averaged ~83–84%, among the highest ever recorded. Cargo volumes stabilized as supply chains normalized but yields remained 5–10% above pre-pandemic levels, aided by structural e-commerce demand. Fleet shortages—driven by Boeing/Airbus certification delays—kept supply tight, supporting fare strength and improving unit economics.
- 2024 – Profitability Consolidation and Hybrid Models Gain Momentum: The industry generated ~USD 970–990 billion in revenue and recorded the strongest global profitability since 2010, with North America producing more than 60% of world airline net income. Passenger demand grew ~11%, while capacity increased more slowly due to aircraft delays and pilot shortages, sustaining high load factors. Air cargo revenue normalized but remained above 2019 levels, with e-commerce expanding 15–18% YoY. Airlines increasingly diversified into loyalty monetization, cargo operations, charter services, and ancillary revenue—directly mirroring SNCY’s strategic mix.
- 2025 – Moderation, Structural Tightness, and Strength in Cargo Partnerships: Passenger demand is projected to grow 5–6%, while load factors remain elevated due to continued aircraft delivery constraints. Jet-fuel prices stabilize around USD 110–120/bbl equivalent, keeping cost discipline paramount. Cargo volumes are forecast to rise ~4%, driven by Amazon-style contract flying and cross-border express shipping. North America remains the profit engine of global aviation, supported by strong leisure demand, robust ancillary revenue streams, and stable cargo economics. The industry shifts from rebound to steady, structurally supported growth, favoring flexible operators with diversified revenue—an environment well-suited for Sun Country’s scheduled, charter, and cargo tri-model strategy.
Kalkine’s Global Travel & Leisure Report covers the Investment Highlights, Key Financial Metrics, Risks, Technical Analysis along with the Valuation, Target Price, and Recommendation on Sun Country Airlines Holdings Inc (NASDAQ: SNCY).
Section 1: Company Overview and Fundamentals Insights
Company Overview: Sun Country Airlines Holdings, Inc. (NASDAQ: SNCY) operates Sun Country Airlines, a hybrid low-cost air carrier that deploys shared resources across its scheduled service, charter, and cargo businesses. The Company focuses on serving leisure and visiting friends and relatives (VFR) passengers, charter customers, and providing crew, maintenance, and insurance (CMI) service to Amazon.com Services, LLC (Amazon), with flights throughout the United States and to destinations in Canada, Mexico, Central America, and the Caribbean.
Kalkine’s Global Travel and Leisure Report cover the Investment Highlights, Key Financial Metrics, Risks, and Technical Analysis along with the Valuation, Target Price, and Recommendation on the stock.
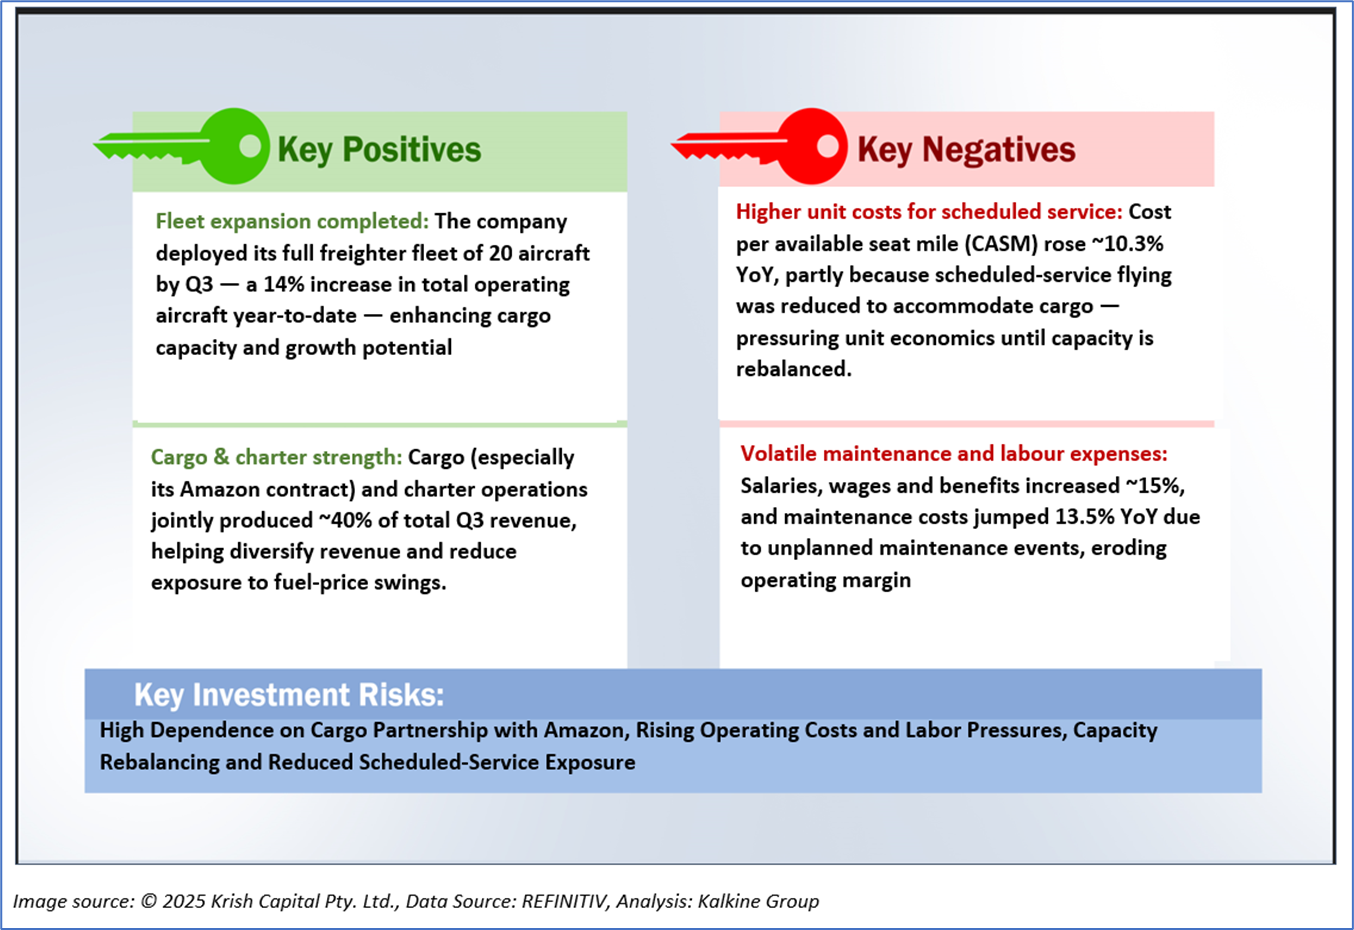
1.2 The Key Positives, Negatives, Investment Highlights, and Risks
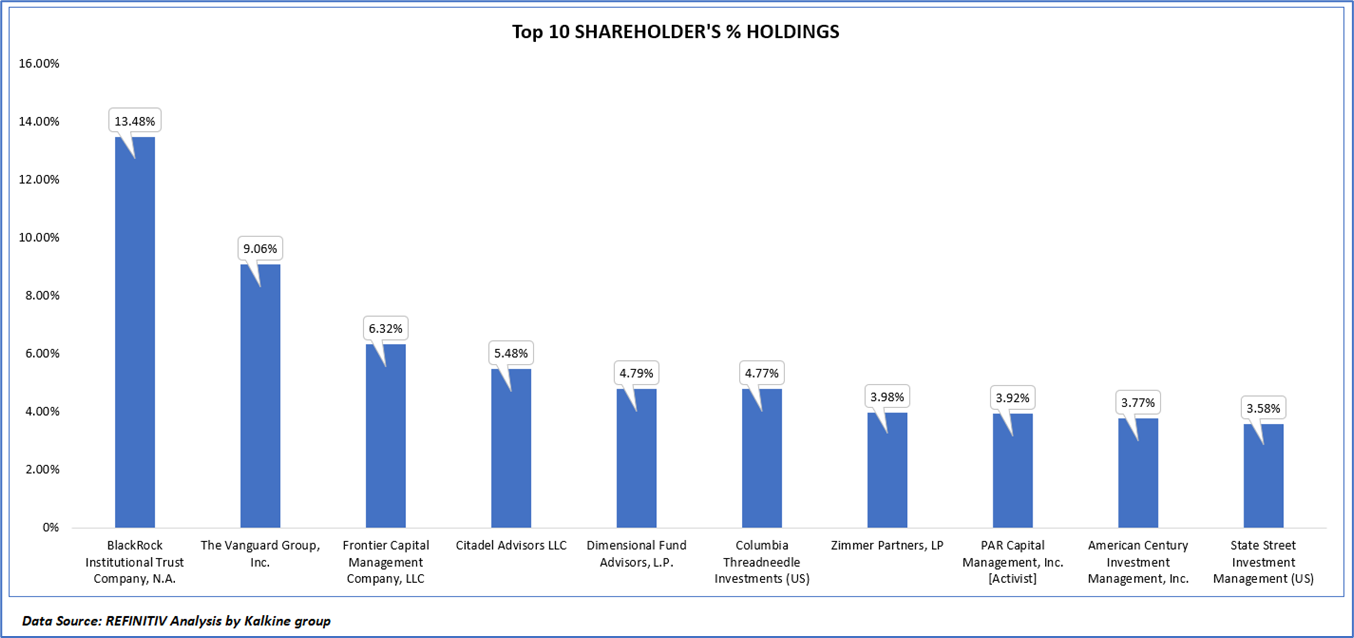
1.3 Top 10 Shareholders:
The top 10 shareholders together form ~59.15% of the total shareholding. BlackRock Institutional Trust Company, N.A. and The Vanguard Group, Inc. Ltd. hold maximum stakes of 13.48% and 9.06%, respectively.
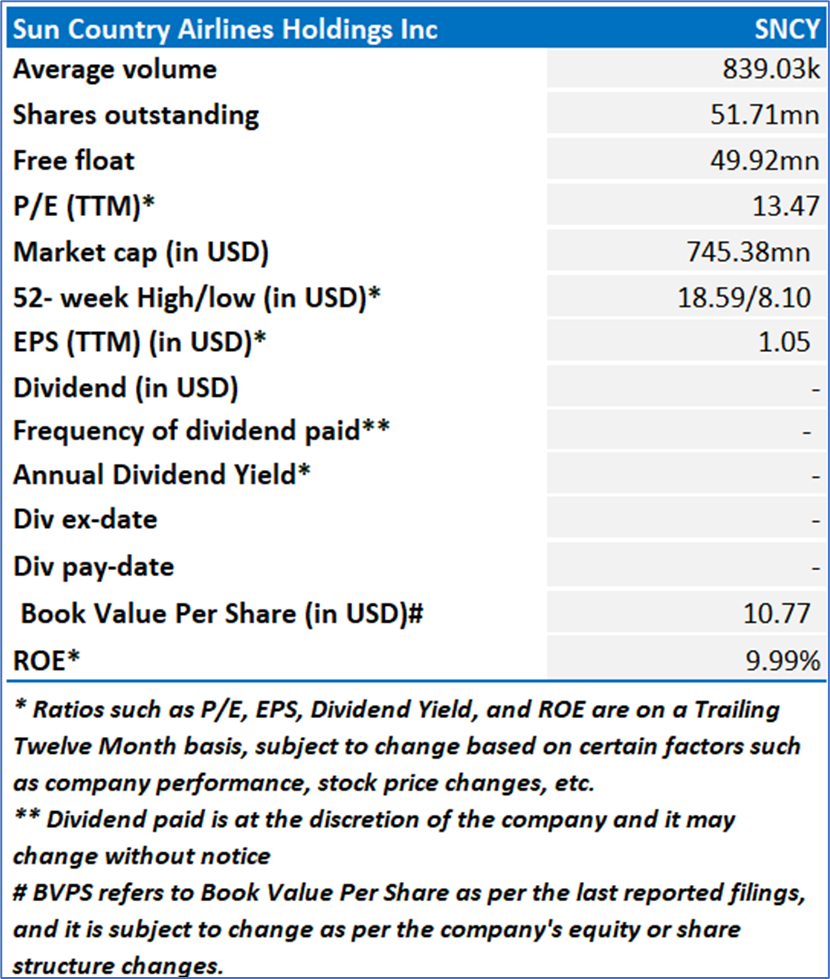
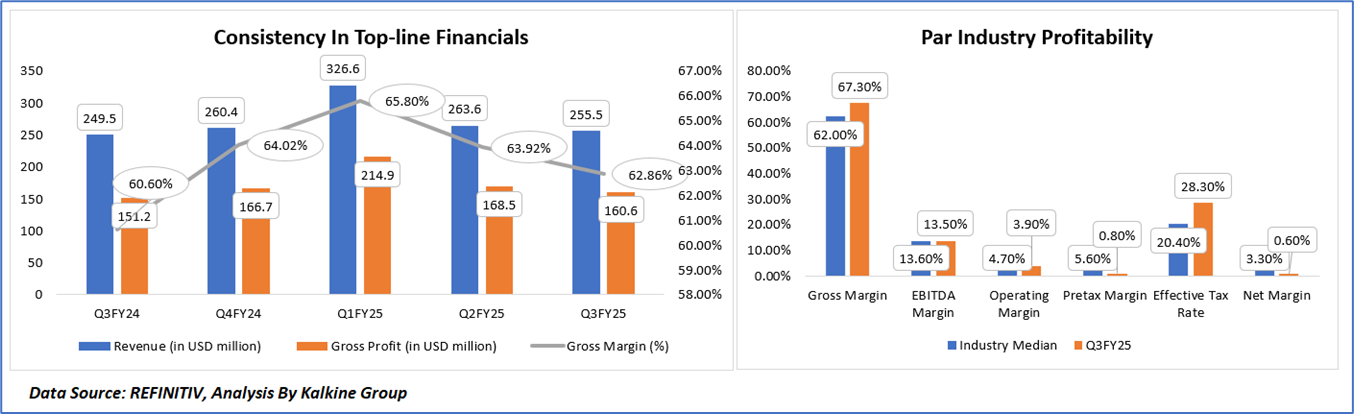
1.4 Key Metrics:
Sun Country’s Q3FY25 margins present a mixed picture when evaluated against industry medians. The Company’s gross margin of 67.3% exceeds the sector median of 62%, reflecting strong revenue quality supported by its diversified cargo and charter mix. However, EBITDA margin of 13.5% is broadly in line with the industry’s 13.6%, indicating that cost pressures—particularly labor and maintenance—are limiting incremental operating leverage. Further down the P&L, operating margin (3.9%) trails the industry median of 4.7%, and pretax margin (0.8%) significantly underperforms the 5.6% benchmark, underscoring the impact of elevated unit costs and reduced scheduled service flying. The higher effective tax rate (28.3% vs. 20.4%) further compressed profitability, contributing to a net margin of just 0.6%, well below the 3.3% industry norm.
From Q3FY24 to Q3FY25, Sun Country’s revenue trajectory remained broadly stable, though fluctuations reflect shifts in fleet utilization and business mix, peaking at USD 326.6 million in Q1FY25 before normalizing to USD 255.5 million in Q3FY25. Gross profit followed a similar pattern, reaching a high of USD 214.9 million in Q1FY25 before easing to USD 160.6 million in Q3FY25. Despite this moderation, the Company’s gross margin remained consistently above 60% throughout the five-quarter period, though it has trended lower—from 65.8% in Q1FY25 to 62.9% in Q3FY25—indicating rising cost pressures as cargo growth displaced higher-margin scheduled services. The overall trend suggests that while Sun Country’s revenue base remains resilient, margin compression is becoming more visible as cost intensities increase and the business continues to rebalance capacity between scheduled, cargo, and charter operations.
Section 2: Business Updates, Financial and Operational Highlights
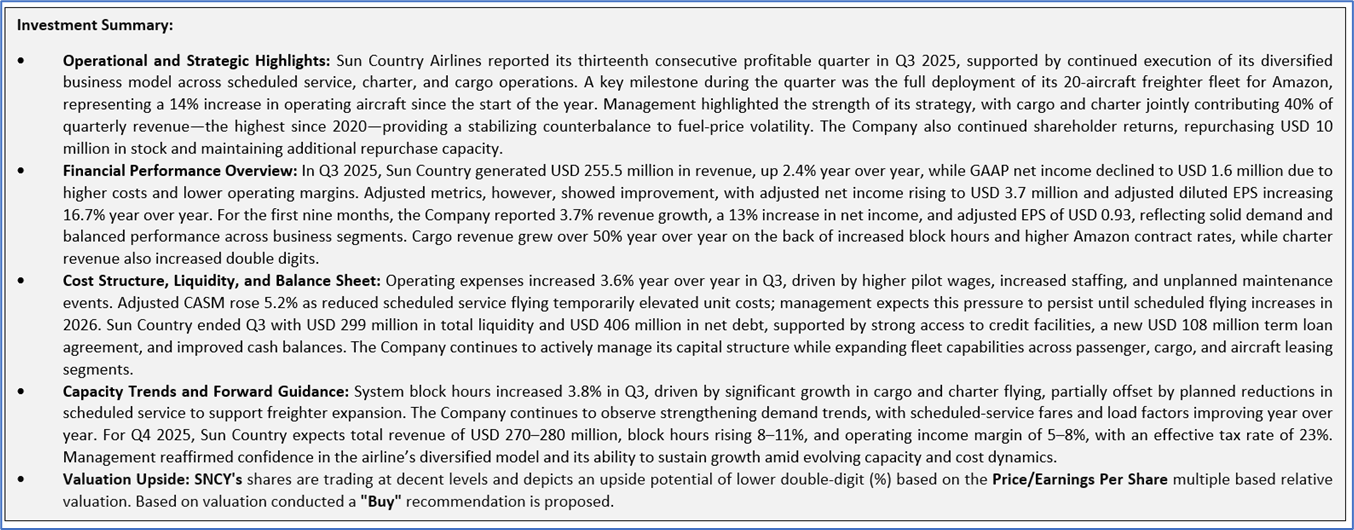
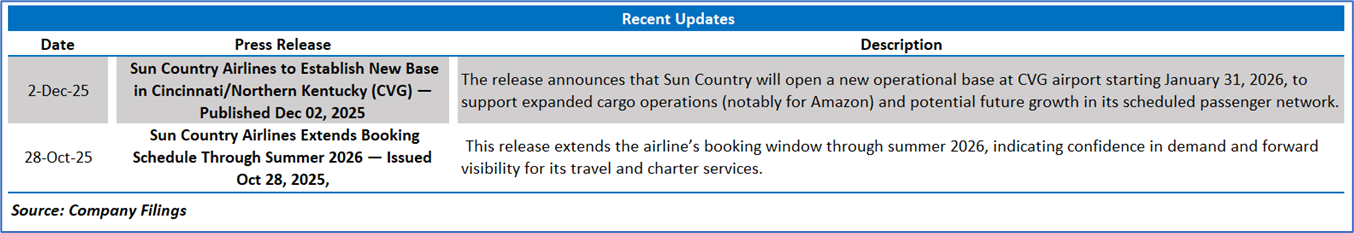
2.1 Recent Business Updates:
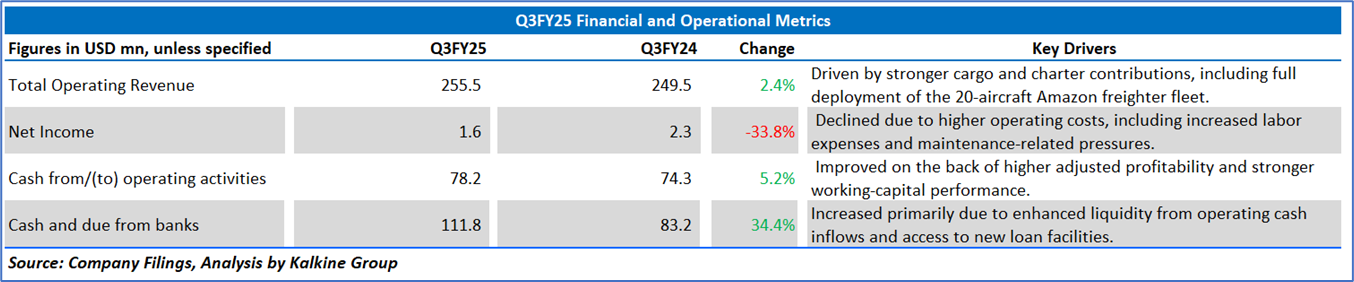
2.2 Q3FY25 Results Highlights (for the 03 months ending September 30, 2025): Below are some key financial highlights:
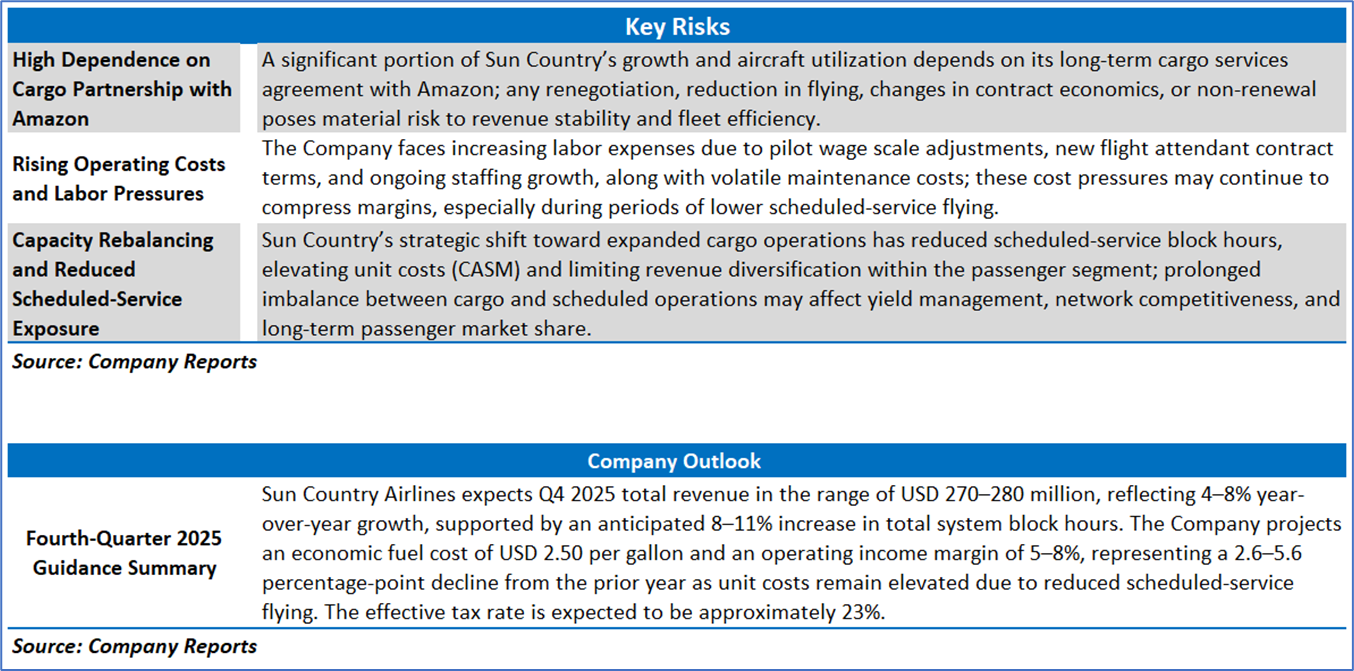
Section 3: Key Risks and Outlook:
Section 4: Stock Recommendation Summary
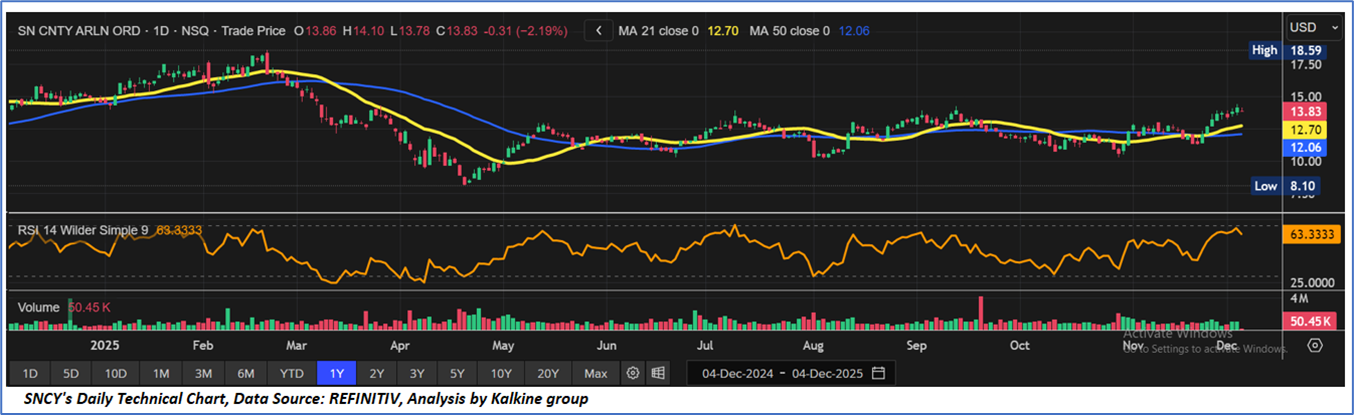
- Price Performance and Technical Summary
- Price Structure and Moving Averages: SNCY’s price trend has shifted from early-2025 weakness to a more constructive upward trajectory, with the stock now trading above both the 21-day and 50-day moving averages. The recent bullish crossover of these averages signals improving short-term trend strength and growing buyer participation.
- Momentum Indicators and RSI Behaviour: The RSI near 63 indicates firm but not overextended momentum, reflecting increased buying interest without pushing the stock into overbought territory. This upward movement in the RSI aligns with the stock’s recent price strength and supports a moderately positive technical outlook.
- Volume Profile and Market Participation: Volume has remained relatively steady, with modest increases accompanying the latest upward move, suggesting improving market engagement. While not yet signaling a decisive breakout, the gradual rise in volume supports the credibility of the emerging bullish bias
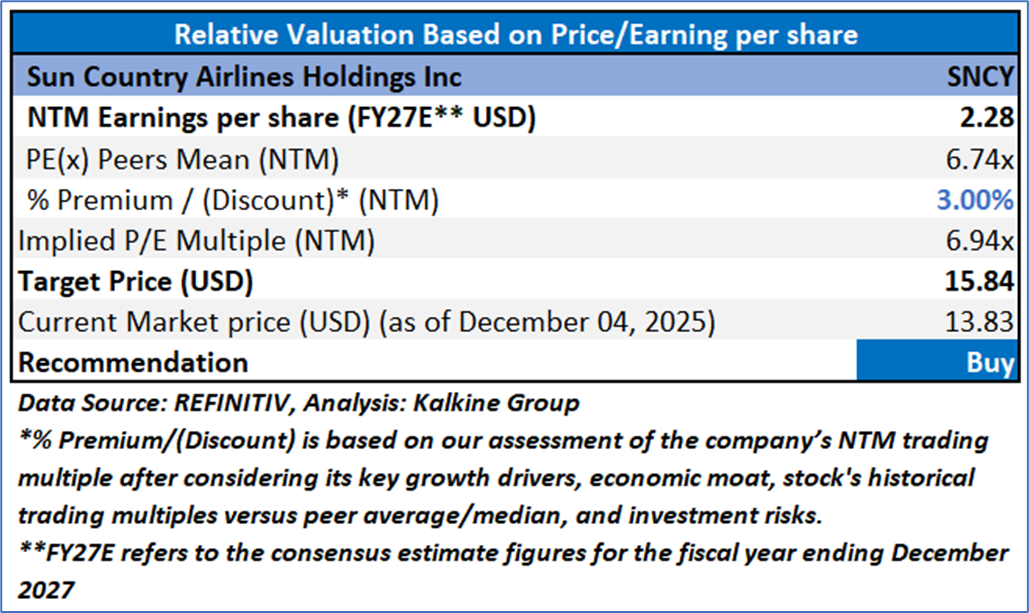
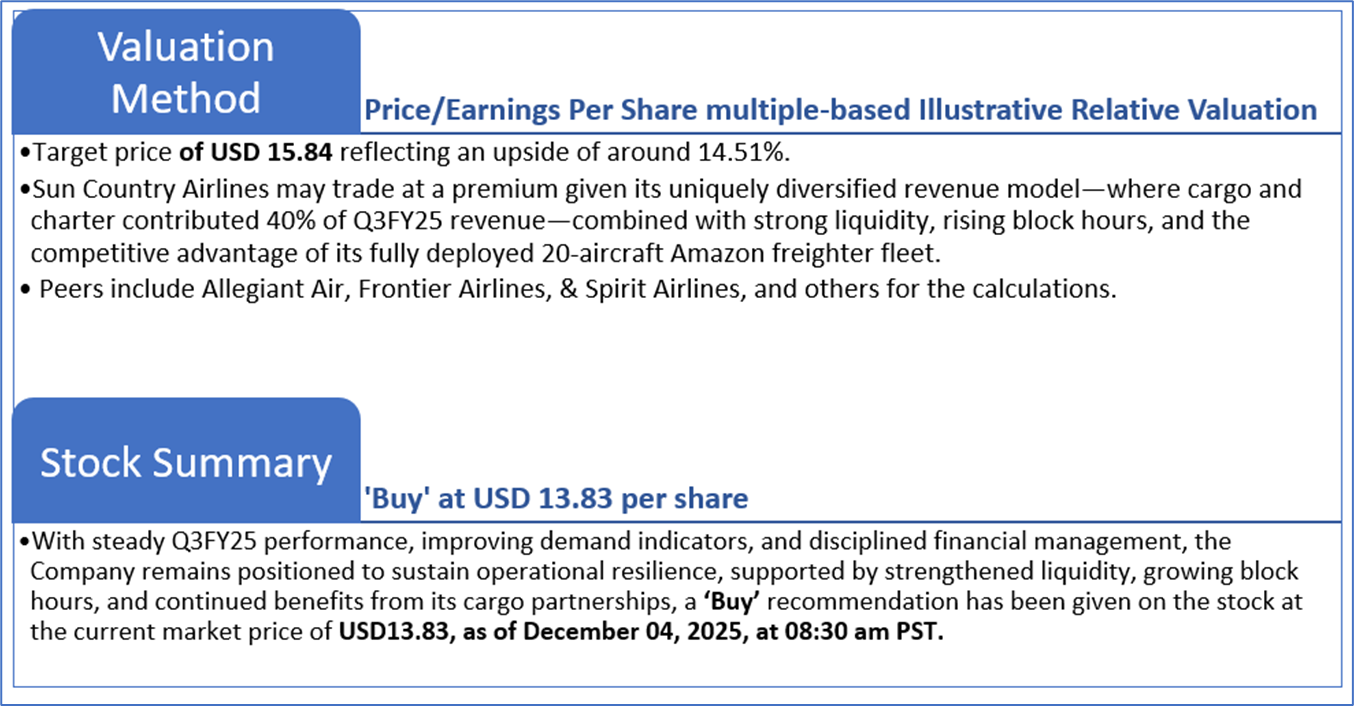
4.2 Fundamental Valuation
Valuation Methodology: Price/ Earnings Per Share Multiple Based Relative Valuation (Illustrative)
Markets are trading in a highly volatile zone currently due to certain macro-economic issues and geopolitical tensions prevailing. Therefore, it is prudent to follow a cautious approach while investing.
Note 1: Past performance is neither an indicator nor a guarantee of future performance.
Note 2: The reference date for all price data, currency, technical indicators, support, and resistance levels is December 04, 2025. The reference data in this report has been partly sourced from REFINITIV.
Note 3: Investment decisions should be made depending on an individual's appetite for upside potential, risks, holding duration, and any previous holdings. An 'Exit' from the stock can be considered if the Target Price mentioned as per the Valuation and or the technical levels provided has been achieved and is subject to the factors discussed above.
Note 4: Dividend Yield may vary as per the stock price movement.
Note 5: Kalkine reports are prepared based on the stock prices captured either from REFINITIV or Trading View. Typically, REFINITIV or Trading View may reflect stock prices with a delay which could be a lag of 25-30 minutes. There can be no assurance that future results or events will be consistent with the information provided in the report. The information is subject to change without any prior notice.
Technical Indicators Defined: -
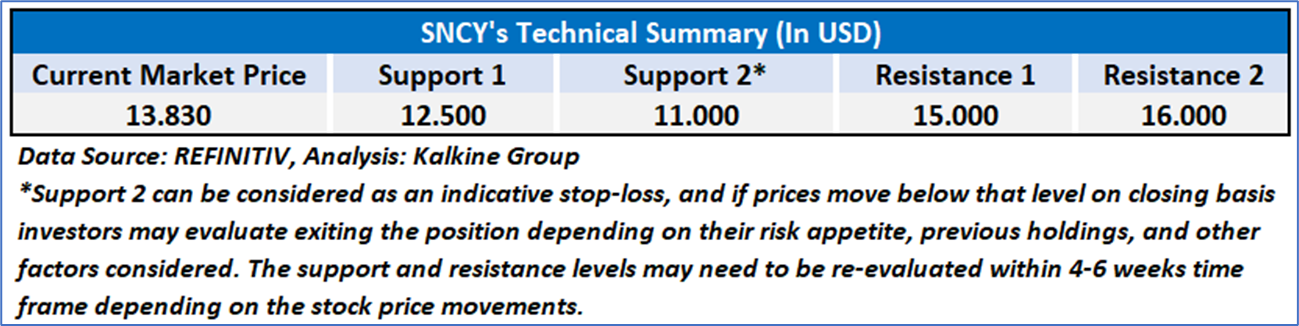
Support: A level at which the stock prices tend to find support if they are falling, and a downtrend may take a pause backed by demand or buying interest. Support 1 refers to the nearby support level for the stock and if the price breaches the level, then Support 2 may act as the crucial support level for the stock.
Resistance: A level at which the stock prices tend to find resistance when they are rising, and an uptrend may take a pause due to profit booking or selling interest. Resistance 1 refers to the nearby resistance level for the stock and if the price surpasses the level, then Resistance 2 may act as the crucial resistance level for the stock.
Stop-loss: It is a level to protect further losses in case of unfavourable movement in the stock prices.
Disclaimer-
This report has been issued by Kalkine Limited (Company number 07903332), a private limited company, incorporated in England and Wales ("Kalkine”). Kalkine.co.uk and associated pages are published by Kalkine. Kalkine is authorised and regulated by the Financial Conduct Authority under reference number 579414.
The information in this report and on the Kalkine website has been prepared from a wide variety of sources, which Kalkine, to the best of its knowledge and belief, considers accurate. Kalkine has made every effort to ensure the reliability of information contained in its reports, newsletters and websites. All information represents our views at the date of publication and may change without notice. The information in this report does not constitute an offer to sell securities or other financial products or a solicitation of an offer to buy securities or other financial products. Our reports contain non personalized recommendations to invest in securities and other financial products.
Kalkine does not offer financial advice based upon your personal financial situation or goals, and we shall not be held liable for any investment or trading losses you may incur by using the opinions expressed in our reports, publications, market updates, news alerts and corporate profiles. Kalkine does not intend to exclude any liability which it is not permitted to exclude under applicable law or regulation. Kalkine’s non-personalised advice does not in any way endorse or recommend individuals, investment products or services for your personal financial situation. You should discuss your portfolios and the risk tolerance level appropriate for your personal financial situation, with a professional authorised financial planner and adviser. You should be aware that the value of any investment and the income from it can go down as well as up and you may not get back the amount invested.
Please also read our Terms & Conditions for further information. Employees and/or associates of Kalkine and its related entities may hold interests in the securities or other financial products covered in this report or on the Kalkine website. Any such employees and associates are required to comply with certain safeguards, procedures and disclosures as required by law.
Kalkine Media Limited, an affiliate of Kalkine, may have received, or be entitled to receive, financial consideration in connection with providing information about certain entity(s) covered on its website including entities covered in this report.
Past performance is not a reliable indicator of future performance.

 Please wait processing your request...