Kalkine’s Global Tariff Report provides fully independent analysis and data-driven analysis of major global sectors affected by tariff changes, evaluating the implications these shifts may have on equity valuations across those industries. The report concentrates on trade-sensitive sectors that typically experience heightened investor scrutiny during periods of tariff uncertainty. It also identifies defensive and countercyclical segments that demonstrate relative resilience or may even outperform, amid disruptions to global trade flows.
As illustrated in the table below, several key sectors in different countries are directly impacted by the recent tariff announcement from President Trump.
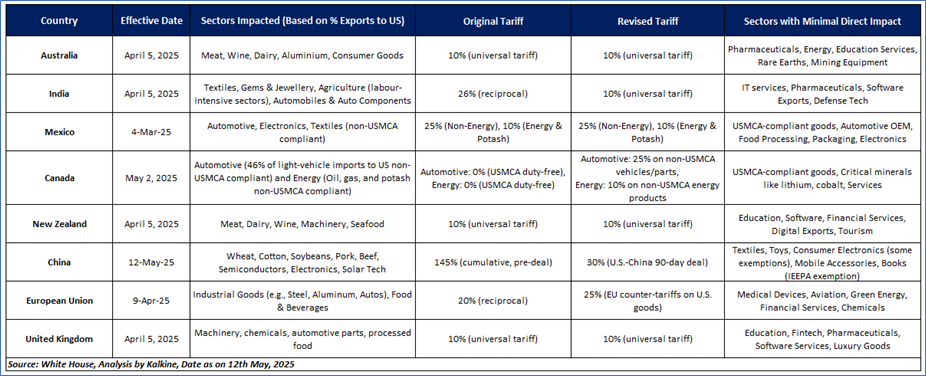 Latest Updates on Global Tariffs by Trump’s Administration
1. Baseline Tariff Structure and Temporary Suspension
- 10% Baseline Tariff: Under the International Emergency Economic Powers Act (IEEPA), a 10% levy on all imports remains in effect to address trade imbalances and non-reciprocal foreign tariffs, as enacted on April 5, 2025, per the White House executive order.
- 90-Day Suspension of Reciprocal Levies (Apr 9, 2025 – Jul 9, 2025): The additional country-specific surtaxes (ranging from 11% to 50%) for 57 countries were suspended on April 9, leaving only the 10% baseline tariff in place for most partners, as per WilmerHale’s report on April 11, 2025. However, a recent agreement between the U.S. and China has further adjusted tariffs on Chinese goods, reducing the effective rate to 30% for 90 days starting May 12, 2025, as reported by Reuters on May 12, 2025. Canada and Mexico remain subject to pre-existing elevated rates under separate IEEPA orders related to fentanyl and migration.
2. Sector-Specific Exclusions and Separate Tariff Regimes
- Energy and Minerals Exclusion: Oil, gas, potash, and copper are exempt from the 10% baseline tariff but are subject to tailored Section 232 duties, such as a 10% ad valorem rate on Canadian crude outside USMCA compliance, as confirmed by the White House on April 3, 2025.
- Pharmaceuticals Carve-Out: FDA-approved drugs remain excluded from the 10% baseline tariff, as per the White House executive order on April 3, 2025. However, Trump has hinted at a potential 25% tariff on imported pharmaceuticals, citing national security concerns, as noted in a Kiplinger article on May 6, 2025; this tariff remains under review with no implementation date confirmed as of May 12, 2025.
- Electronics Exemption: On April 11, 2025, President Trump expanded exemptions to include smartphones, computers, and other electronics under Annex II of the tariff order, sparing critical tech products from the baseline and reciprocal tariffs, as per the Trade Compliance Resource Hub on April 12, 2025.
3. Targeted Tariffs on Key Trade Partners
- China: The tariff on Chinese imports was raised to 145% effective April 10, 2025, as reported by WilmerHale on April 11, 2025. China retaliated with a 125% tariff on U.S. goods effective April 12, 2025, alongside rare earth export controls. However, a new U.S.-China deal announced on May 12, 2025, slashes these reciprocal tariffs, reducing the U.S. tariff on Chinese imports to 30% for 90 days starting May 12, 2025, as per Reuters. China has also lowered its tariffs on U.S. goods to 10% for the same period, according to posts on X reflecting the agreement.
- Canada and Mexico:
- Automotive Sector: A 25% tariff on non-USMCA vehicles and parts (e.g., engines, transmissions) remains in effect since March 26, 2025, as per the White House. Canada has imposed reciprocal duties on U.S. autos, with a phased approach targeting USD 107 billion worth of U.S. goods, as noted by the World Economic Forum on February 20, 2025.
- Energy: Non-USMCA oil and gas face a 10% tariff, as confirmed by the White House on April 3, 2025.
- EU Reciprocal Threat (Suspended until Jul 9): The EU’s planned 20% retaliatory tariff on U.S. steel, agriculture, and spirits remains paused, as per PBS News on April 4, 2025. The EU has indicated a willingness to negotiate, but countermeasures may resume if talks fail by July 9, 2025, as stated by European Commission President Ursula von der Leyen.
4. Other Updates
- Film Industry Tariff (May 5, 2025): A 100% tariff on foreign-made films was proposed on May 5, 2025, citing national security concerns and the decline of the domestic film industry due to international tax incentives. However, as of May 12, 2025, there is no confirmation of its implementation, and the proposal remains under review, with no further updates available from official sources.

What are the different types of Tariffs?

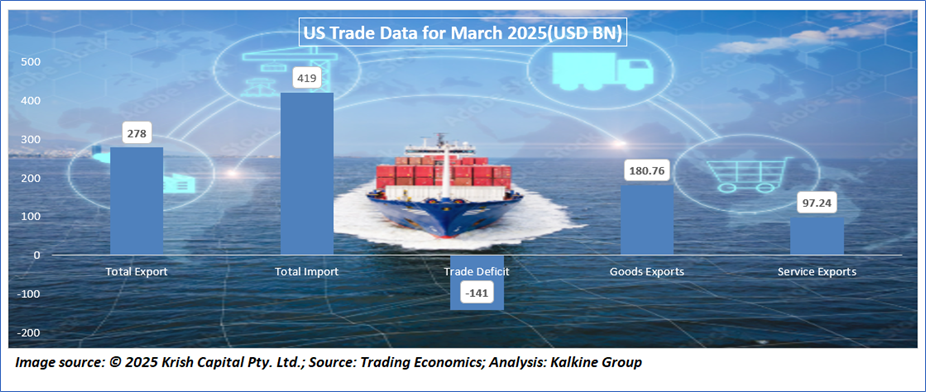
A Snapshot of USA’s Trade Size
As of early 2025, the United States faces a deepening trade imbalance, with a record USD 140 billion trade deficit in March and a current account deficit of USD 304 billion, equating to -3.9% of GDP. While exports held steady at USD 278 billion, imports surged to USD 419 billion, driven by strong consumer and industrial demand. Despite resilience in services (USD 76B surplus), auto exports, and FDI inflows (USD 76B), the growing reliance on foreign capital and a rising external debt of USD 27.6 trillion signal macroeconomic vulnerability. Further, escalating tariffs—particularly the 30% levy on Chinese goods—may strain trade relationships and pose downside risks to goods-exporting sectors, making cautious portfolio positioning essential.
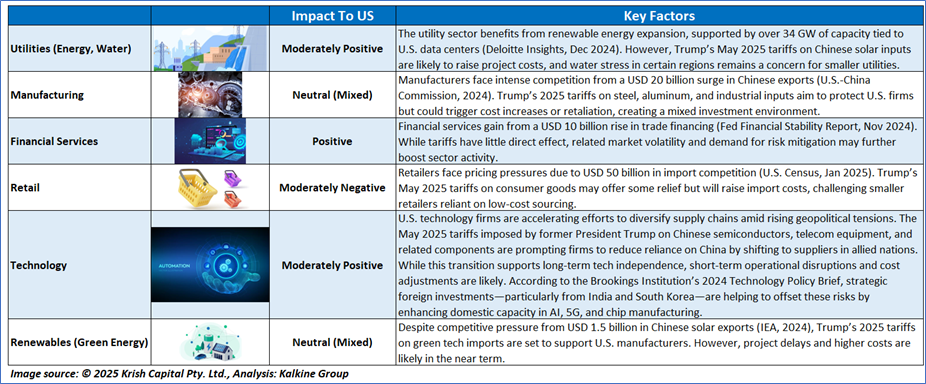
Impact of US Tariffs on Various Sectors
The U.S. economy is currently grappling with significant challenges, including high inflation, supply chain disruptions, and the effects of aggressive monetary policy from the Federal Reserve. Key sectors such as manufacturing, agriculture, and technology are feeling strain, particularly due to their dependence on global supply chains and export markets, with trade policies like tariffs on steel, aluminum, and electronics driving up costs for businesses and consumers alike. Despite these pressures, there’s cautious optimism in some quarters about market stabilization within the next year, though this is tempered by ongoing issues like labor shortages, energy price volatility, and political divisions. The Federal Reserve’s interest rate hikes aimed at curbing inflation—still above target levels—have slowed economic growth, raising recession risks, while strategic efforts such as trade agreements and supply chain diversification remain critical to fostering stability and mitigating prolonged uncertainty across these vital sectors.
Why does the US Semiconductor Sector look Attractive Amid Tariff Concerns?

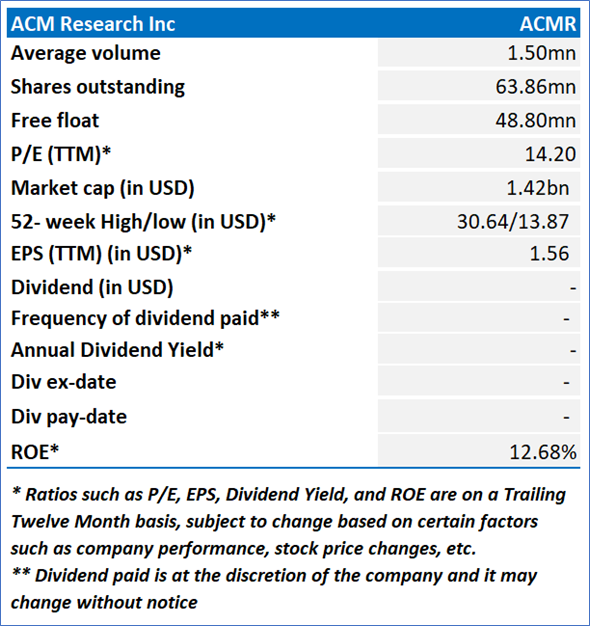
Amid elevated Market Volatility and Tariff pressures, ACM Research Inc (NADAQ: ACMR) stands out as our defensive pick within the Technology sector, supported by rigorous fundamental and technical research
Kalkine’s Global Tariff Report covers the Investment Highlights, Key Financial Metrics, Risks, Technical Analysis along with the Valuation, Target Price, and Recommendation on the ACM Research Inc (NASDAQ: ACMR).
Section 1: Company Overview and Fundamental Insights
1.1 Company Overview:
ACM Research, Inc. (NASDAQ: ACMR) develops, manufactures, and sells production equipment and provides service solutions for single-wafer or batch wet cleaning, electroplating, stress-free polishing, plasma-enhanced chemical vapor deposition (PECVD), track and thermal processes. The Company offers two principal models of wet wafer cleaning equipment based on its Space Alternated Phase Shift (SAPS) technology, Ultra C SAPS II and Ultra C SAPS V.
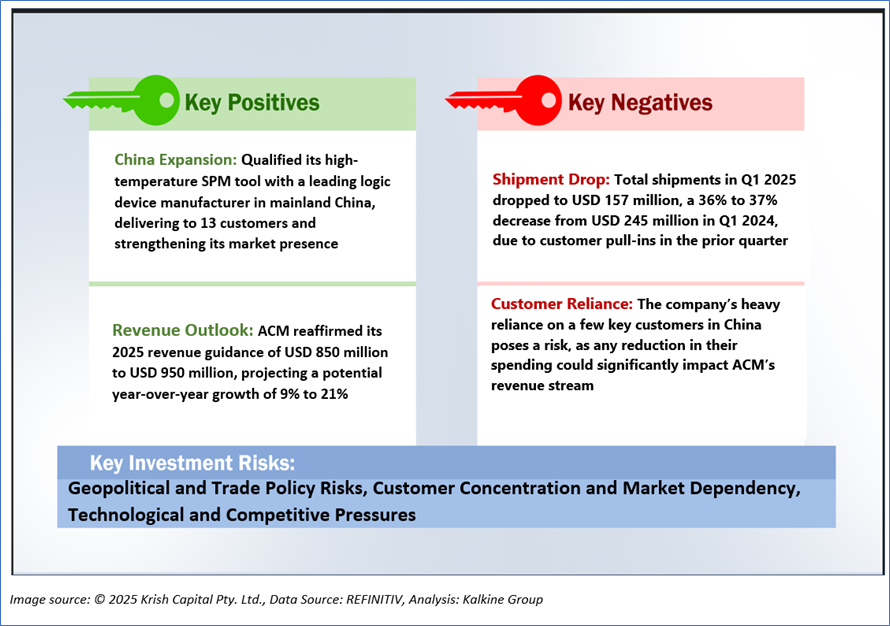
1.2 The Key Positives, Negatives, Investment Highlights and Risks

1.3 Top 10 Shareholders:
The top 10 shareholders together form ~38.23% of the total shareholding. The Vanguard Group, Inc. and BlackRock Institutional Trust Company, N.A. hold a maximum stake in the company at ~6.87% and ~6.17%, respectively.

1.4 Key Metrics:
ACM Research (ACMR) demonstrated a mixed financial performance from FY23 to FY24, with several key metrics reflecting operational improvements despite a slight decline in net profitability. The gross profit margin saw a modest increase from 49.53% to 50.06%, indicating improved cost efficiency in production. Profitability metrics also strengthened, as the EBITDA margin rose from 18.67% to 20.58% and the operating margin improved from 17.18% to 19.31%, showcasing enhanced operational efficiency. Income before tax margin edged up from 20.84% to 21.26%, but a higher income tax rate of 21.06% in FY24 (up from 16.66%) contributed to a dip in the net margin from 17.37% to 16.78%, reflecting increased tax burdens impacting overall profitability. On the positive side, return metrics improved, with return on average common equity increasing from 10.73% to 12.40%, return on average total assets rising from 7.10% to 7.84%, and return on invested capital growing from 8.34% to 9.31%, signaling better utilization of equity, assets, and capital to generate returns for stakeholders. Overall, while ACMR improved operational efficiency and returns, the higher tax rate slightly offset these gains, leading to a marginal decline in net margin.

Section 2: Business Updates and Financial Highlights
2.1 Recent Updates: The below picture gives an overview of the company’s recent activities, such as an announcement regarding dividend distribution.

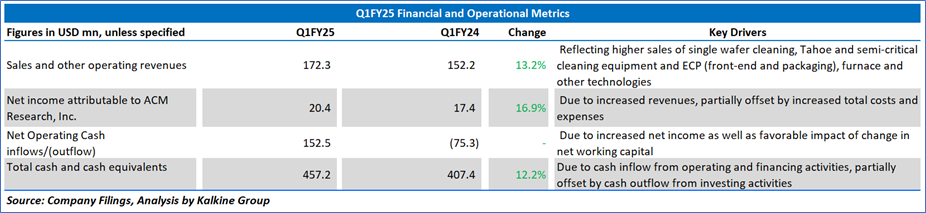
2.2 Insights on Q1 2025 Financial Performance:
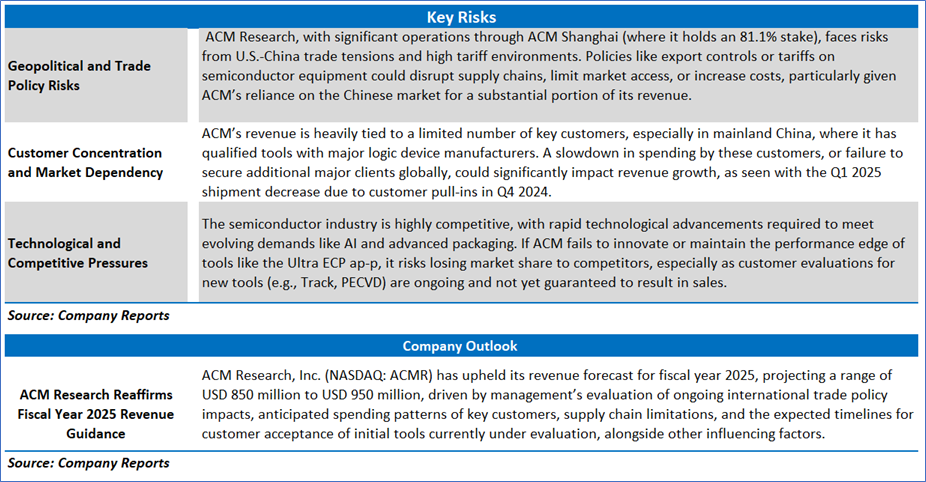
Section 3: Key Risks, Company Outlook:
Section 4: Stock Recommendation Summary:
4.1 Price Performance and Technical Summary:
- ACMR has generated a return of approx. 4.40% in past three months. Similarly, a return of approx. 27.76% in past six months.
- The stock is around the higher end of its 52-week range of USD 30.64 and 52-week low price of USD 13.87. Post the announcement of Q1FY25 results the stock has given a return of almost 21.86%, with the current price broken above an important resistance of USD 21- USD 22.
- The price is currently trading above both its long-term (200-day) SMA and its short-term (50-day) SMA, with the current RSI of 62.38.


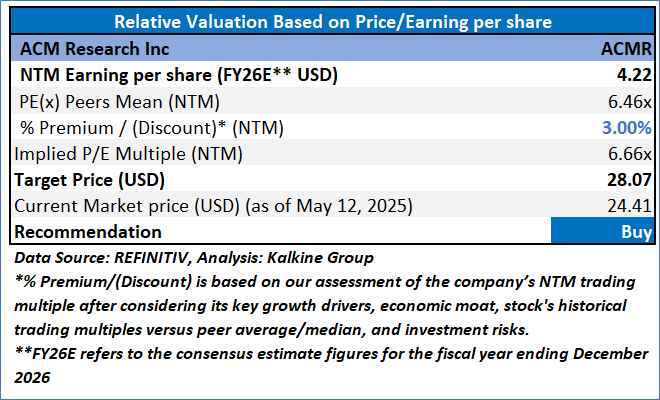
4.2 Fundamental Valuation
Valuation Methodology: Price/ Earnings Per Share Multiple Based Relative Valuation (Illustrative)

Note 1: Past performance is not a reliable indicator of future performance.
Note 2: The reference date for all price data, currency, technical indicators, support, and resistance levels as on May 12, 2025. The reference data in this report has been partly sourced from REFINITIV.
Note 3: Investment decisions should be made depending on an individual's appetite for upside potential, risks, holding duration, and any previous holdings. An 'Exit' from the stock can be considered if the Target Price mentioned as per the Valuation and or the technical levels provided has been achieved and is subject to the factors discussed above.
Note 4: Dividend Yield may vary as per the stock price movement.
Note 5: Kalkine reports are prepared based on the stock prices captured either from REFINITIV or Trading View. Typically, REFINITIV or Trading View may reflect stock prices with a delay which could be a lag of 25-30 minutes. There can be no assurance that future results or events will be consistent with the information provided in the report. The information is subject to change without any prior notice.
Technical Indicators Defined: -
Support: A level at which the stock prices tend to find support if they are falling, and a downtrend may take a pause backed by demand or buying interest.
Resistance: A level at which the stock prices tend to find resistance when they are rising, and the uptrend may take a pause due to profit booking or selling interest.
Stop-loss: In general, it is a level to protect further losses in case of any unfavorable movement in the stock prices.
Disclaimer-
This report has been issued by Kalkine Limited (Company number 07903332), a private limited company, incorporated in England and Wales ("Kalkine”). Kalkine.co.uk and associated pages are published by Kalkine. Kalkine is authorised and regulated by the Financial Conduct Authority under reference number 579414.
The information in this report and on the Kalkine website has been prepared from a wide variety of sources, which Kalkine, to the best of its knowledge and belief, considers accurate. Kalkine has made every effort to ensure the reliability of information contained in its reports, newsletters and websites. All information represents our views at the date of publication and may change without notice. The information in this report does not constitute an offer to sell securities or other financial products or a solicitation of an offer to buy securities or other financial products. Our reports contain non personalized recommendations to invest in securities and other financial products.
Kalkine does not offer financial advice based upon your personal financial situation or goals, and we shall not be held liable for any investment or trading losses you may incur by using the opinions expressed in our reports, publications, market updates, news alerts and corporate profiles. Kalkine does not intend to exclude any liability which it is not permitted to exclude under applicable law or regulation. Kalkine’s non-personalised advice does not in any way endorse or recommend individuals, investment products or services for your personal financial situation. You should discuss your portfolios and the risk tolerance level appropriate for your personal financial situation, with a professional authorised financial planner and adviser. You should be aware that the value of any investment and the income from it can go down as well as up and you may not get back the amount invested.
Please also read our Terms & Conditions for further information. Employees and/or associates of Kalkine and its related entities may hold interests in the securities or other financial products covered in this report or on the Kalkine website. Any such employees and associates are required to comply with certain safeguards, procedures and disclosures as required by law.
Kalkine Media Limited, an affiliate of Kalkine, may have received, or be entitled to receive, financial consideration in connection with providing information about certain entity(s) covered on its website including entities covered in this report.
Past performance is not a reliable indicator of future performance.

 Please wait processing your request...