Section 1: Company Overview and Fundamentals
1.1 Company Overview:
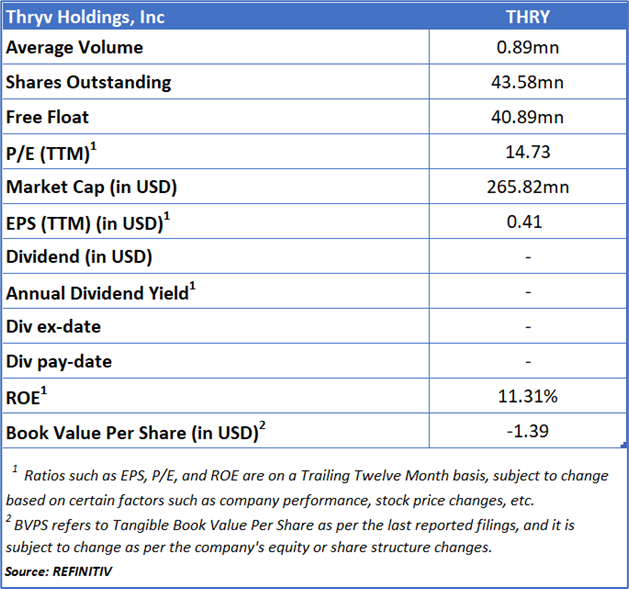
Thryv Holdings, Inc (NASDAQ: THRY) delivers software-as-a-service (SaaS) solutions tailored for small and medium-sized businesses. The company operates through two primary segments: Thryv Marketing Services, encompassing its Print and Digital advertising offerings, and Thryv SaaS, which comprises its comprehensive all-in-one business management platform. This platform includes tools such as Command Center, Business Center, Marketing Center, ThryvPay, various add-on modules, and Keap’s automation capabilities.
Kalkine’s Low Carbon Research Report covers the Investment Highlights, Low Carbon Emission Initiatives, Key Financial Metrics, Risks, and Technical Analysis along with the Valuation, Target Price, and Recommendation on the stock.
Stock Performance:
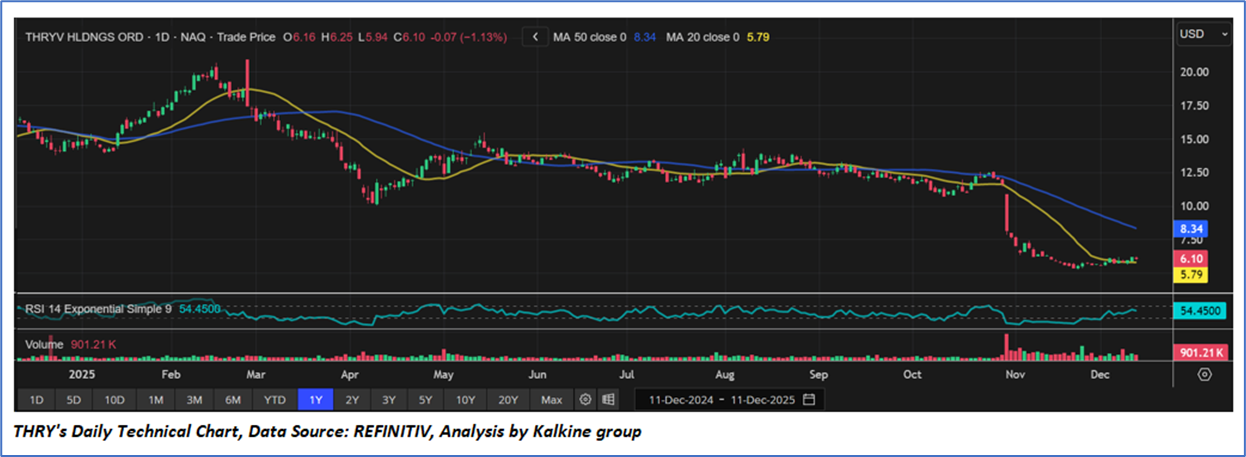
- The stock has been in a persistent downtrend since late August, with a sharp acceleration downward in early November. Since mid-November, price action has flattened out between USD 5.70–6.30. This tight consolidation suggests sellers are losing strength, possibly forming a base-building pattern
- 20-day MA is at USD 5.79 while 50-day MA is at USD 8.34. The 20-day MA is far below the 50-day MA, maintaining a bearish alignment (downside momentum). The price at USD 6.10 remains below the 50-day MA, which is trending downward, meaning the stock is still in a long-term downtrend and has not yet entered a recovery phase.
- The RSI (14) is around 54, which is neutral. This indicates that the momentum has recovered from oversold levels seen during the November crash. Further, there is no overbought condition, leaving room for upside if buyers step in.
- The massive sell volume in early November corresponds with the steep price decline. After that event, volume has contracted significantly, which is typical in bottom-formation phases. Lack of new sellers can be a positive sign, but a trend reversal requires increasing buy volume, which is not yet visible.
1.2 Why do Low Carbon Emissions matter?
The shift toward a low-carbon economy is one of the most significant challenges of current time, spurred by the urgent need to combat climate change and reduce the environmental impact of corporate activities. This report covers the US-listed low-carbon emission company Thryv Holdings, Inc (NASDAQ: THRY), that is committed to sustainability and responsible environmental practices.
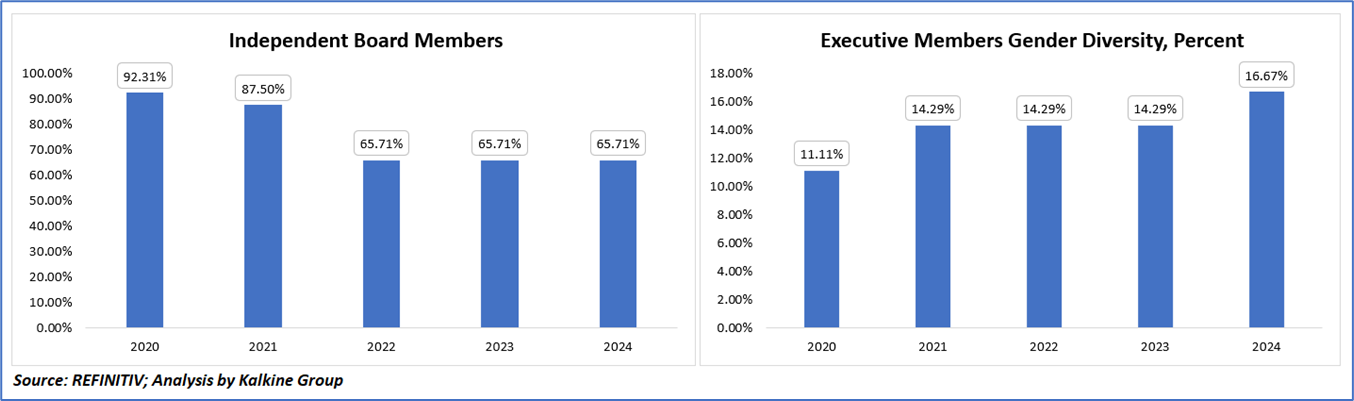
Carbon and Waste Management - Key Metrics
The governance metrics for Thryv Holdings, Inc. present a mixed but informative picture. The proportion of independent board members has declined notably from 92.31% in 2020 to 65.71% from 2022 through 2024, indicating a shift from a highly autonomous board structure to one that, while still compliant with Nasdaq’s requirement for majority independence, reflects reduced oversight strength compared with earlier years. In contrast, executive gender diversity shows gradual improvement, increasing from 11.11% in 2020 to 16.67% in 2024, demonstrating steady progress toward more inclusive leadership representation, though still below broader industry diversity benchmarks. Taken together, these trends suggest that while Thryv continues to uphold governance fundamentals, opportunities exist to reinforce board independence and accelerate diversity initiatives to align more closely with evolving ESG expectations and strengthen overall governance effectiveness.
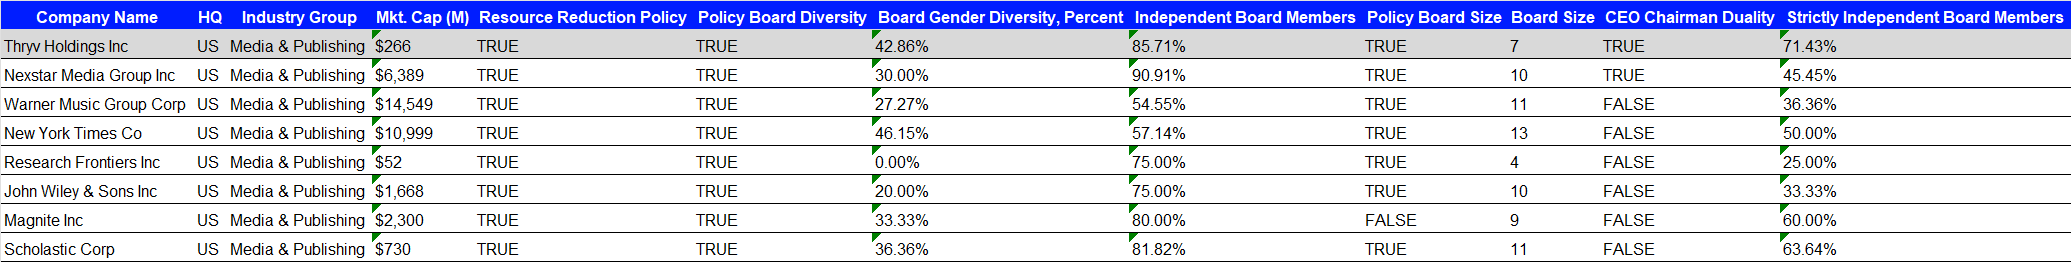
Peer Comparison:
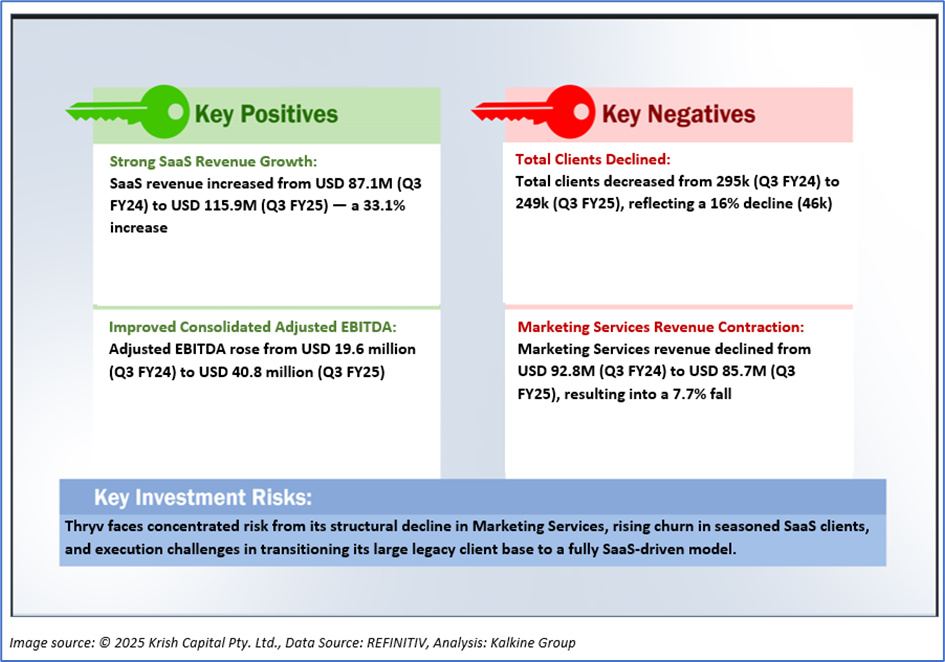
1.2 The Key Positives, Negatives, and Investment summary
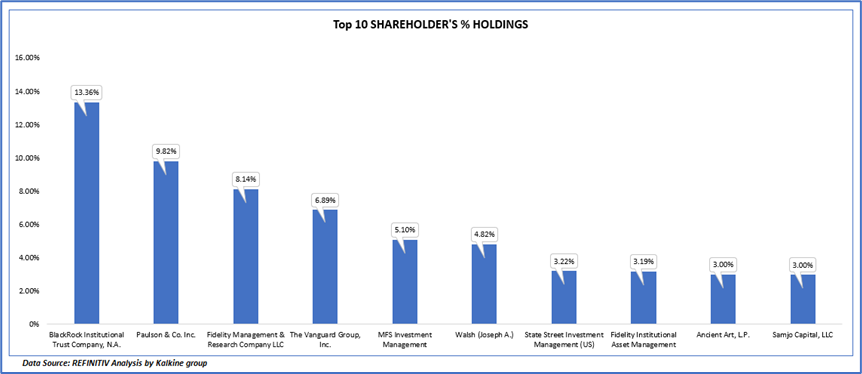
1.3 Top 10 shareholders:
The top 10 shareholders together form ~60.54% of the total shareholding, signifying concentrated shareholding. BlackRock Institutional Trust Company, N.A. and Paulson & Co. Inc. are the biggest shareholders, holding the maximum stake in the company at 13.36% and 9.82%, respectively.
1.4 Key Metrics
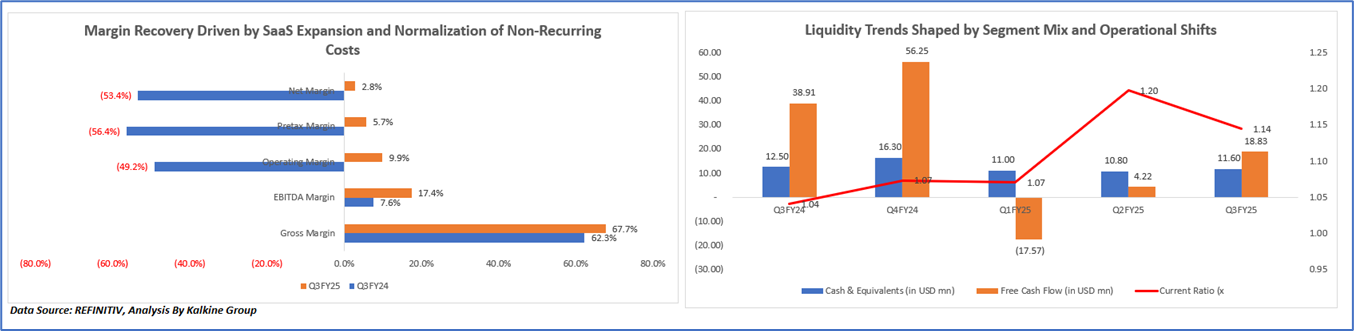
The Liquidity profile of the company reflects the combined impact of Thryv’s seasonal billing patterns, SaaS-led operational performance, and working capital cycles. Cash and Free Cash Flow strengthened sharply in Q4 FY24 due to higher year-end Marketing Services billings and the absence of impairment charges, but Free Cash Flow turned negative in Q1 FY25 as receivable collections softened, sales declined, and integration-related costs increased. Liquidity improved in Q2 FY25 as SaaS profitability rose, working capital normalized, and interest and tax payments declined, leading to a peak in the current ratio. In Q3 FY25, Free Cash Flow rose again on the back of strong SaaS EBITDA growth and cost efficiencies; however, the current ratio eased slightly as expanding SaaS activity increased short-term liabilities faster than cash balances.
Further, the profitability chart illustrates a broad recovery across all profitability margins in Q3 FY25 compared with Q3 FY24, largely due to the absence of the prior year’s USD 83.1 million impairment charge, which had severely depressed operating, pretax, and net margins in Q3 FY24. As non-recurring costs normalized, margins rebounded, further supported by stronger SaaS performance driven by higher ARPU, expanded client conversions, and improved cost efficiencies. Gross and EBITDA margins improved meaningfully as SaaS became a larger share of the revenue mix while print-related costs continued to decline. These combined factors resulted in materially stronger operating leverage and a return to positive net profitability in Q3 FY25.
Section 2: Business Updates and Corporate Business Highlights
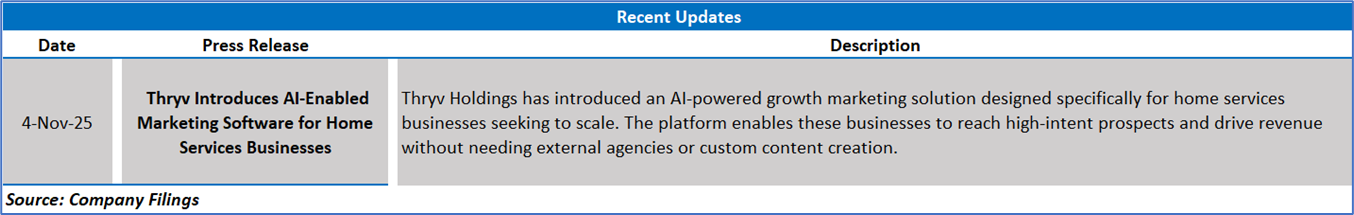
2.1 Key Business Updates:
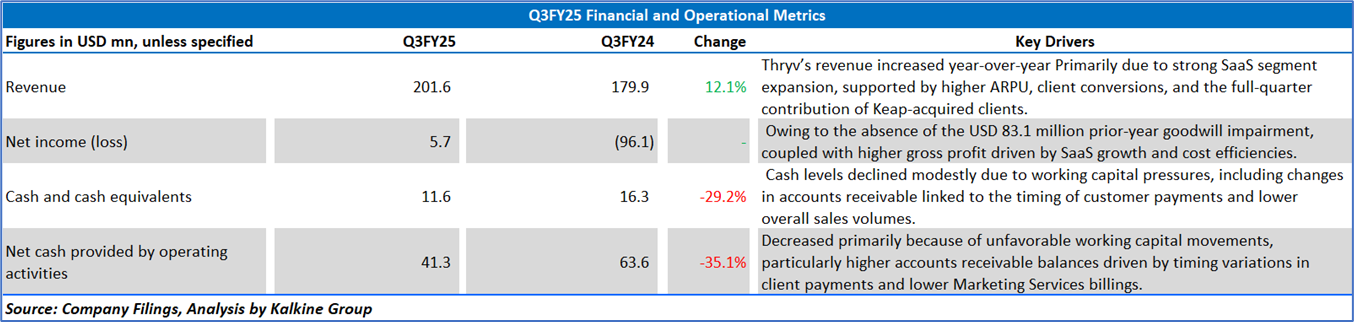
2.2 Insights of Q3 FY25:
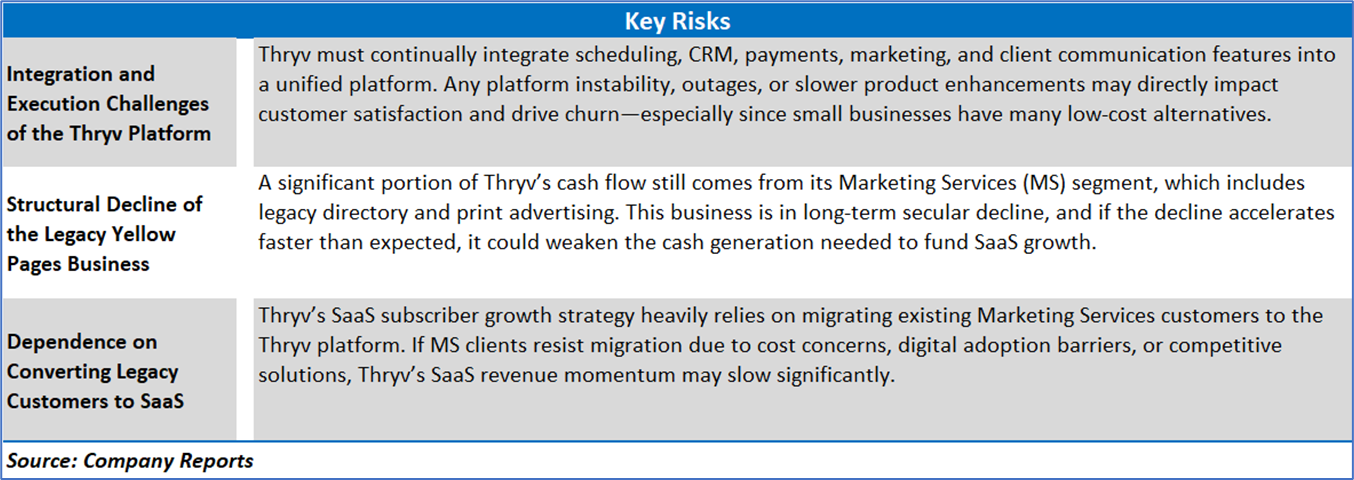
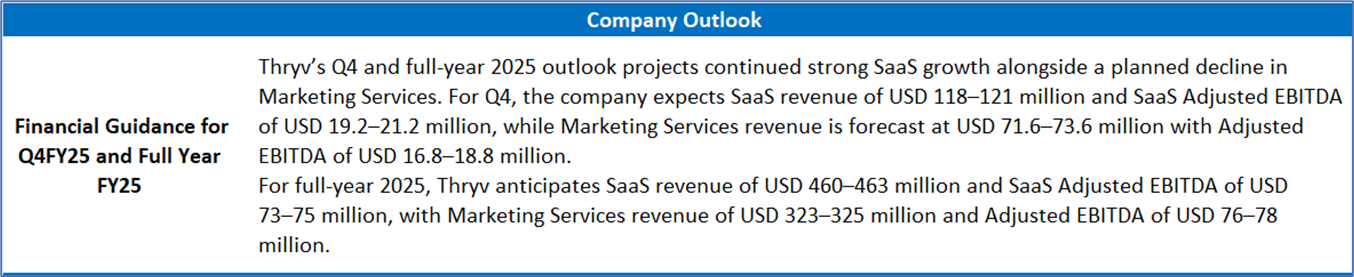
Section 3: Key Risks & Outlook
Section 4: Stock Recommendation Summary:
4.1 Price Performance and Technical Summary:
Stock Performance:
- The stock has been in a persistent downtrend since late August, with a sharp acceleration downward in early November. Since mid-November, price action has flattened out between USD 5.70–6.30. This tight consolidation suggests sellers are losing strength, possibly forming a base-building pattern
- 20-day MA is at USD 5.79 while 50-day MA is at USD 8.34. The 20-day MA is far below the 50-day MA, maintaining a bearish alignment (downside momentum). The price at USD 6.10 remains below the 50-day MA, which is trending downward, meaning the stock is still in a long-term downtrend and has not yet entered a recovery phase.
- The RSI (14) is around 54, which is neutral. This indicates that the momentum has recovered from oversold levels seen during the November crash. Further, there is no overbought condition, leaving room for upside if buyers step in.
- The massive sell volume in early November corresponds with the steep price decline. After that event, volume has contracted significantly, which is typical in bottom-formation phases. Lack of new sellers can be a positive sign, but a trend reversal requires increasing buy volume, which is not yet visible.
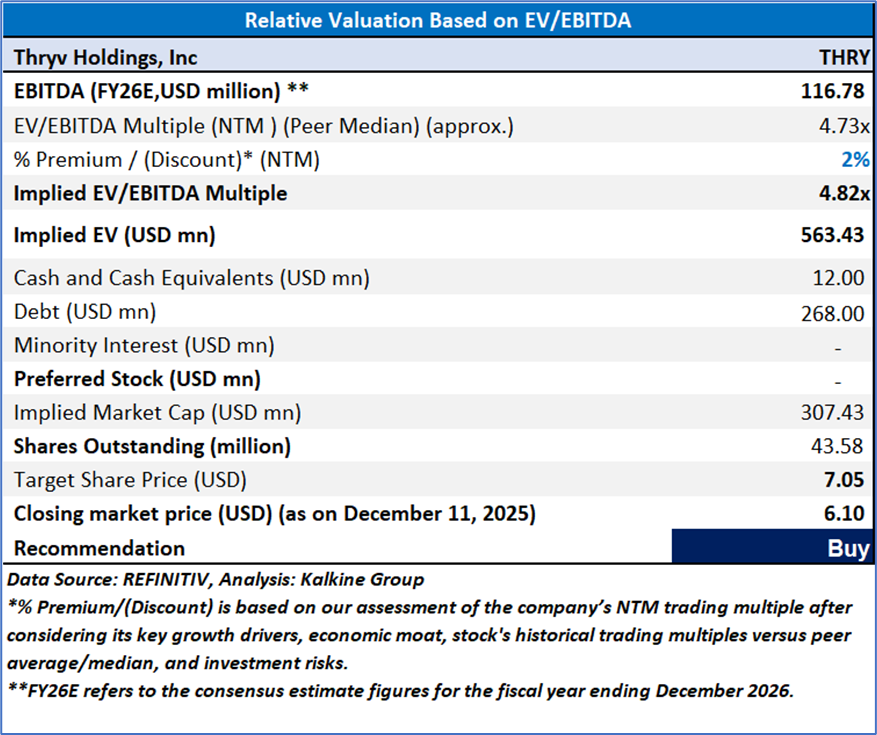
4.2 Fundamental Valuation
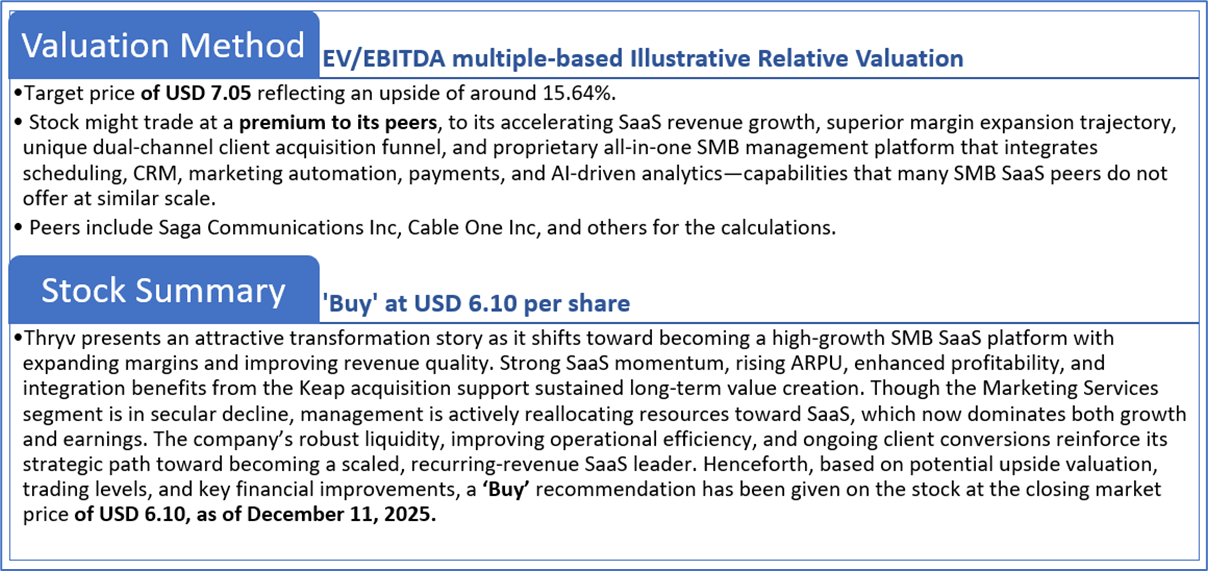
Valuation Methodology: EV/EBITDA Multiple Based Relative Valuation
Markets are trading in a highly volatile zone currently due to certain macroeconomic issues and geopolitical tensions prevailing. Therefore, it is prudent to follow a cautious approach while investing.
Note 1: Past performance is not a reliable indicator of future performance.
Note 2: The reference date for all price data, currency, technical indicators, support, and resistance levels is Dec 11, 2025. The reference data in this report has been partly sourced from REFINITIV.
Note 3: Investment decisions should be made depending on an individual's appetite for upside potential, risks, holding duration, and any previous holdings. An 'Exit' from the stock can be considered if the Target Price mentioned as per the Valuation and or the technical levels provided has been achieved and is subject to the factors discussed above.
Note 4: The report publishing date is as per the Pacific Time Zone.
Technical Indicators Defined: -
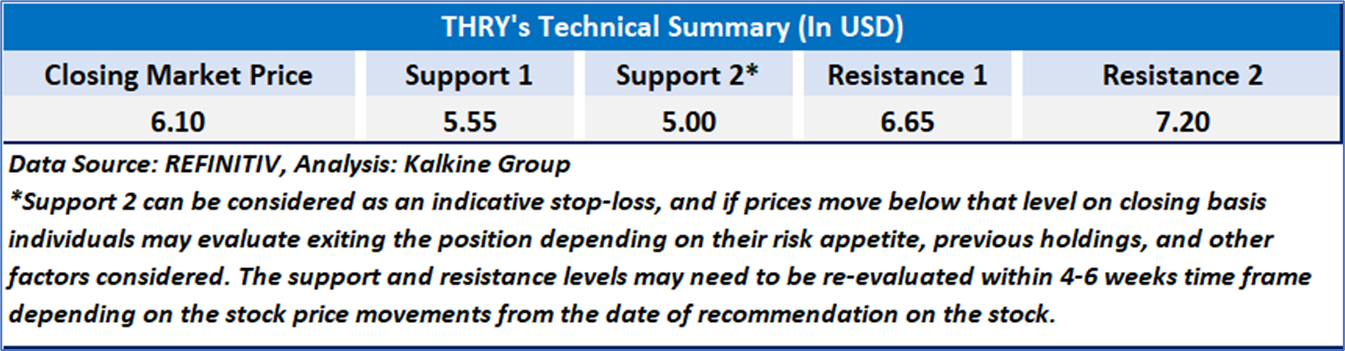
Support: A level at which the stock prices tend to find support if they are falling, and a downtrend may take a pause backed by demand or buying interest. Support 1 refers to the nearby support level for the stock and if the price breaches the level, then Support 2 may act as the crucial support level for the stock.
Resistance: A level at which the stock prices tend to find resistance when they are rising, and an uptrend may take a pause due to profit booking or selling interest. Resistance 1 refers to the nearby resistance level for the stock and if the price surpasses the level, then Resistance 2 may act as the crucial resistance level for the stock.
Stop-loss: It is a level to protect against further losses in case of unfavorable movement in the stock prices.
Disclaimer-
This report has been issued by Kalkine Limited (Company number 07903332), a private limited company, incorporated in England and Wales ("Kalkine”). Kalkine.co.uk and associated pages are published by Kalkine. Kalkine is authorised and regulated by the Financial Conduct Authority under reference number 579414.
The information in this report and on the Kalkine website has been prepared from a wide variety of sources, which Kalkine, to the best of its knowledge and belief, considers accurate. Kalkine has made every effort to ensure the reliability of information contained in its reports, newsletters and websites. All information represents our views at the date of publication and may change without notice. The information in this report does not constitute an offer to sell securities or other financial products or a solicitation of an offer to buy securities or other financial products. Our reports contain non personalized recommendations to invest in securities and other financial products.
Kalkine does not offer financial advice based upon your personal financial situation or goals, and we shall not be held liable for any investment or trading losses you may incur by using the opinions expressed in our reports, publications, market updates, news alerts and corporate profiles. Kalkine does not intend to exclude any liability which it is not permitted to exclude under applicable law or regulation. Kalkine’s non-personalised advice does not in any way endorse or recommend individuals, investment products or services for your personal financial situation. You should discuss your portfolios and the risk tolerance level appropriate for your personal financial situation, with a professional authorised financial planner and adviser. You should be aware that the value of any investment and the income from it can go down as well as up and you may not get back the amount invested.
Please also read our Terms & Conditions for further information. Employees and/or associates of Kalkine and its related entities may hold interests in the securities or other financial products covered in this report or on the Kalkine website. Any such employees and associates are required to comply with certain safeguards, procedures and disclosures as required by law.
Kalkine Media Limited, an affiliate of Kalkine, may have received, or be entitled to receive, financial consideration in connection with providing information about certain entity(s) covered on its website including entities covered in this report.
Past performance is not a reliable indicator of future performance.

 Please wait processing your request...