Company Overview: Centrus Energy Corp. (NYSE: LEU) is a supplier of nuclear fuel components for the nuclear power industry. Its segments include Low-Enriched Uranium (LEU) and Technical Solutions. Upwork Inc. (NYSE: UPWK) operates a working marketplace, which connects businesses with independent talent. The Company's independent talent refers to the talent that includes independent professionals and agencies of varying sizes.
This Report covers the Price Action, Technical Indicators Analysis along with the Target Levels, Stop Loss, Support Levels, Resistance Levels, and Recommendations on these two stocks.
US Markets Round-Up
This week, the Russell 3000 index, an important benchmark of the US stock market across market capitalizations, started the week on a negative note and continued the momentum. The index made a high of 3668.62 during the week and settled at 3660.43 with a week-to-date (WTD) loss of ~1.183 percent on Aug 21, 2025. Other major indices, such as S&P 500 and NASDAQ Composite, witnessed downside movement for the week. On Aug 21, 2025, the S&P 500 index settled at ~6370.18 with a WTD loss of ~1.23 percent, while the NASDAQ Composite Index settled at 21100.31 with a WTD loss of ~2.417 percent.
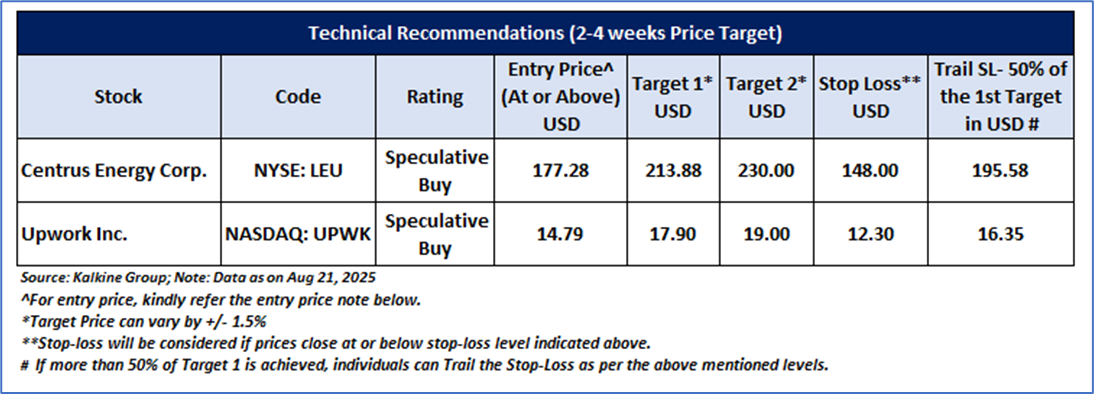
Having understood the US market performance over the week, taking cues from major global news, and based on technical analysis of the Russell 3000 index for the upcoming week, now let’s have a look at the two US-listed stocks to pick from the technical standpoint. Noted below recommendations are based on the entry price, target prices, and stop-loss for Centrus Energy Corp. (NYSE: LEU) and Upwork Inc. (NASDAQ: UPWK) for the next 2-4 weeks duration:
Centrus Energy Corp. (NYSE: LEU)
Noted below are the key price indicators for the stock:
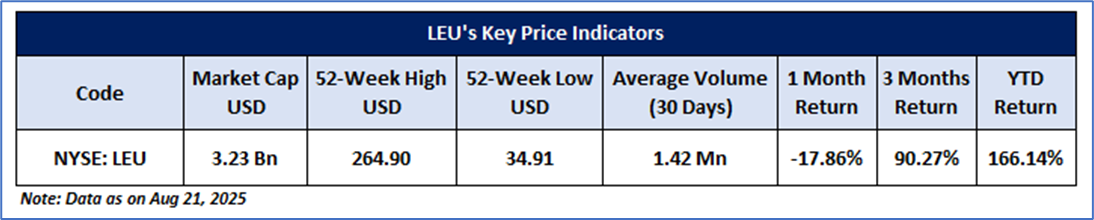
Price Action Analysis (on the Daily Chart)
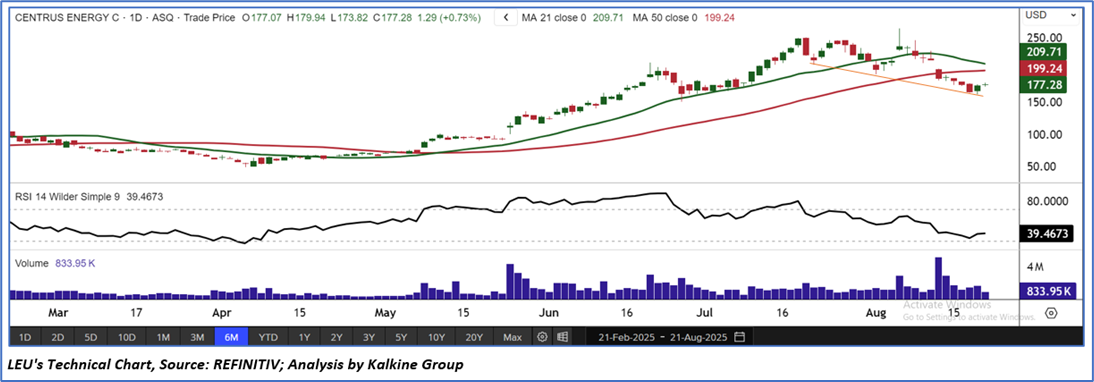
LEU's stock price is presently near its descending trendline support levels, suggesting a potential upward movement in the near future. The next significant resistance is at USD 213.88, which the stock is likely to test within the next 2-4 weeks, possibly prompting a reaction. Should the stock break above USD 213.88, it could attract increased buying interest, potentially pushing its upward trend even higher.
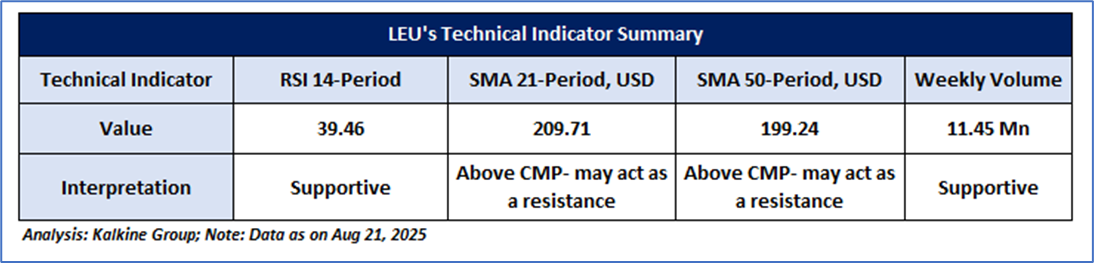
Technical Indicators Analysis (On the Daily Chart)
On the daily chart, the RSI (14-period) is currently below the midpoint with a reading of 39.46 and may potentially move higher. Additionally, trading volumes suggest supporting signs for an imminent upward movement. Moreover, the prices are trading below the 21-period and 50-period SMAs, which are likely to act as near-term resistance levels.
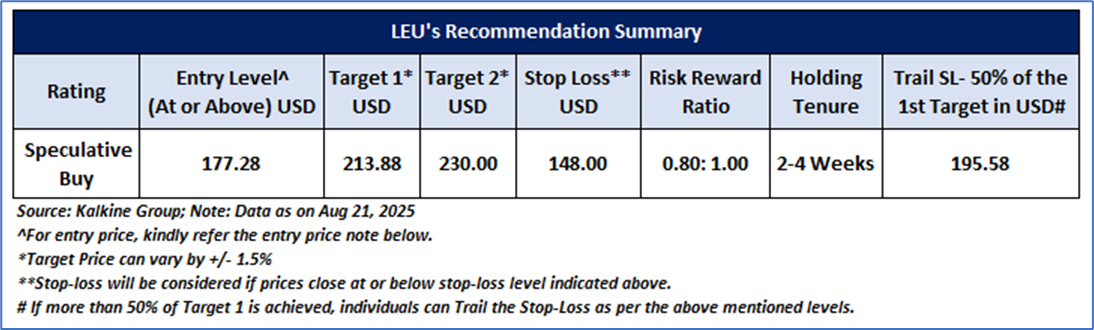
General Recommendation
As per the above-mentioned price action and technical indicators analysis, Centrus Energy Corp. (NYSE: LEU) is looking technically well-placed on the chart, and a ‘Speculative Buy’ recommendation has been given on the stock. Investment decision should be made depending on an individual’s appetite for upside potential, risks, and any previous holdings. This recommendation is purely based on technical analysis, and fundamental analysis has not been considered in this report. The summary of recommendations is as follows:
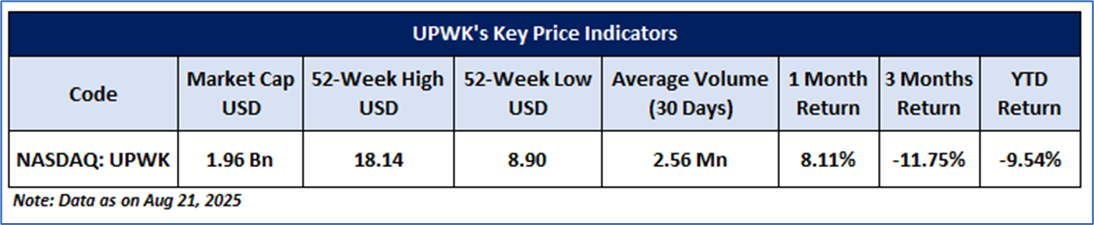
Upwork Inc. (NASDAQ: UPWK)
Noted below are the key price indicators for the stock:
Price Action Analysis (on the Daily Chart)
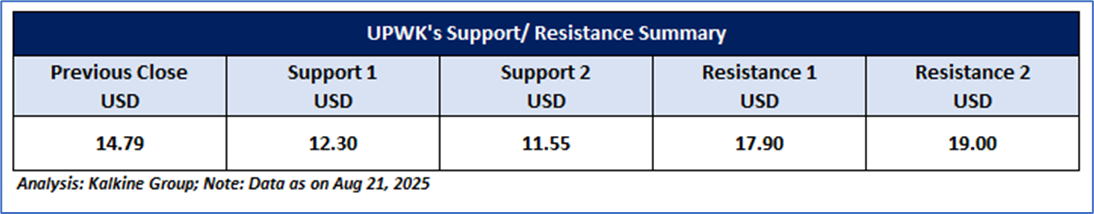
UPWK's stock price found support at key levels and gradually moved higher, forming a swing high on the daily chart, indicating the potential for further upside in the near term. The next major resistance is at USD 17.90. Over the next 2-4 weeks, the stock is expected to test this level, which could lead to a reaction. If the stock successfully breaks above USD 17.90, it may attract increased buying interest and continue its upward momentum.
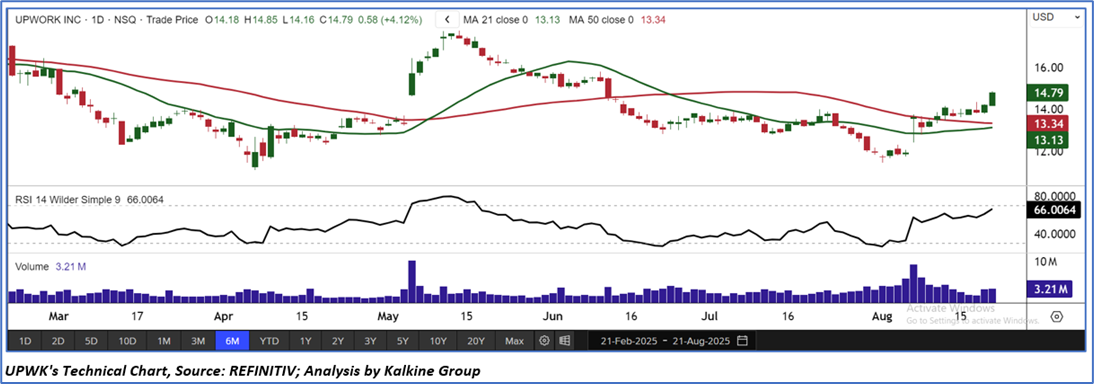
Technical Indicators Analysis (On the daily Chart)
On the daily chart, the RSI (14-period), a leading indicator, is currently at 66.00, indicating a potential positive bias. Additionally, trading volumes seem to support an imminent upward movement. Moreover, the prices are trading above the 21-period and 50-period SMAs, which are likely to act as near-term resistance levels.
General Recommendation
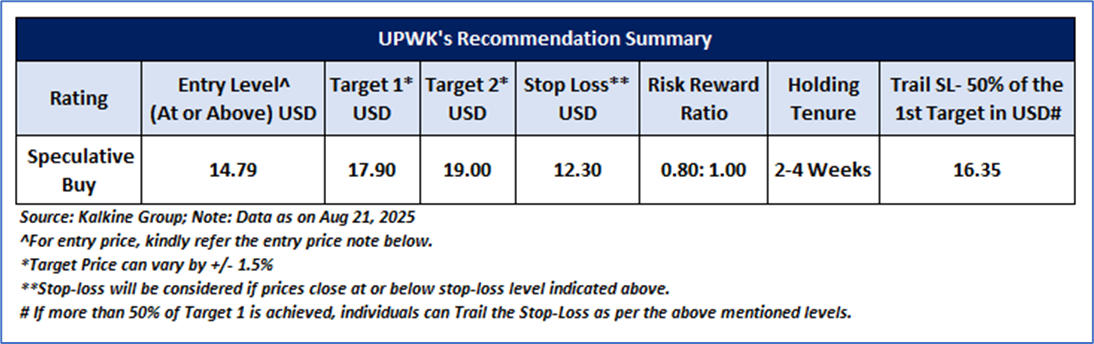
As per the above-mentioned price action and technical indicators analysis, Upwork Inc. (NASDAQ: UPWK) is looking technically well-placed on the chart, and a ‘Speculative Buy’ recommendation has been given on the stock. Investment decision should be made depending on an individual’s appetite for upside potential, risks, and any previous holdings. This recommendation is purely based on technical analysis, and fundamental analysis has not been considered in this report. The summary of recommendations is as follows:
Upcoming Major Global Economic Events
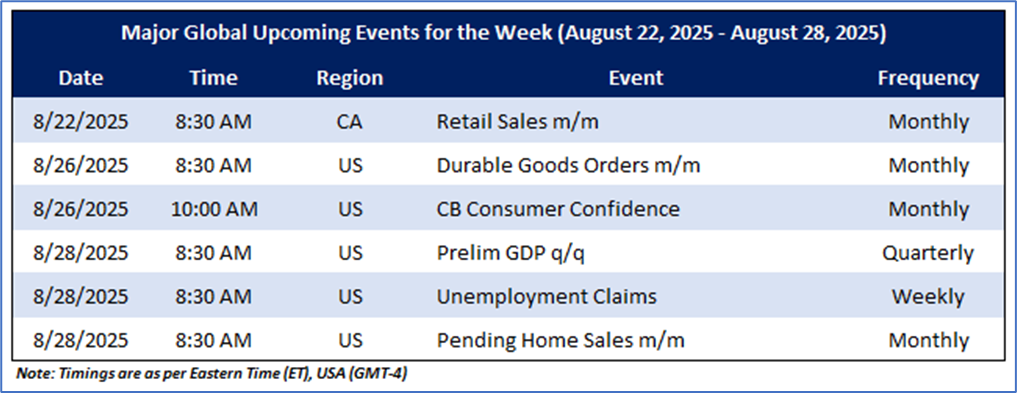
Market events occur on a day-to-day basis depending on the frequency of the data and generally include an updates GDP, Unemployment Data, etc. Noted below are the upcoming week's major global economic events that could impact the Russell 3000 Index and stocks’ prices:
Related Risks: This report may be looked at from a high-risk perspective and recommendations are provided for a short duration. Recommendations provided in this report are solely based on technical parameters, and the fundamental performance of the stocks has not been considered in the decision-making process. Other factors which could impact the stock prices include market risks, regulatory risks, interest rates risks, currency risks, social and political instability risks etc.
Note 1: Individuals can consider exiting from the stock if the Target Price or Stop loss mentioned as per the technical analysis has been achieved and subject to the factors discussed above.
Note 2: How to Read the Charts?
The Green colour line reflects the 21-period moving average while the red line indicates the 50- period moving average. SMA helps to identify existing price trends. If the prices are trading above the 21-period and 50-period moving average, then it shows prices are currently trading in a bullish trend.
The Black colour line in the chart's lower segment reflects the Relative Strength Index (14-Period) which indicates price momentum and signals momentum in trend. A reading of 70 or above suggests overbought status, while a reading of 30 or below suggests an oversold status.
The Blue colour bars in the chart’s lower segment show the volume of the stock. The volume is the number of shares that changed hands during a given day. Stocks with high volumes are more liquid than stocks with lesser volume as liquidity in stocks helps in easier and faster execution of the order.
The Orange colour lines are the trend lines drawn by connecting two or more price points and used for trend identification purposes. The trend line also acts as a line of support and resistance.
Technical Indicators Defined: -
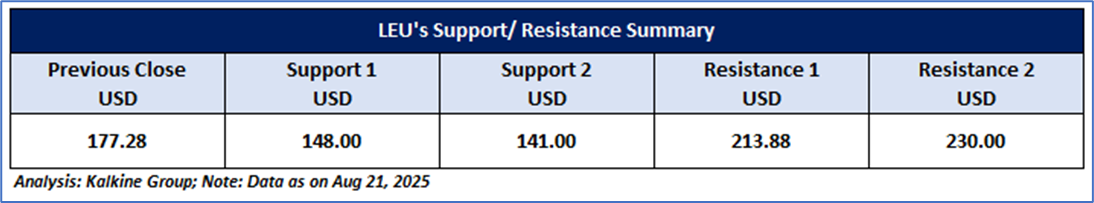
Support: A level at which the stock prices tend to find support if they are falling, and a downtrend may take a pause backed by demand or buying interest. Support 1 refers to the nearby support level for the stock, and if the price breaches the level, then Support 2 may act as the crucial support level for the stock.
Resistance: A level at which the stock prices tend to find resistance when they are rising, and an uptrend may take a pause due to profit booking or selling interest. Resistance 1 refers to the nearby resistance level for the stock, and if the price surpasses the level, then Resistance 2 may act as the crucial resistance level for the stock.
Stop-loss: It is a level to protect further losses in case of unfavourable movement in the stock prices.
Risk Reward Ratio: Risk reward ratio is the difference between an entry point to a stop loss and profit level. This report is based on ~60% Stop Loss of the Target 1 from the entry point.
A trailing stop-loss is a modification of stop-loss in case of favourable movement in the price to protect the gains. Individuals can Trail the Stop-Loss as per the aforementioned levels if the stock price achieves more than 50% of the Target 1. Individuals should consider exiting from the position as per the Trailing Stop-Loss level if the price starts moving downwards after achieving more than 50% of the Target 1.
The reference date for all price data, currency, technical indicators, support, and resistance levels Aug 21, 2025. The reference data in this report has been partly sourced from REFINITIV.
Abbreviations
CMP: Current Market Price
SMA: Simple Moving Average
RSI: Relative Strength Index
USD: United States dollar
Note: Trading decisions require a thorough analysis by individuals. Technical reports in general chart out metrics that may be assessed by individuals before any stock evaluation. The above are illustrative analytical factors used for evaluating the stocks; other parameters can be looked at along with additional risks per se. Past performance is neither an indicator nor a guarantee of future performance.
Past performance is not a reliable indicator of future performance.

 Please wait processing your request...