This report is an updated version of the report published on 11 June 2025 at 08:11 AM GMT+1.
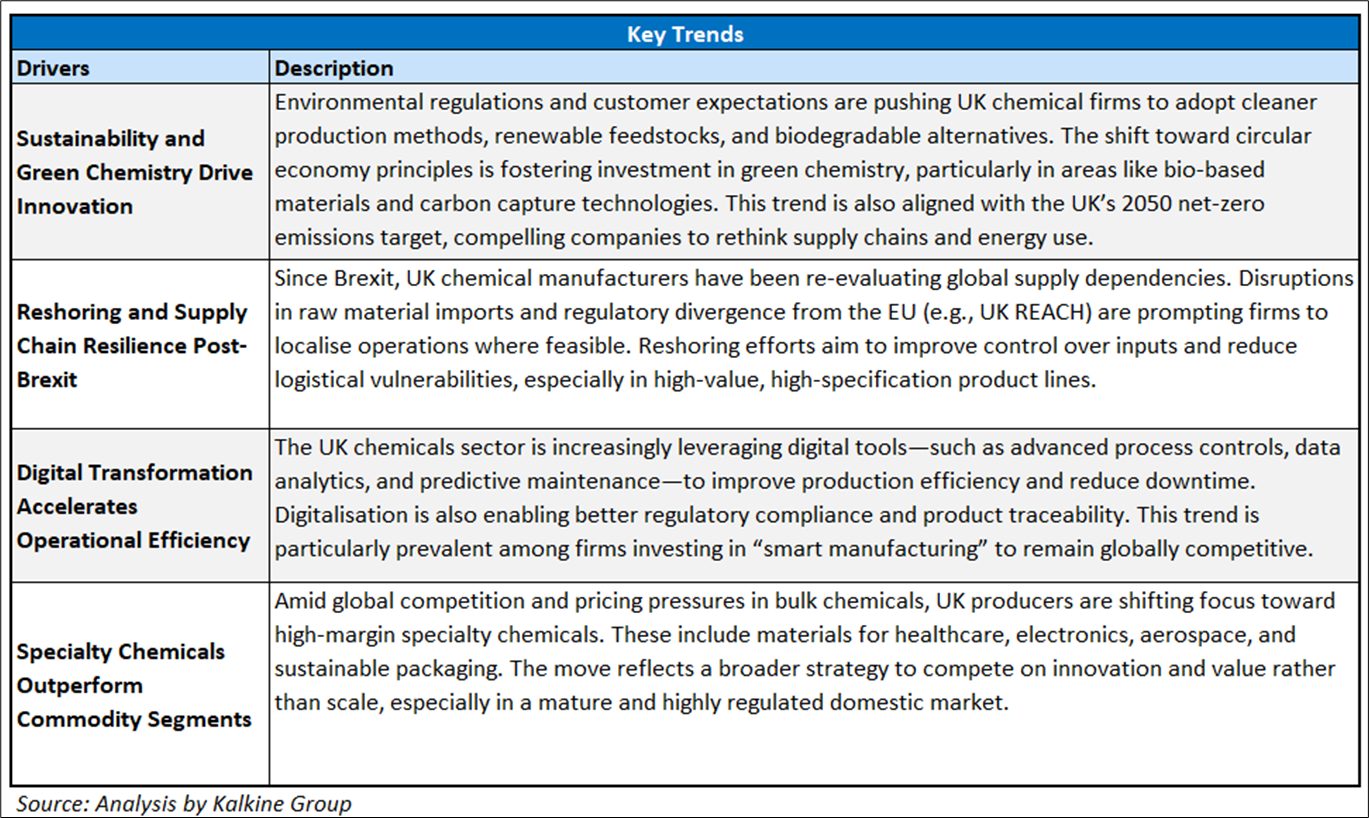
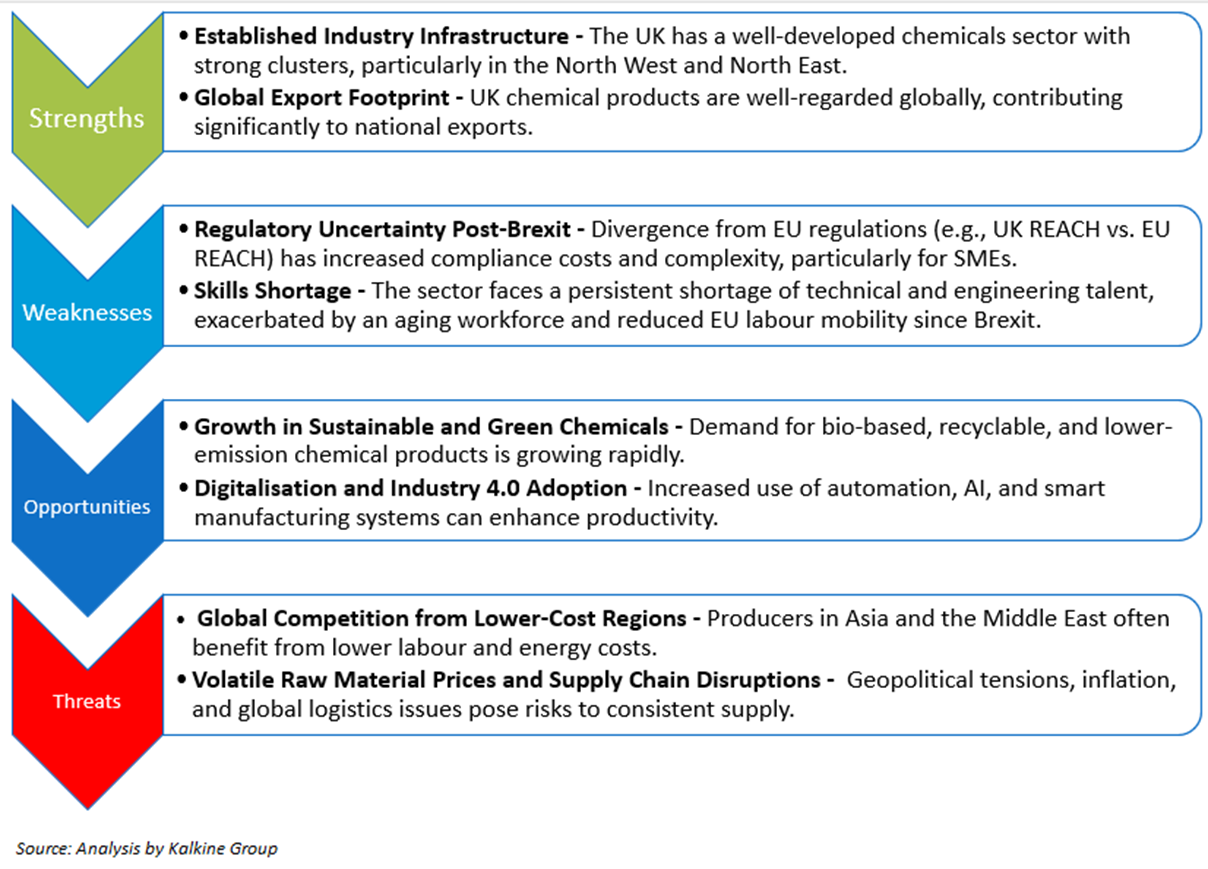
Section 1.0. UK Chemicals Sector Landscape, Trends & SWOT Analysis

The Chemicals industry is diverse in nature and includes the manufacturing of commodity/bulk chemicals, specialty chemicals, polymers, consumer chemicals, and others. The product of the sector finds its way in daily essentials like medicines, food, construction materials, etc. Some of the well-known companies in the space include Johnson Matthey PLC, Treatt PLC, Croda International PLC, etc. Kalkine’s Sector Report covers the Investment Summary, Sector Landscape, Trends & SWOT Analysis, Risks, Recent Business Updates along with the Valuation, Target Price, and Recommendation on the stock.


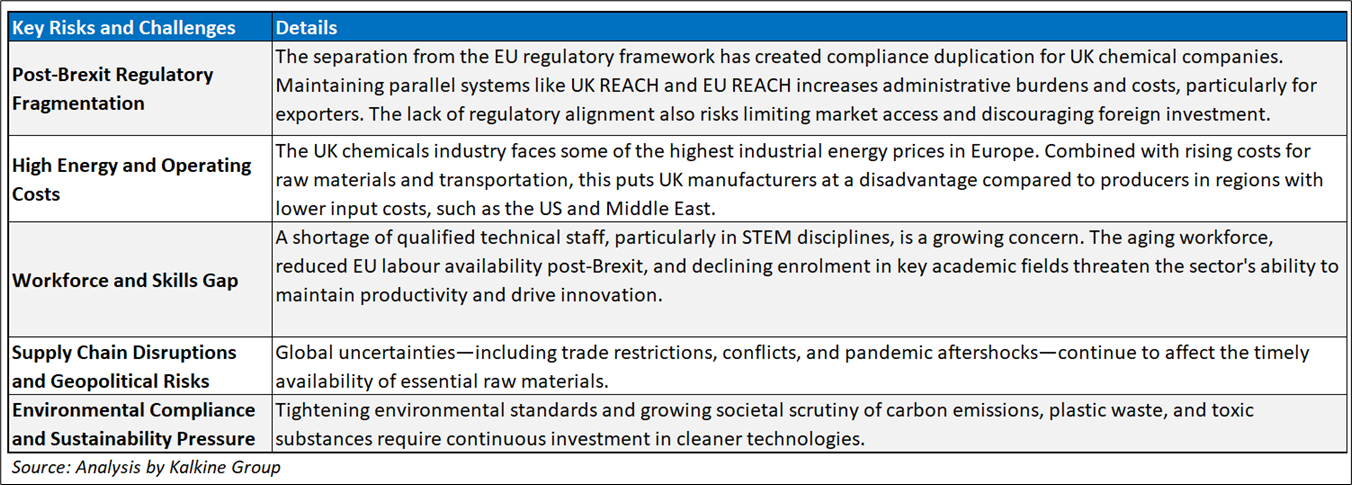
Section 2.0. Sector Risks & Opportunities


The UK chemicals sector continues to strengthen its appeal for cross-border expansion, supported by its advanced infrastructure, strong R&D ecosystem, and access to global markets. Strategic regulatory frameworks and a skilled workforce make the UK an attractive destination for international firms seeking high-value manufacturing capabilities. Despite post-Brexit adjustments, the sector remains resilient and well-positioned for international collaboration and investment.
After gaining insights into the Chemicals sector, we will look at the business model of two relevant players listed on the London Stock Exchange.
Section1: Company Overview
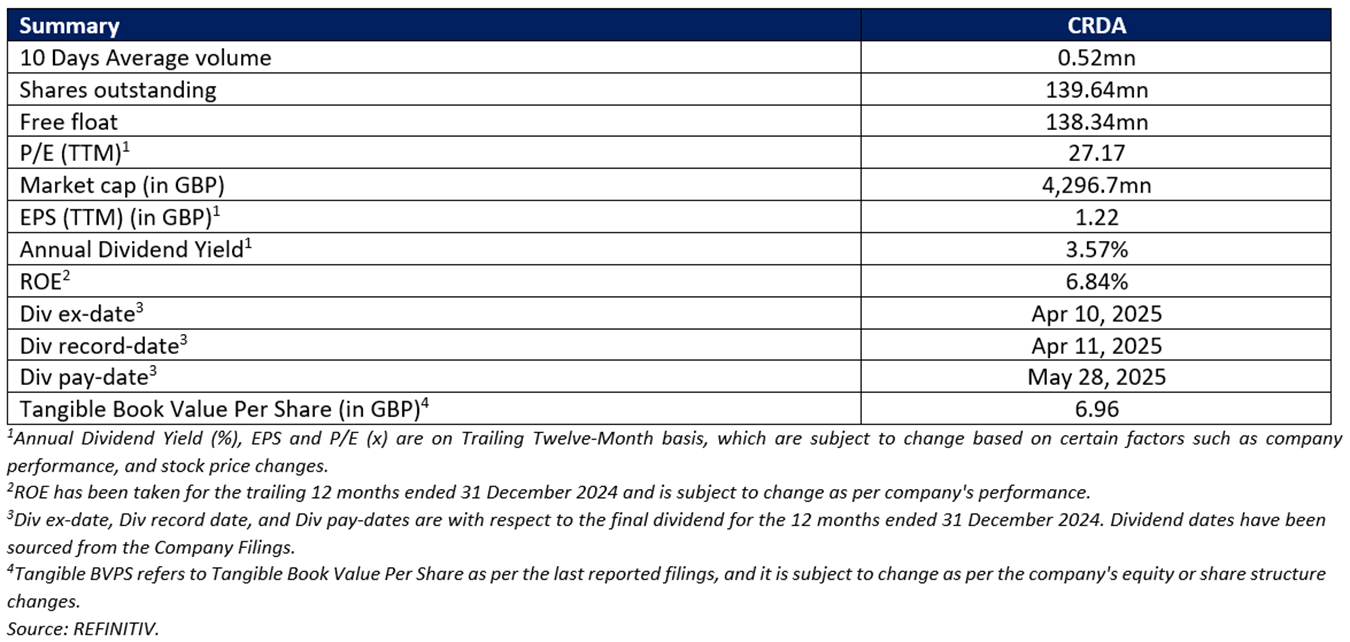

Croda International PLC (LSE: CRDA) is an FTSE 100 listed company specializing in creating high performance ingredients and technologies that improve people's lives. Its sales, marketing and research activities are organized into three global market sectors: consumer care, life sciences and industrial specialties.

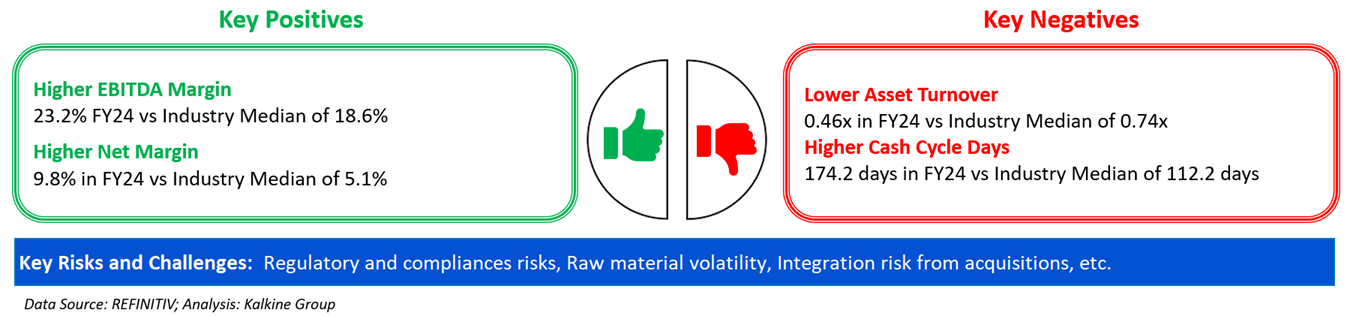
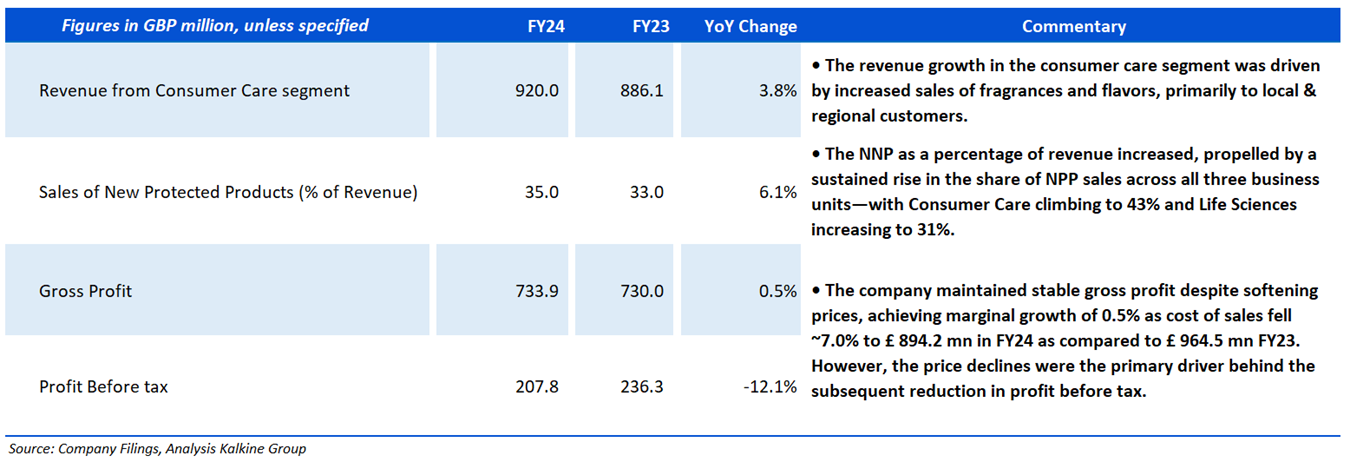
Section2: Financial Highlights – 2024

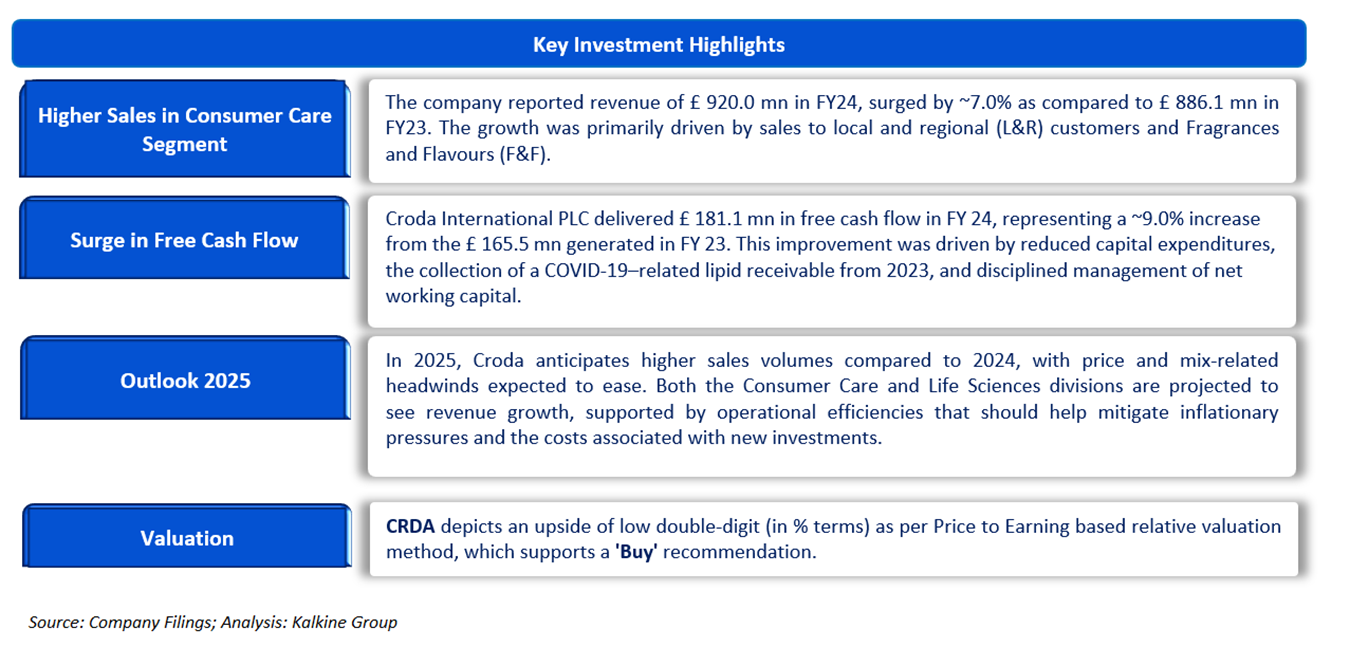
Section 3: Stock Recommendation Summary

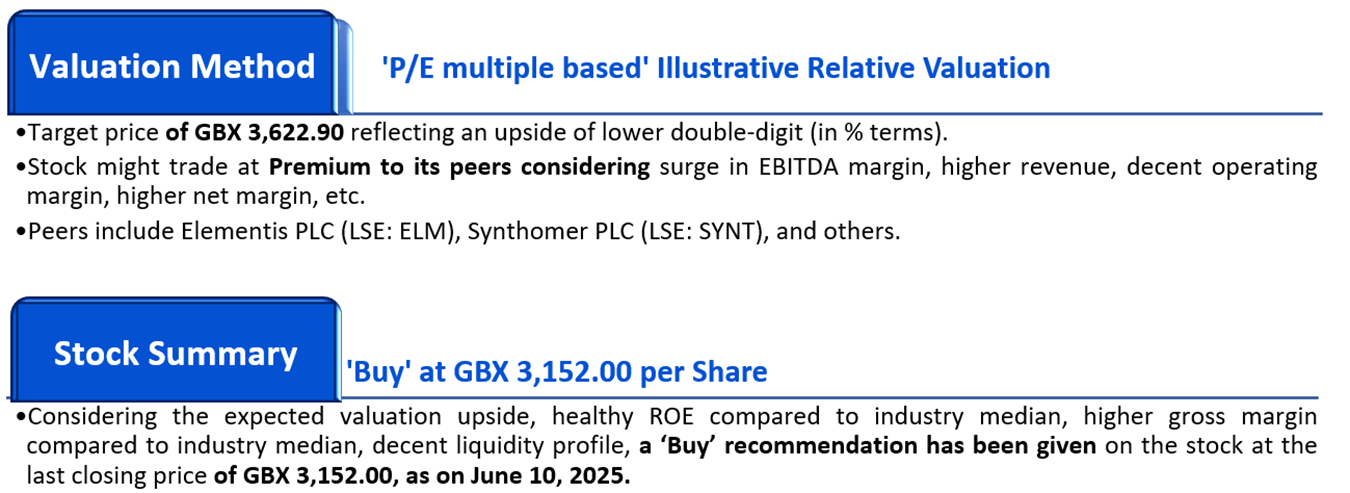
Valuation Methodology: Price to Earnings Multiple Based Relative Valuation (Illustrative):
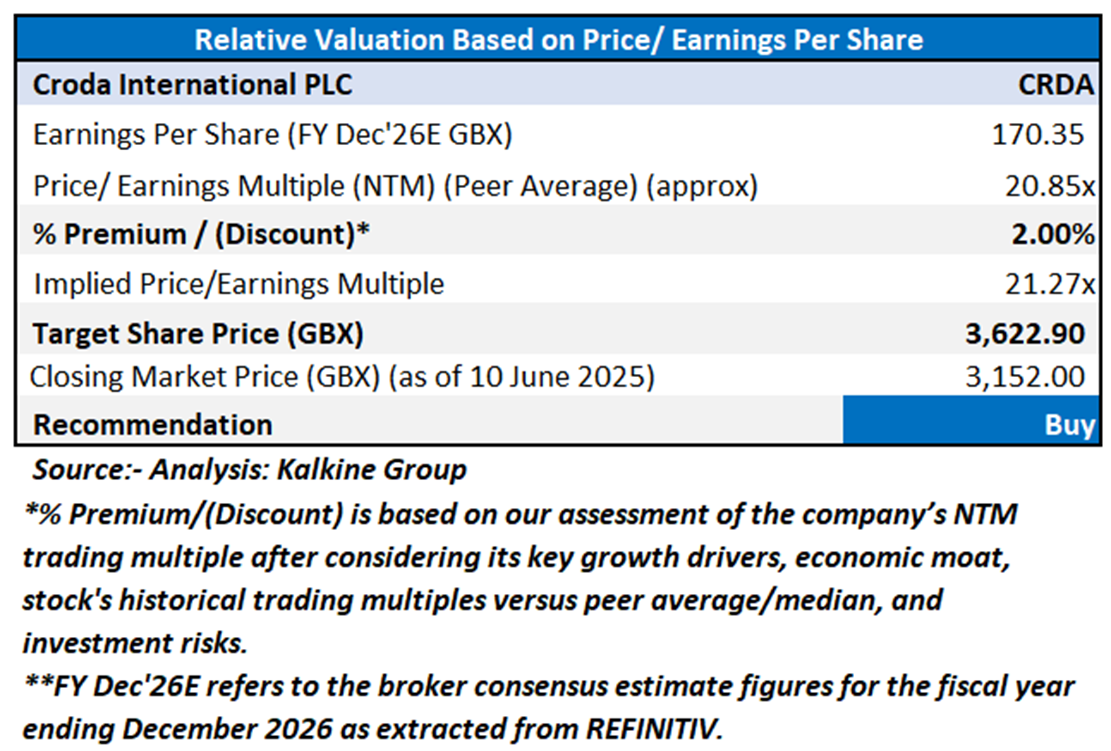


The stock has witnessed an upside of ~3.28% and of ~0.58% over the 1 week and 3 months respectively. It is trading below the average of 52-week high price of GBX 4,335.00 and 52-week low price of GBX 2,551.00, providing an opportunity to accumulate the stock.

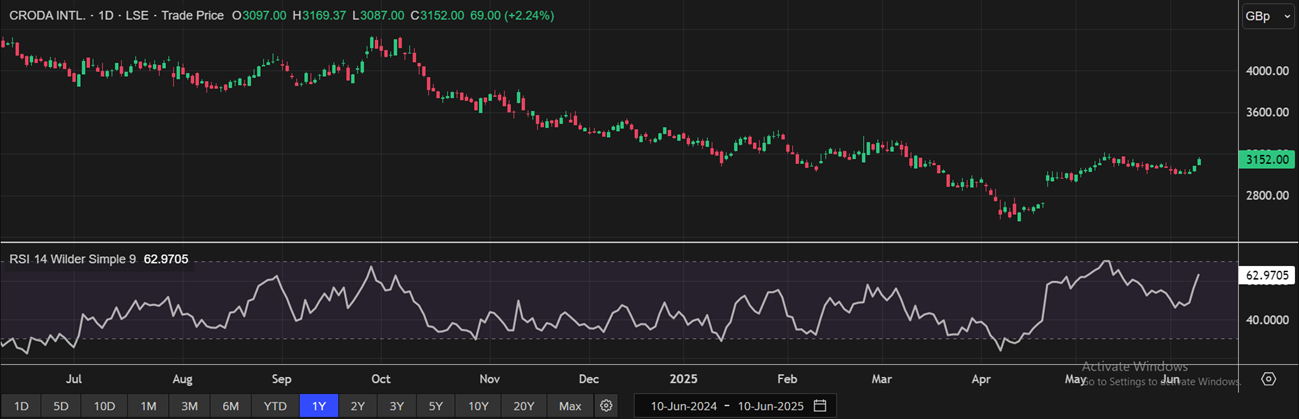
One-Year Technical Price Chart (as of June 10, 2025). Source: REFINITIV, Analysis: Kalkine Group

Section4: Company Overview
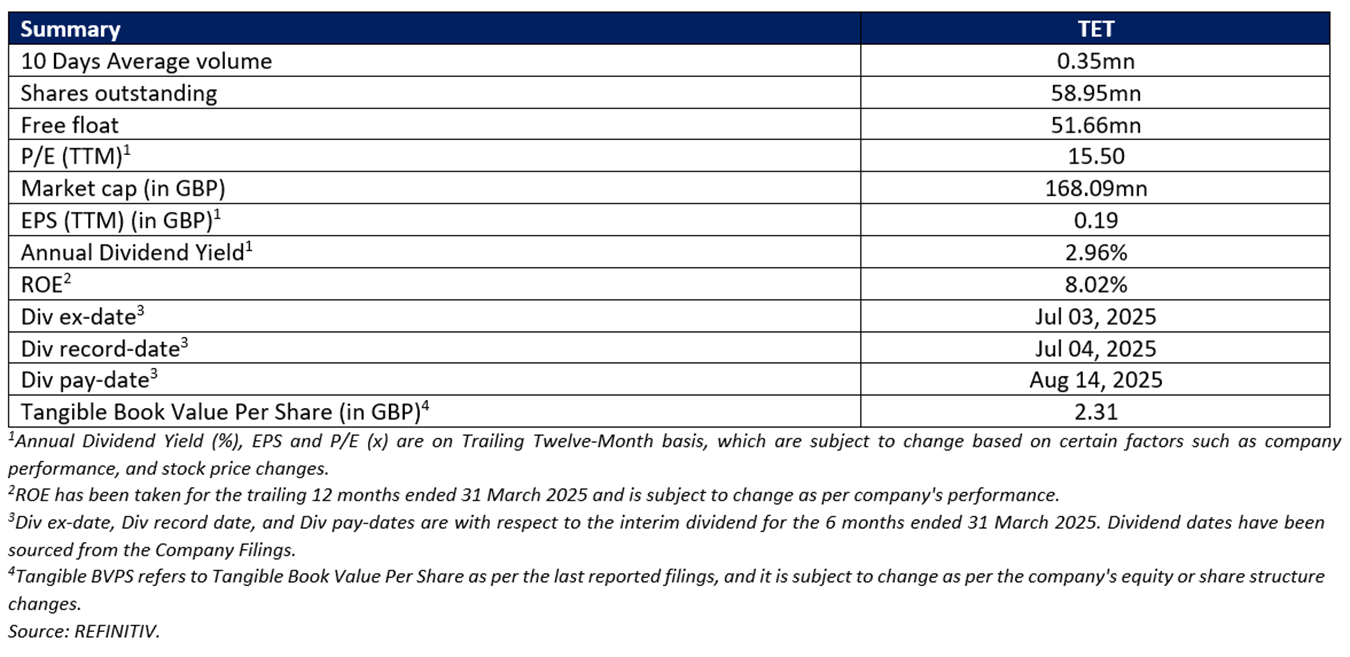

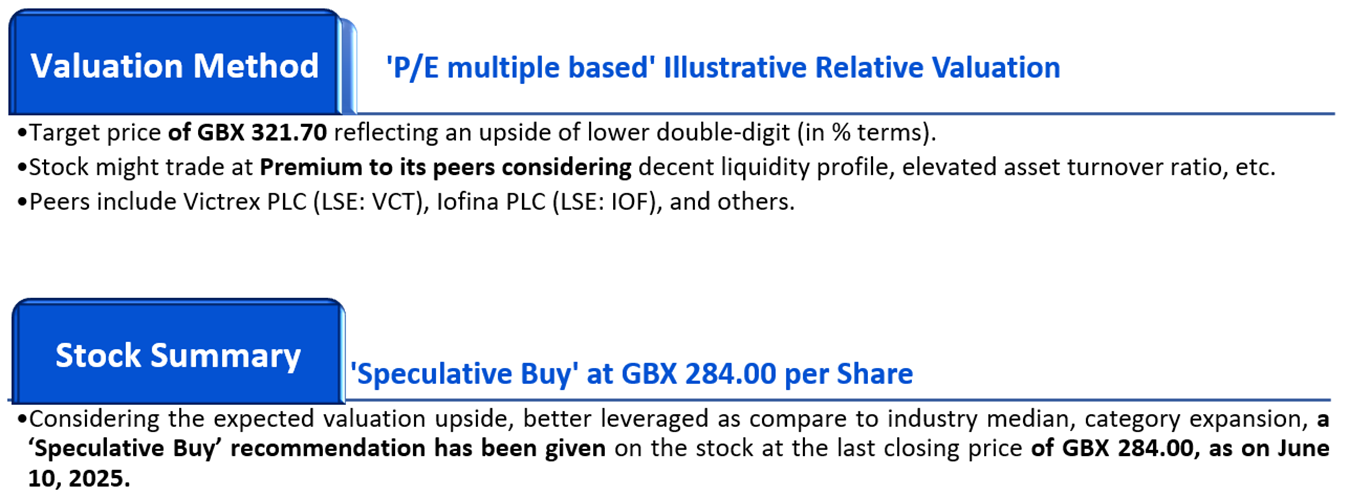
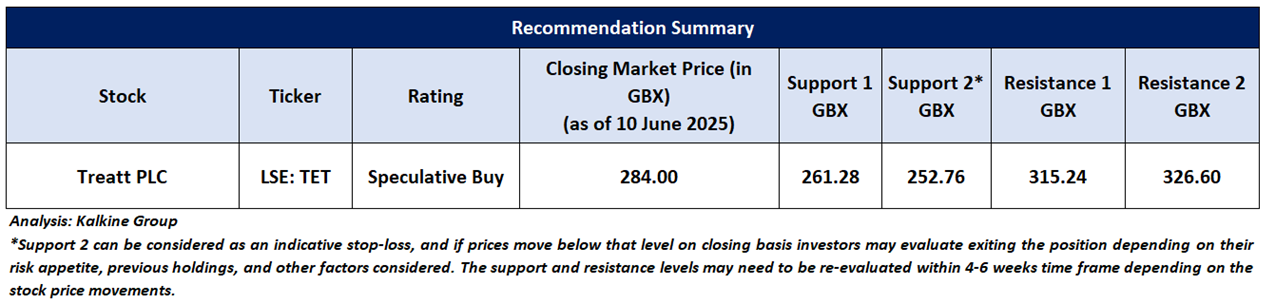
Treatt PLC (LSE: TET), a constituent of the FTSE All-Share Index, is a UK-based global manufacturer and supplier of natural extracts and ingredients for the flavor, fragrance, and consumer goods industries, with a strong focus on the beverage sector. The company offers a sustainable and diverse portfolio of high-quality products catering to multinational clients.

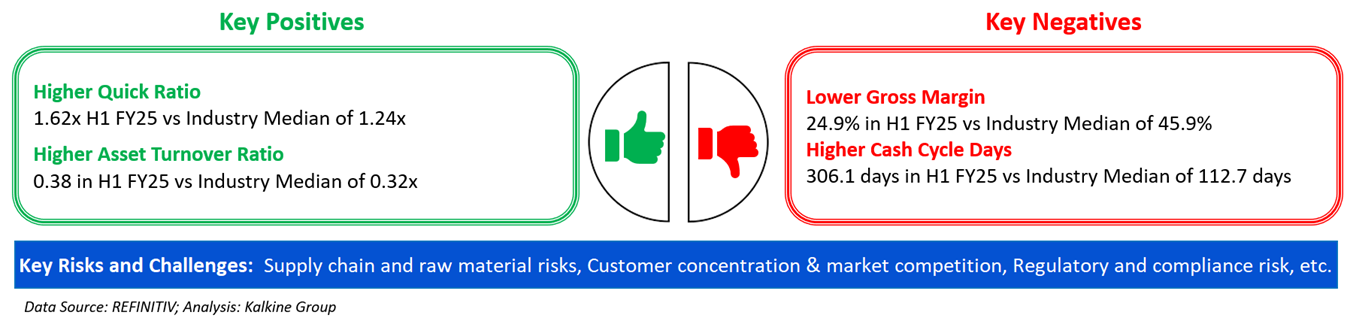
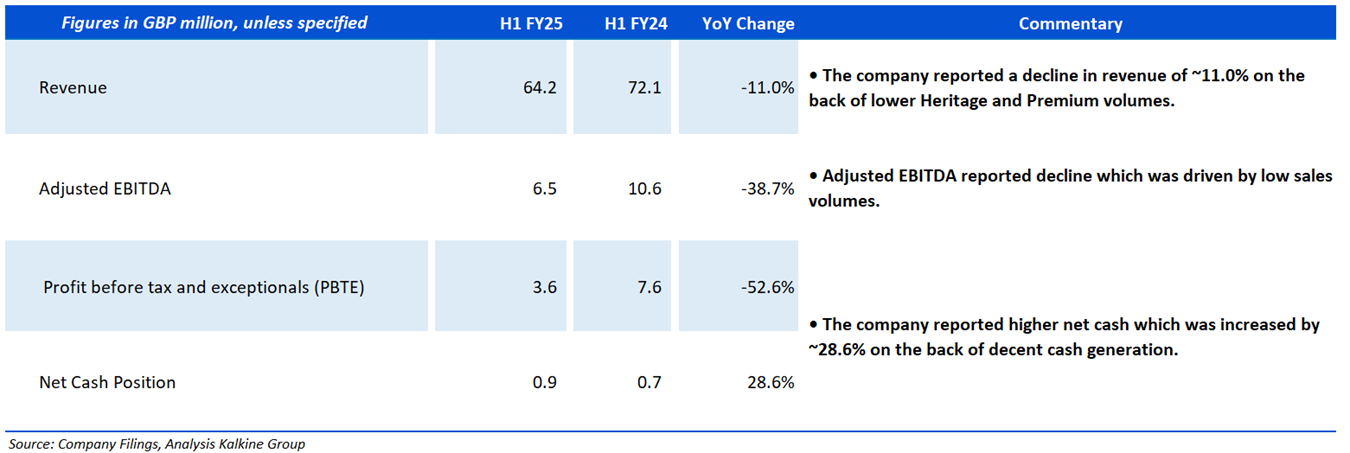
Section5: Financial Highlights – H1 FY25

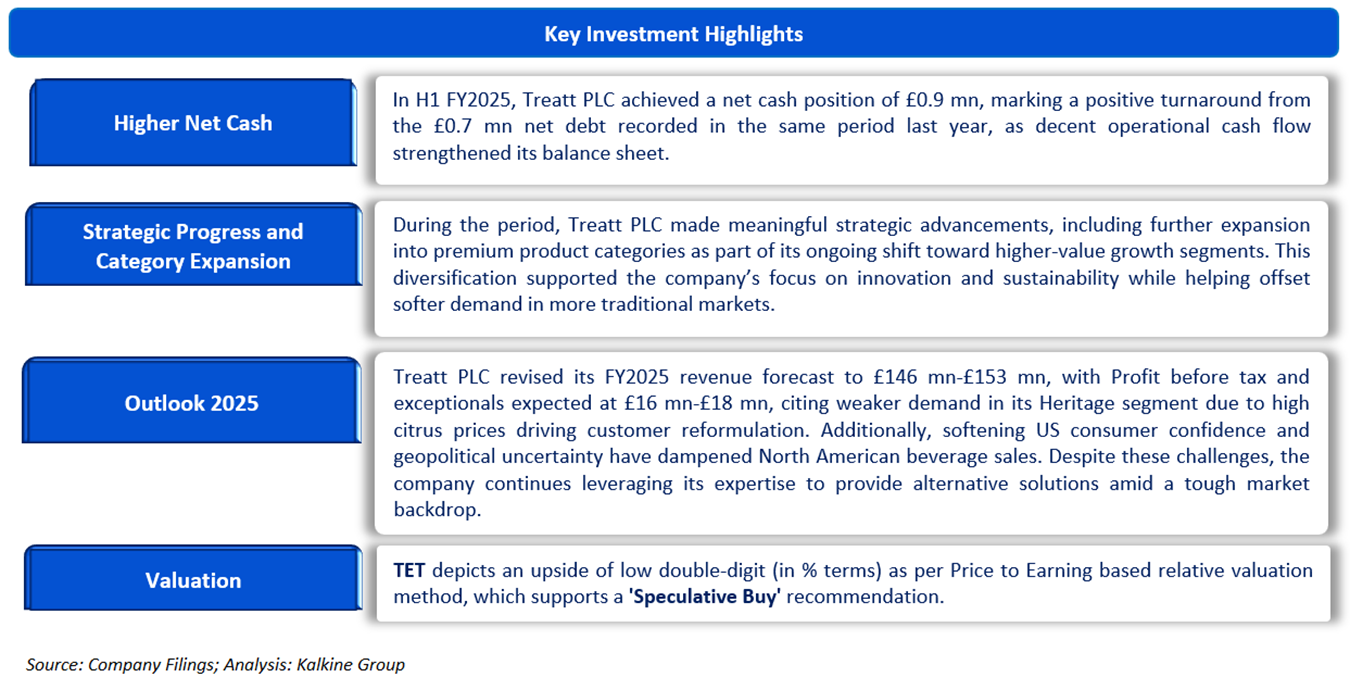
Section 6: Stock Recommendation Summary

Valuation Methodology: P/E Multiple Based Relative Valuation (Illustrative):
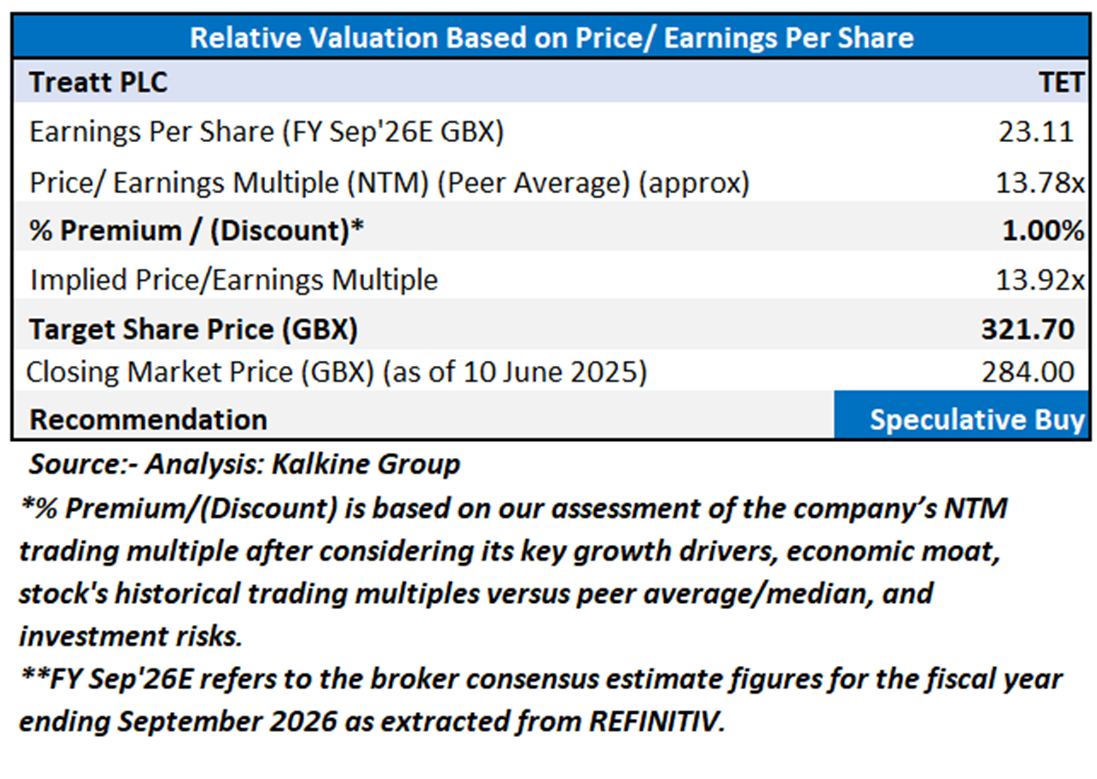


The stock has witnessed an upside of ~6.79% and downside of ~27.24% over the 1 week and 3 months respectively. It is trading below the average of 52-week high price of GBX 527.25 and 52-week low price of GBX 194.80, providing an opportunity to accumulate the stock.

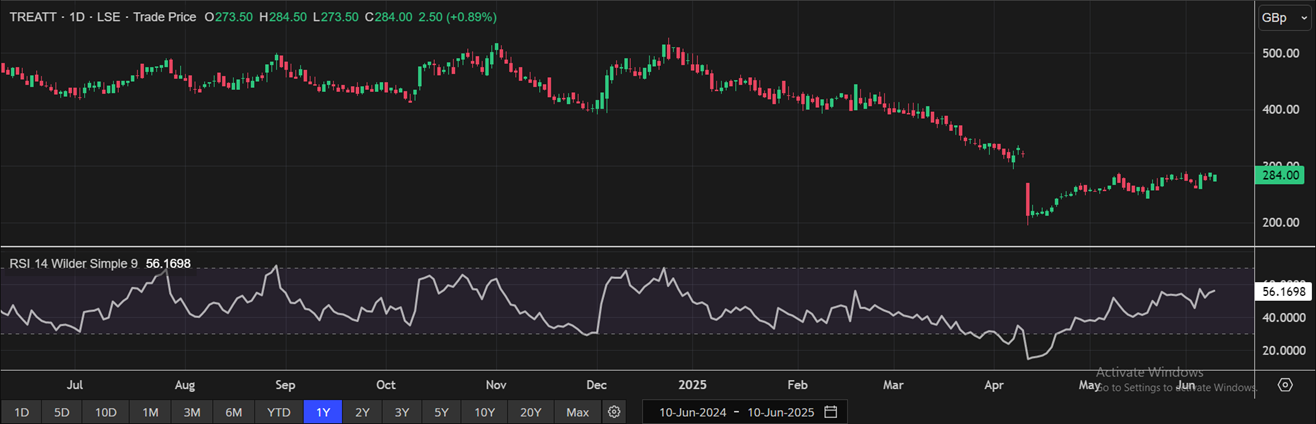
One-Year Technical Price Chart (as of June 10, 2025). Source: REFINITIV, Analysis: Kalkine Group

Please note markets are trading in a highly volatile zone currently due to certain macro-economic and geopolitical tensions prevailing. Therefore, it is prudent to follow a cautious approach while investing.
Note 1: Past performance is not a reliable indicator of future performance.
Note 2: The reference date for all price data, currency, technical indicators, support, and resistance level is 10 June 2025. The reference data in this report has been partly sourced from REFINITIV.
Note 3: Investment decisions should be made depending on an individual's appetite for upside potential, risks, holding duration, and any previous holdings. An 'Exit' from the stock can be considered if the Target Price mentioned as per the Valuation and or the technical levels provided has been achieved and is subject to the factors discussed above.
Note 4: Target Price refers to a price level which the stock is expected to reach as per the relative valuation method and/ or technical analysis taking into consideration both short-term and long-term scenarios.
Note 5: ‘Kalkine reports are prepared based on the stock prices captured either from the London Stock Exchange (LSE) and or REFINITIV. Typically, both sources (LSE and or REFINITIV) may reflect stock prices with a delay which could be a lag of 15-20 minutes. There can be no assurance that future results or events will be consistent with the information provided in the report. The information is subject to change without any prior notice.’
Note 6: Dividend Yield may vary as per the stock price movement.
Technical Indicators Defined: -
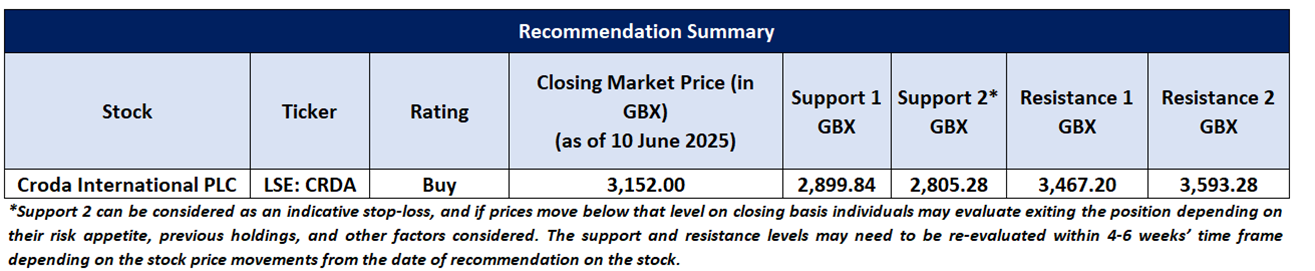
Support: A level at which the stock prices tend to find support if they are falling, and a downtrend may take a pause backed by demand or buying interest. Support 1 refers to the nearby support level for the stock and if the price breaches the level, then Support 2 may act as the crucial support level for the stock.
Resistance: A level at which the stock prices tend to find resistance when they are rising, and an uptrend may take a pause due to profit booking or selling interest. Resistance 1 refers to the nearby resistance level for the stock and if the price surpasses the level, then Resistance 2 may act as the crucial resistance level for the stock.
Stop-loss: It is a level to protect further losses in case of unfavourable movement in the stock prices.
Disclaimer-
This report has been issued by Kalkine Limited (Company number 07903332), a private limited company, incorporated in England and Wales ("Kalkine”). Kalkine.co.uk and associated pages are published by Kalkine. Kalkine is authorised and regulated by the Financial Conduct Authority under reference number 579414.
The information in this report and on the Kalkine website has been prepared from a wide variety of sources, which Kalkine, to the best of its knowledge and belief, considers accurate. Kalkine has made every effort to ensure the reliability of information contained in its reports, newsletters and websites. All information represents our views at the date of publication and may change without notice. The information in this report does not constitute an offer to sell securities or other financial products or a solicitation of an offer to buy securities or other financial products. Our reports contain non personalized recommendations to invest in securities and other financial products.
Kalkine does not offer financial advice based upon your personal financial situation or goals, and we shall not be held liable for any investment or trading losses you may incur by using the opinions expressed in our reports, publications, market updates, news alerts and corporate profiles. Kalkine does not intend to exclude any liability which it is not permitted to exclude under applicable law or regulation. Kalkine’s non-personalised advice does not in any way endorse or recommend individuals, investment products or services for your personal financial situation. You should discuss your portfolios and the risk tolerance level appropriate for your personal financial situation, with a professional authorised financial planner and adviser. You should be aware that the value of any investment and the income from it can go down as well as up and you may not get back the amount invested.
Please also read our Terms & Conditions for further information. Employees and/or associates of Kalkine and its related entities may hold interests in the securities or other financial products covered in this report or on the Kalkine website. Any such employees and associates are required to comply with certain safeguards, procedures and disclosures as required by law.
Kalkine Media Limited, an affiliate of Kalkine, may have received, or be entitled to receive, financial consideration in connection with providing information about certain entity(s) covered on its website including entities covered in this report.
Past performance is not a reliable indicator of future performance.
 Please wait processing your request...