Section 1.0. UK Industrial Engineering Sector Landscape, Trends & SWOT Analysis

The industrial engineering sector, which includes manufacturing, automation, and supply chain optimization, contributes to economic resilience. It improves operational efficiency, lowers production costs, and stabilizes output, helping businesses maintain productivity during demand shifts. Advancements in smart factories and sustainable production also foster long-term competitiveness and can support a quicker recovery.
Kalkine’s Sector Report covers the Sector Landscape, Trends & SWOT Analysis, Risks, Recent Business Updates along with the Valuation, Target Price, and Recommendation on the stock.


Section 2.0. Sector Risks & Opportunities


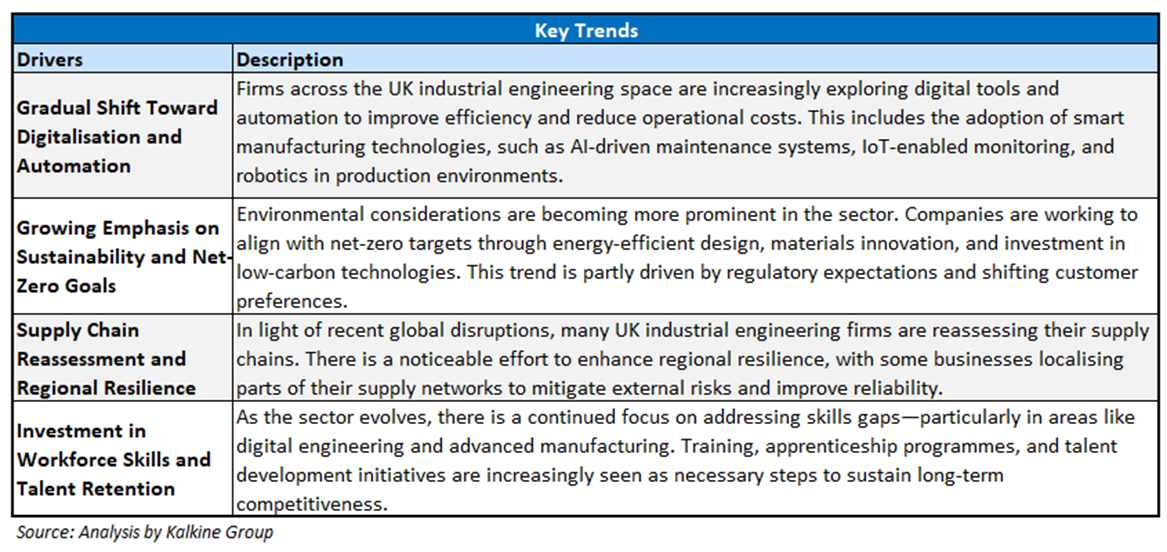
The UK industrial engineering sector is advancing through the expanded use of smart manufacturing systems that connect automation, IoT, and data analytics to improve production efficiency. Attention is growing toward sustainable engineering approaches, including the adoption of energy-efficient technologies and circular economy models to minimize environmental footprints. Implementation of digital twins and robotics is increasing to improve accuracy and operational effectiveness. Regulatory and standards frameworks are also evolving to facilitate innovation while upholding safety and quality requirements. Together, these trends indicate a shift toward more integrated, environmentally conscious, and intelligent industrial activities.
Section1: Company Overview

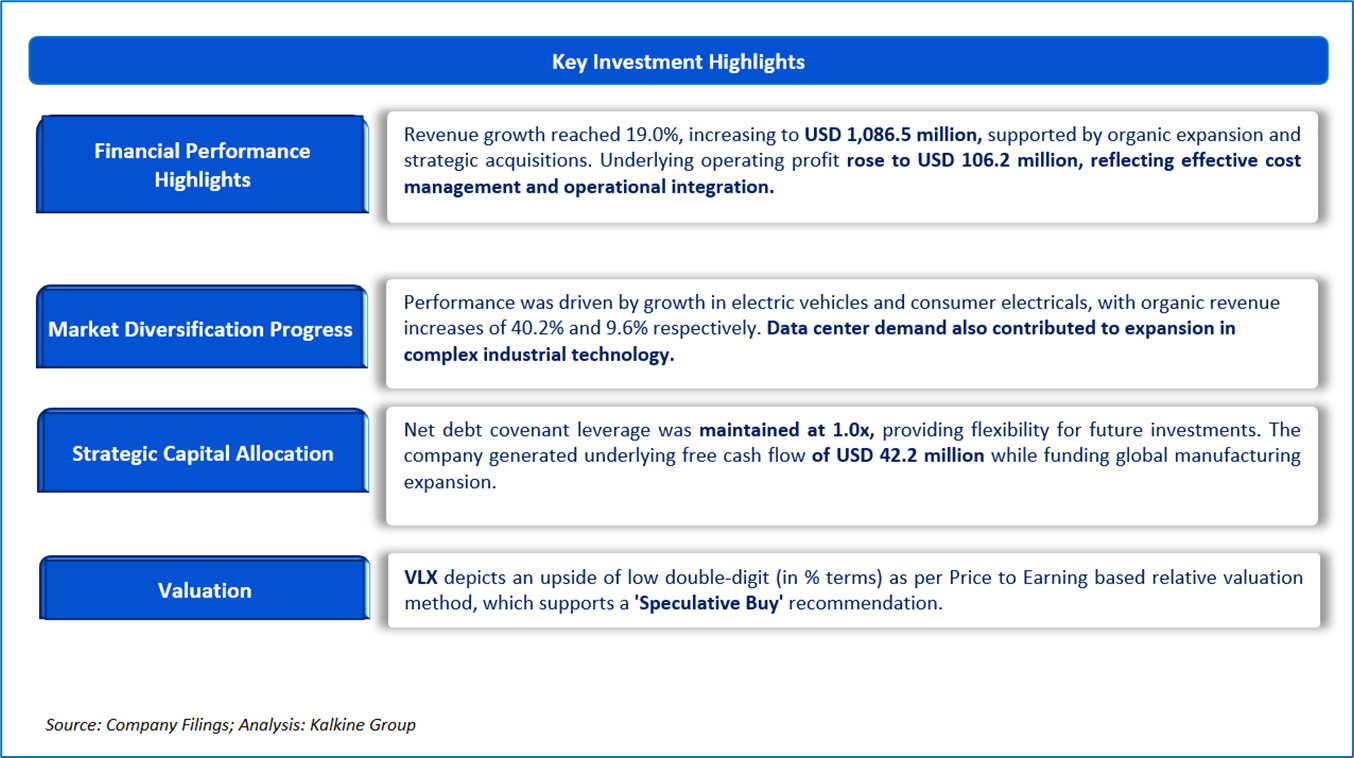
Volex PLC (LSE: VLX), a constituent of the FTSE AIM UK 50 Index, is a globally integrated manufacturer specializing in performance-critical applications and power and data connectivity solutions. The company's diverse product portfolio includes power cords, plugs, connectors, and receptacles; comprehensive integrated manufacturing services; electric vehicle charging infrastructure; consumer cable harnesses and power products; high-speed copper interconnect and data transfer cables; and data center power distribution solutions.
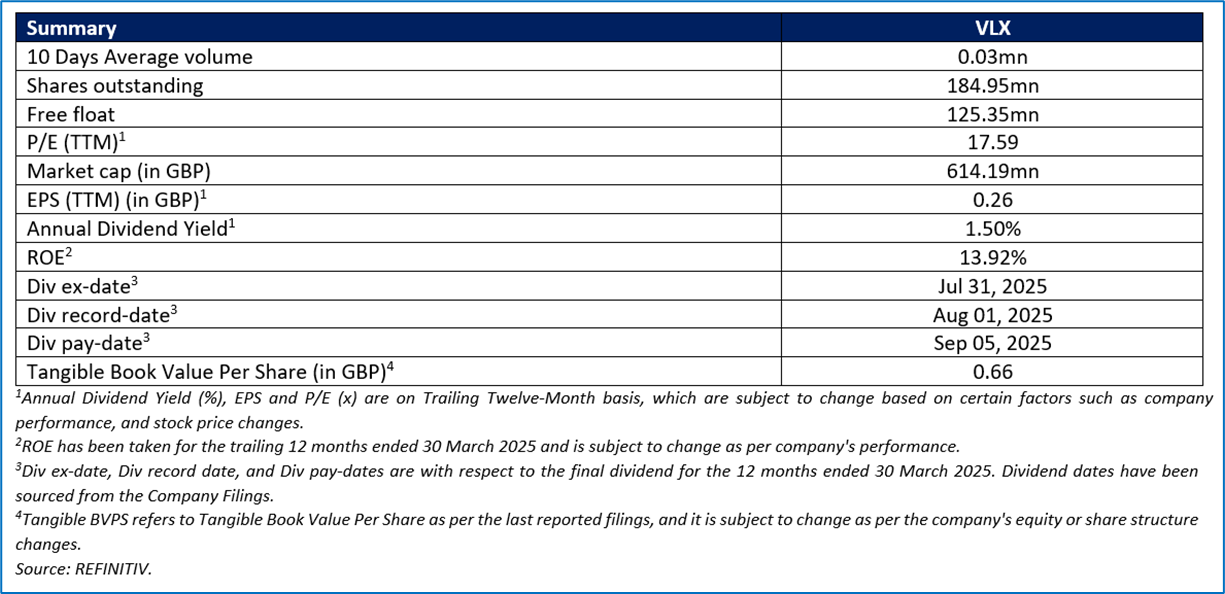
This Report covers the Investment Highlights, Key Financial Metrics, Risks, Technical Analysis along with the Valuation, Target Price, and Recommendation on the stock.

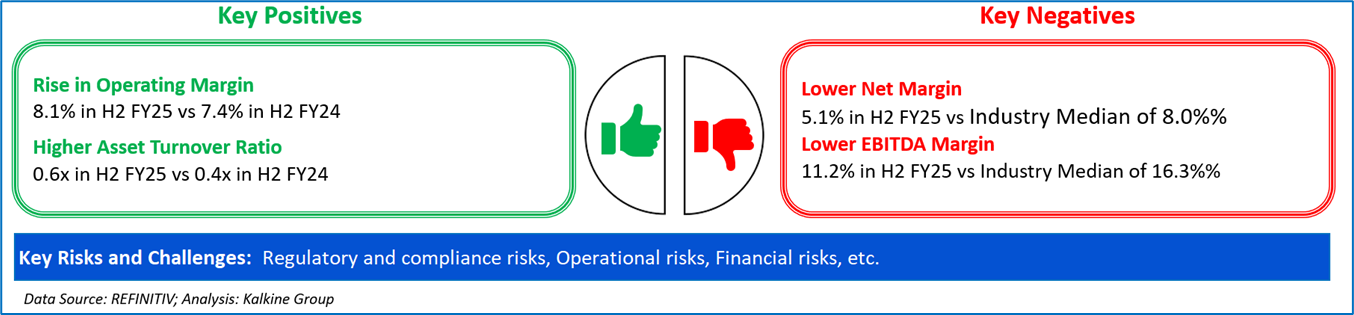
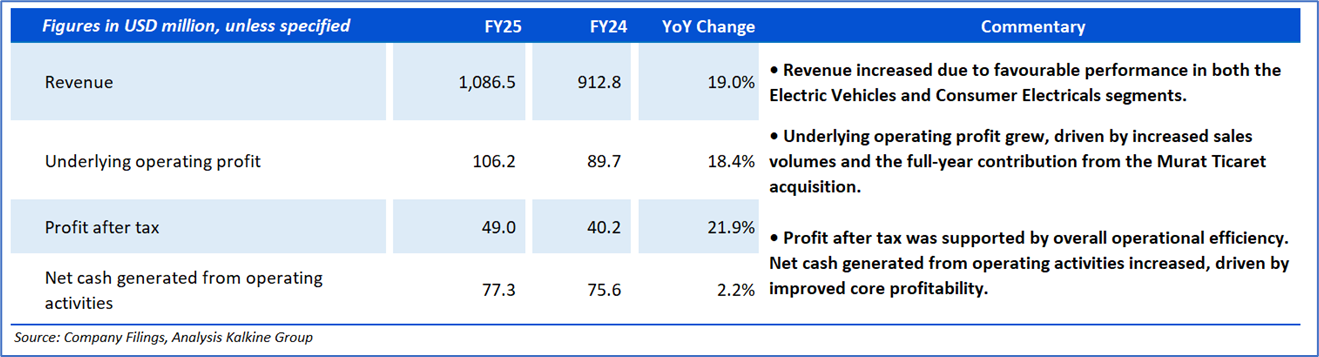
Section2: Financial Highlights – FY25

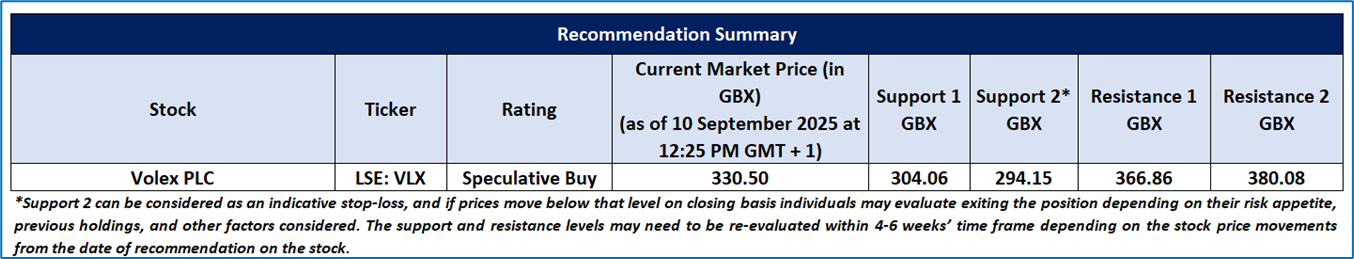
Section 3: Stock Recommendation Summary

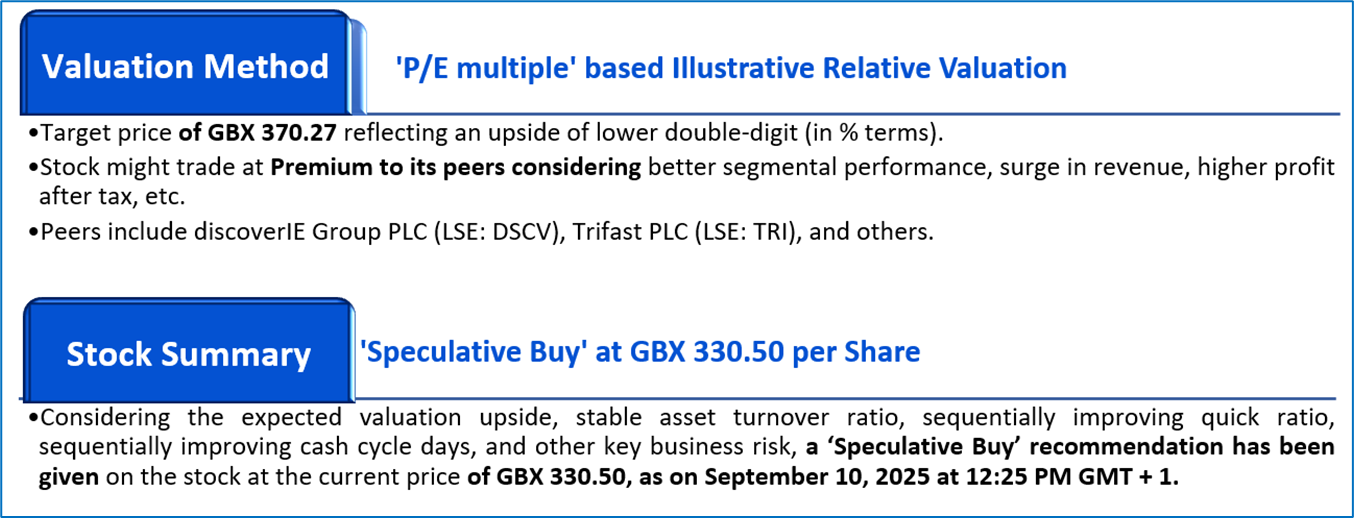
Valuation Methodology: Price to Earnings Multiple Relative Valuation (Illustrative):
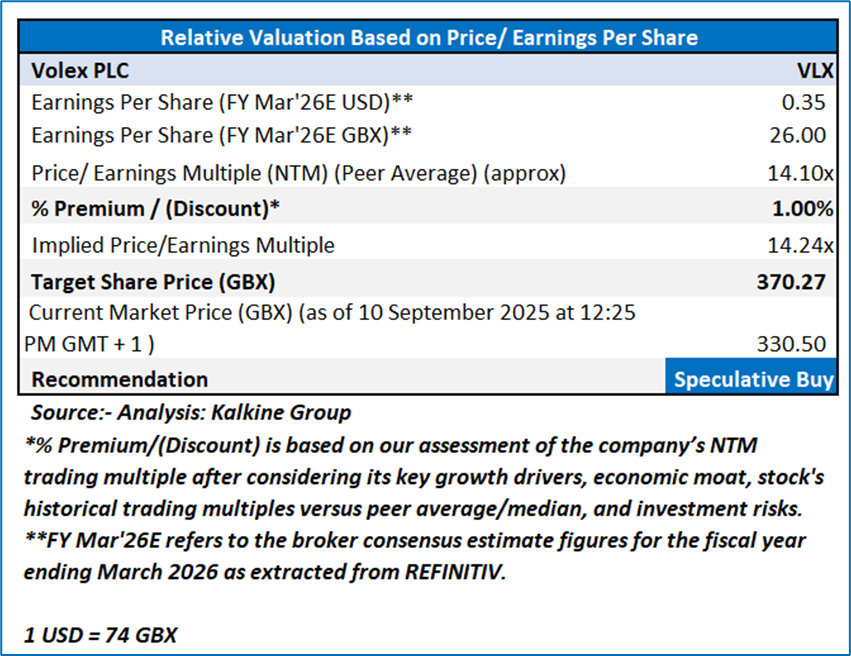


The stock has witnessed a downside of ~2.22% and an upside of ~7.51% over the 1 week and 3 months respectively. It is trading above the average of 52-week high price of GBX 394.00 and 52-week low price of GBX 190.00, providing an opportunity to ride the trend.

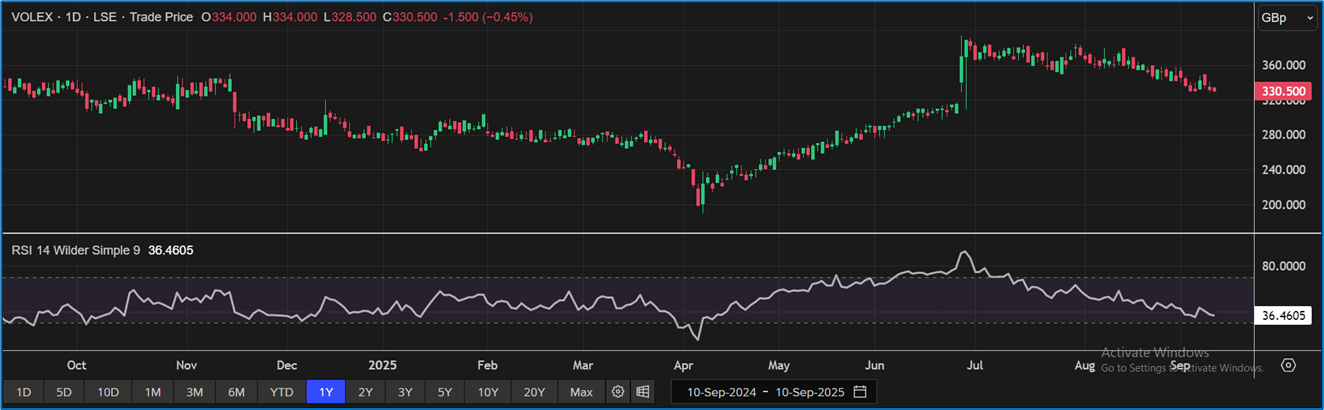
One-Year Technical Price Chart (as of September 10, 2025). Source: REFINITIV, Analysis: Kalkine Group

Section 4: Company Overview

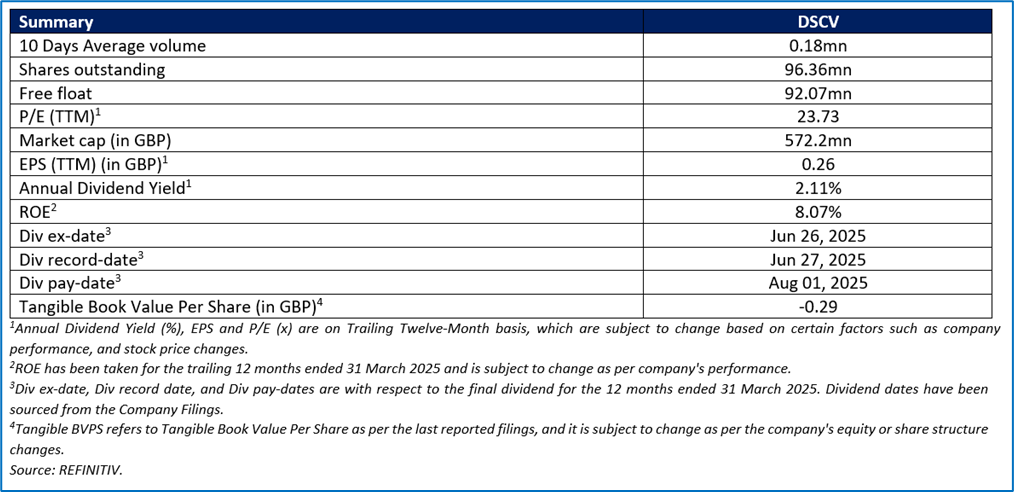
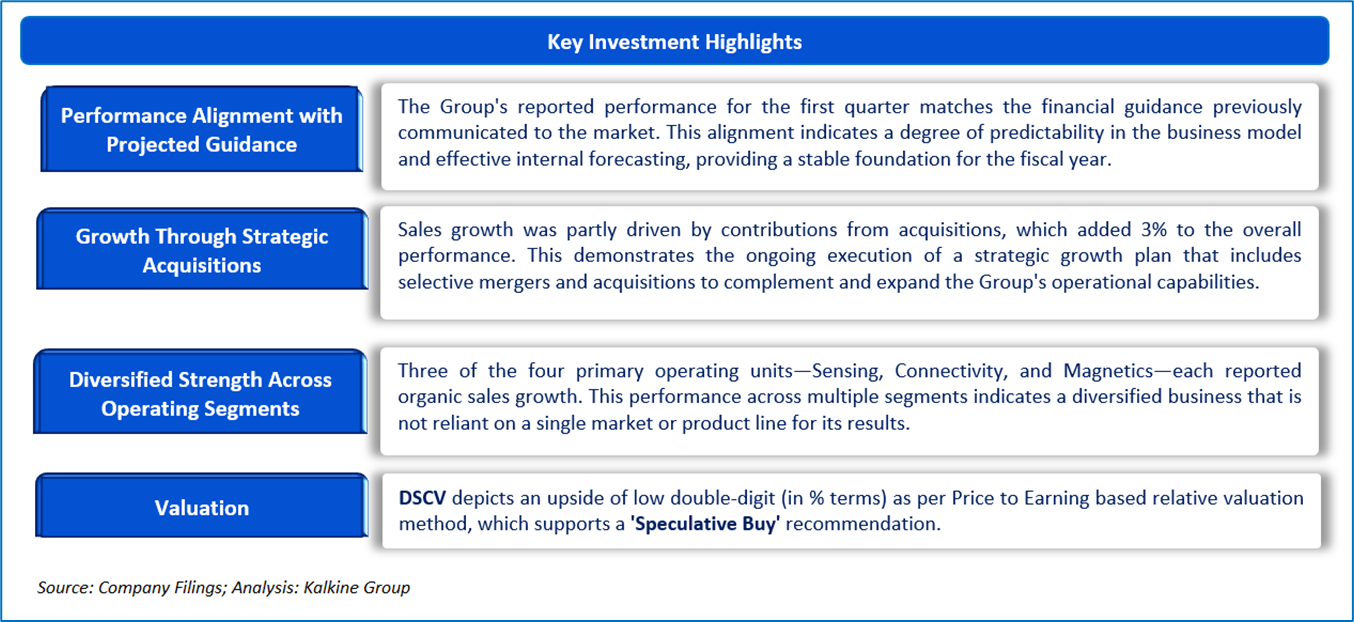
DiscoverIE Group PLC (LSE: DSCV), a constituent of the FTSE 250 Index, is a global designer and manufacturer of customized electronic components for industrial applications. The Group operates through two specialized divisions: Magnetics & Controls, which develop differentiated magnetic components, power systems, and embedded computing solutions; and Sensing & Connectivity, focused on precision sensors and connectivity technologies. With operations across 16 countries, DiscoverIE's Magnetics & Controls division is further organized into two technology clusters (Magnetics and Embedded Systems) supported by four dedicated businesses. The company provides electronic engineering solutions that enhance performance and connectivity for industrial OEMs worldwide.
This Report covers the Investment Highlights, Key Financial Metrics, Risks, Technical Analysis along with the Valuation, Target Price, and Recommendation on the stock.

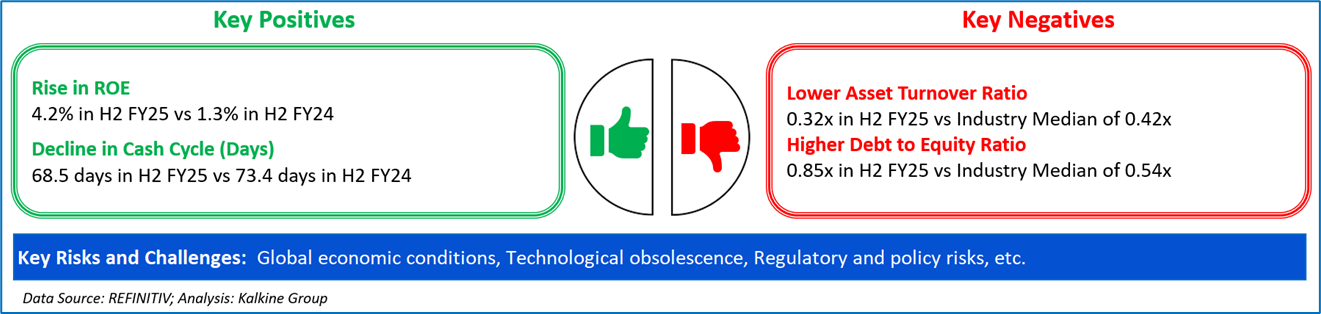
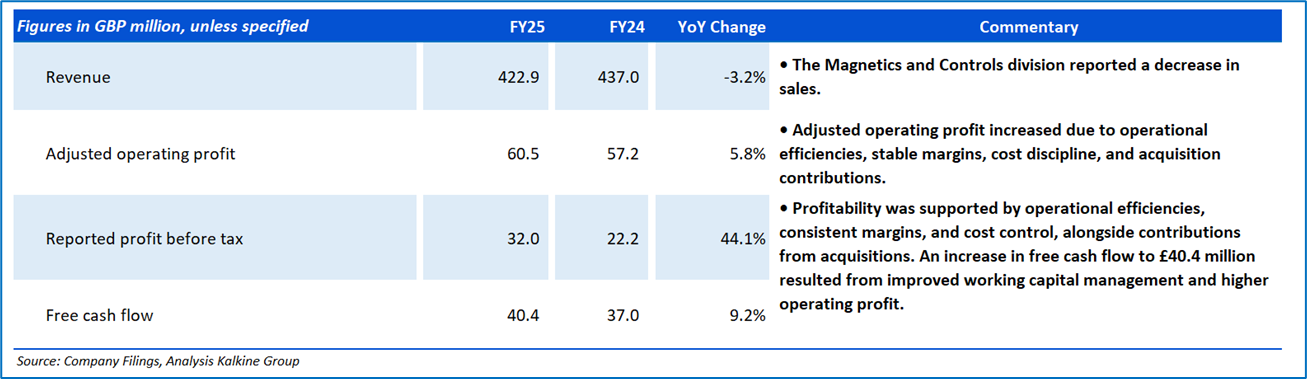
Section5: Financial Highlights – FY25

Section 6: Stock Recommendation Summary

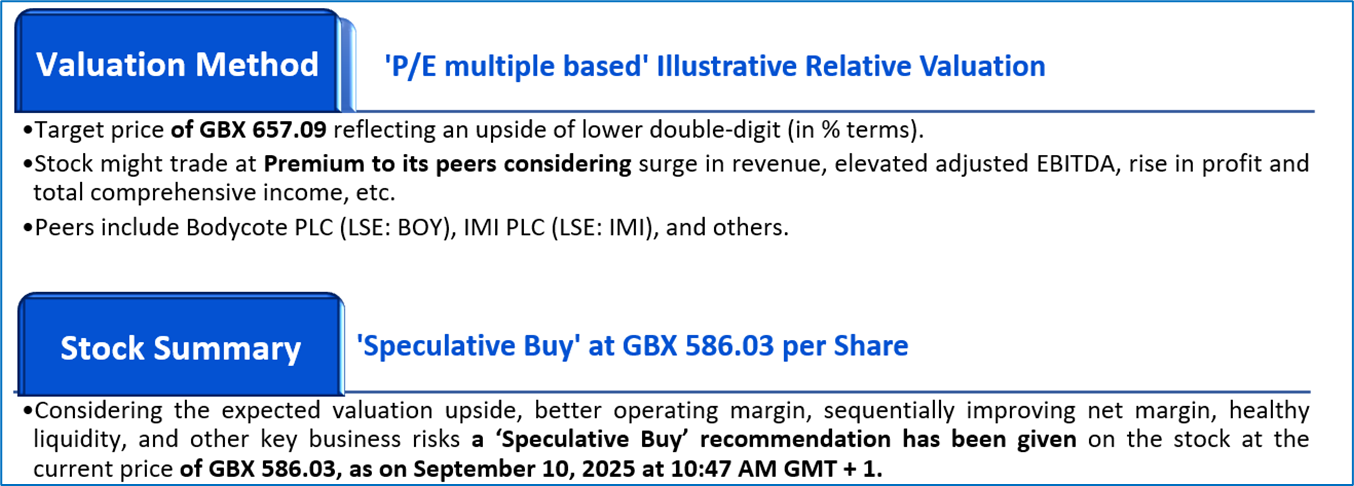
Valuation Methodology: P/E Multiple Based Relative Valuation (Illustrative):
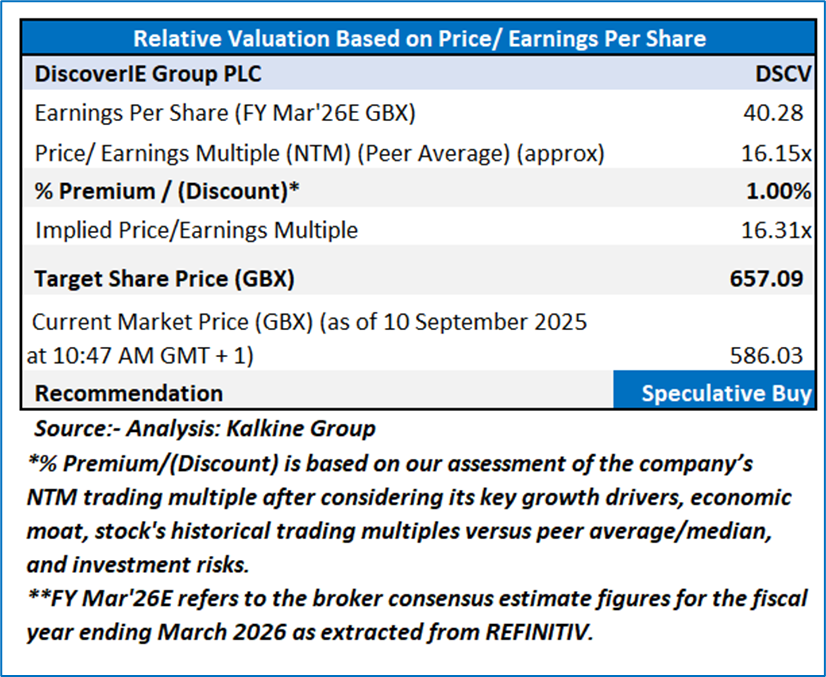


The stock has witnessed a downside of ~1.83% and of ~12.15% over the 1 week and 3 months respectively. It is trading below the average of 52-week high price of GBX 754.00 and 52-week low price of GBX 472.50, providing an opportunity to accumulate the stock.

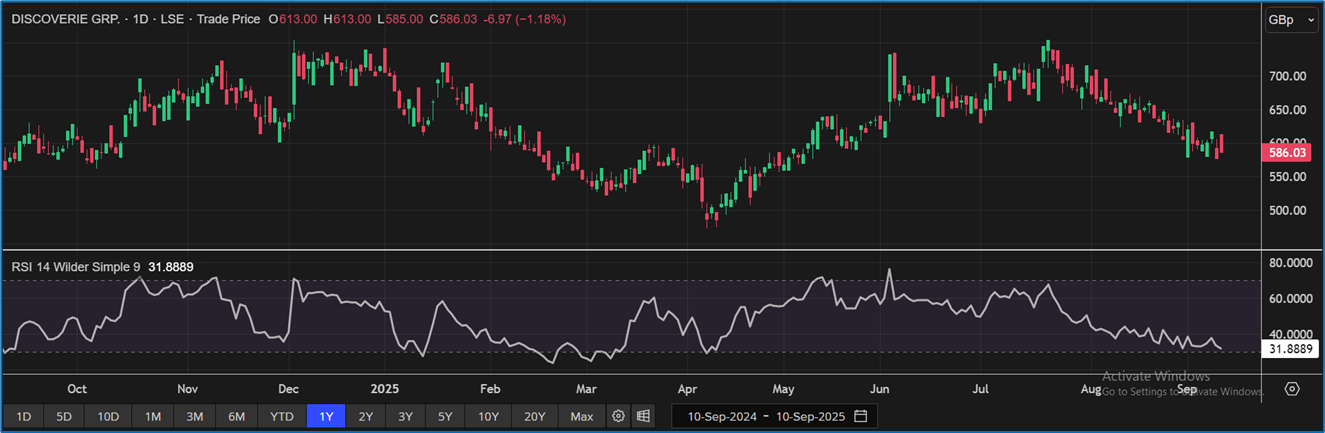
One-Year Technical Price Chart (as of September 10, 2025). Source: REFINITIV, Analysis: Kalkine Group

Note 1: Past performance is not a reliable indicator of future performance.
Note 2: The reference date for all price data, currency, technical indicators, support, and resistance level is 10 September 2025. The reference data in this report has been partly sourced from REFINITIV.
Note 3: Investment decisions should be made depending on an individual's appetite for upside potential, risks, holding duration, and any previous holdings. An 'Exit' from the stock can be considered if the Target Price mentioned as per the Valuation and or the technical levels provided has been achieved and is subject to the factors discussed above.
Note 4: Target Price refers to a price level which the stock is expected to reach as per the relative valuation method and/ or technical analysis taking into consideration both short-term and long-term scenarios.
Note 5: ‘Kalkine reports are prepared based on the stock prices captured either from the London Stock Exchange (LSE) and or REFINITIV. Typically, both sources (LSE and or REFINITIV) may reflect stock prices with a delay which could be a lag of 15-20 minutes. There can be no assurance that future results or events will be consistent with the information provided in the report. The information is subject to change without any prior notice.’
Note 6: Dividend Yield may vary as per the stock price movement.
Technical Indicators Defined: -
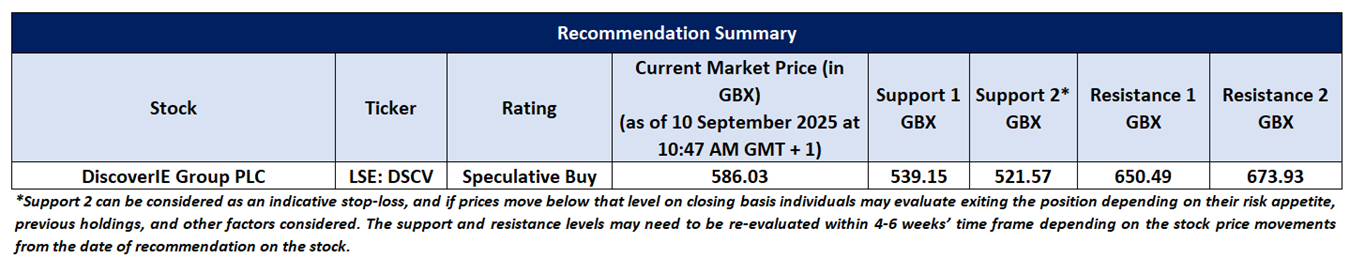
Support: A level at which the stock prices tend to find support if they are falling, and a downtrend may take a pause backed by demand or buying interest. Support 1 refers to the nearby support level for the stock and if the price breaches the level, then Support 2 may act as the crucial support level for the stock.
Resistance: A level at which the stock prices tend to find resistance when they are rising, and an uptrend may take a pause due to profit booking or selling interest. Resistance 1 refers to the nearby resistance level for the stock and if the price surpasses the level, then Resistance 2 may act as the crucial resistance level for the stock.
Stop-loss: It is a level to protect further losses in case of unfavourable movement in the stock prices.
Disclaimer-
This report has been issued by Kalkine Limited (Company number 07903332), a private limited company, incorporated in England and Wales ("Kalkine”). Kalkine.co.uk and associated pages are published by Kalkine. Kalkine is authorised and regulated by the Financial Conduct Authority under reference number 579414.
The information in this report and on the Kalkine website has been prepared from a wide variety of sources, which Kalkine, to the best of its knowledge and belief, considers accurate. Kalkine has made every effort to ensure the reliability of information contained in its reports, newsletters and websites. All information represents our views at the date of publication and may change without notice. The information in this report does not constitute an offer to sell securities or other financial products or a solicitation of an offer to buy securities or other financial products. Our reports contain non personalized recommendations to invest in securities and other financial products.
Kalkine does not offer financial advice based upon your personal financial situation or goals, and we shall not be held liable for any investment or trading losses you may incur by using the opinions expressed in our reports, publications, market updates, news alerts and corporate profiles. Kalkine does not intend to exclude any liability which it is not permitted to exclude under applicable law or regulation. Kalkine’s non-personalised advice does not in any way endorse or recommend individuals, investment products or services for your personal financial situation. You should discuss your portfolios and the risk tolerance level appropriate for your personal financial situation, with a professional authorised financial planner and adviser. You should be aware that the value of any investment and the income from it can go down as well as up and you may not get back the amount invested.
Please also read our Terms & Conditions for further information. Employees and/or associates of Kalkine and its related entities may hold interests in the securities or other financial products covered in this report or on the Kalkine website. Any such employees and associates are required to comply with certain safeguards, procedures and disclosures as required by law.
Kalkine Media Limited, an affiliate of Kalkine, may have received, or be entitled to receive, financial consideration in connection with providing information about certain entity(s) covered on its website including entities covered in this report.
Past performance is not a reliable indicator of future performance.

 Please wait processing your request...