This report is an updated version of the report published on 18 June 2025 at 2:34 PM AEST.
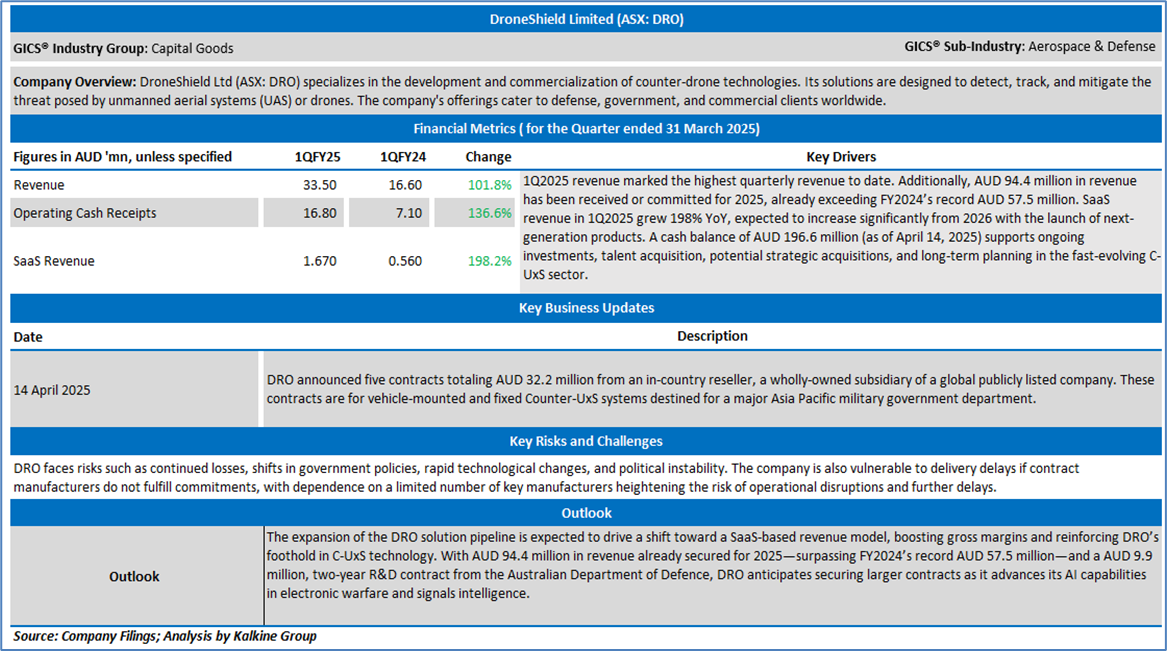
Company Overview: DroneShield Limited (ASX: DRO) specialises in the development and commercialization of counter-drone technologies. DRO delivers counter-UAS solutions leveraging Radio Frequency (RF) sensing, Artificial Intelligence (AI) and Machine Learning (ML), sensor fusion, electronic warfare, rapid prototyping, and MIL-SPEC-grade manufacturing. The company's offerings cater to defense, government, and commercial clients worldwide. Appen Limited (ASX: APX) specialises in providing data for the AI lifecycle, backed by over 28 years of expertise in data sourcing, annotation, and evaluation. With a diverse crowd of over 1 million skilled contractors fluent in more than 500 languages, the company enables organisations to develop innovative AI systems. Its comprehensive products and services instil confidence in leaders across technology, automotive, finance, retail, healthcare, and government sectors. This Global Artificial Intelligence & Emerging Technologies Report covers the Company Overview & Price performance, Summary table, Key positives & negatives, Key metrics, Company details, technical guidance & Stock recommendation, and Price chart.
Section 1.0: Key Metrics in Pictures
Having looked at the key financial metrics above the below sections provide in-depth fundamental, and technical analysis on this AI-based stock along with recommendation, technical support, and resistance level & indicative stop-loss.
Section 2.0: DroneShield Limited (ASX: DRO) (‘Speculative Buy’ at AUD 1.873, current market price per share as on 18 June 2025
2.1 Company Details

2.2 Valuation, Technical Summary & Stock Recommendation
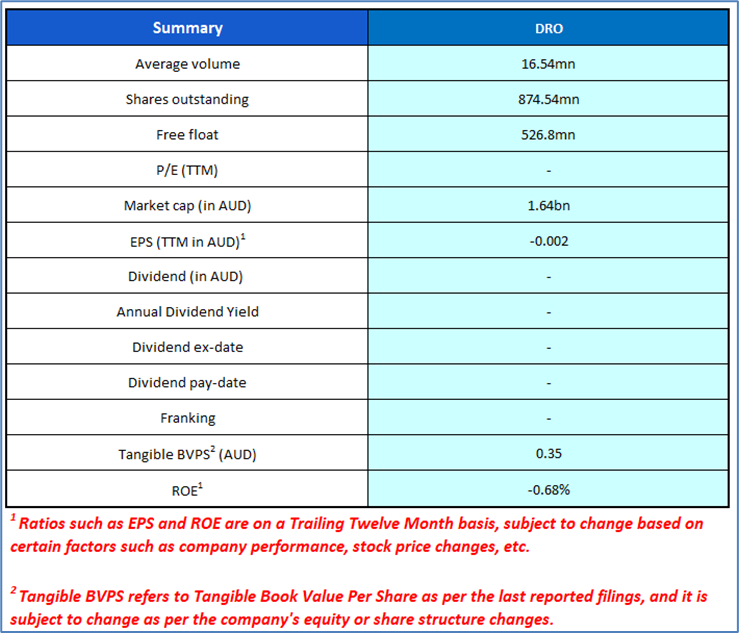
The stock has increased by ~16.5% in last one week, whereas over the last one year, it has moved up by ~21.4%. The stock has a 52-week low and 52-week high of AUD 0.585 and AUD 2.720, respectively and is currently trading above the 52-week high-low average. DRO was last covered in a report dated ’30 April 2025’.


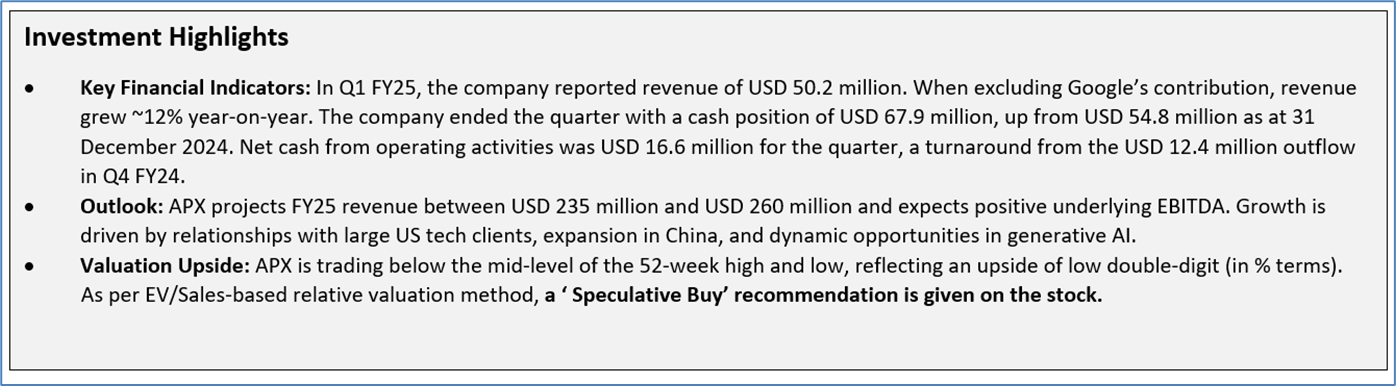
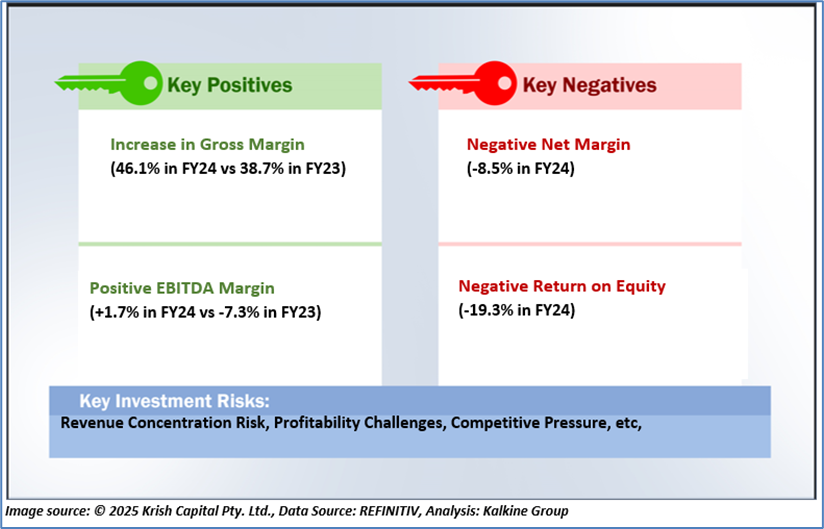
Appen Limited (ASX: APX)
_06_18_2025_11_35_02_161263.png)
Section 3.0: Key Metrics in Pictures
_06_18_2025_11_35_59_445839.png)
Having looked at the key financial metrics above the below sections provide in-depth fundamental, and technical analysis on this Technology Stock along with recommendation, technical support, and resistance level & indicative stop-loss.
Section 4.0: Appen Limited (ASX: APX) (‘Speculative Buy’ at AUD 0.955, current market price per share as on 18 June 2025)
4.1 Company Details

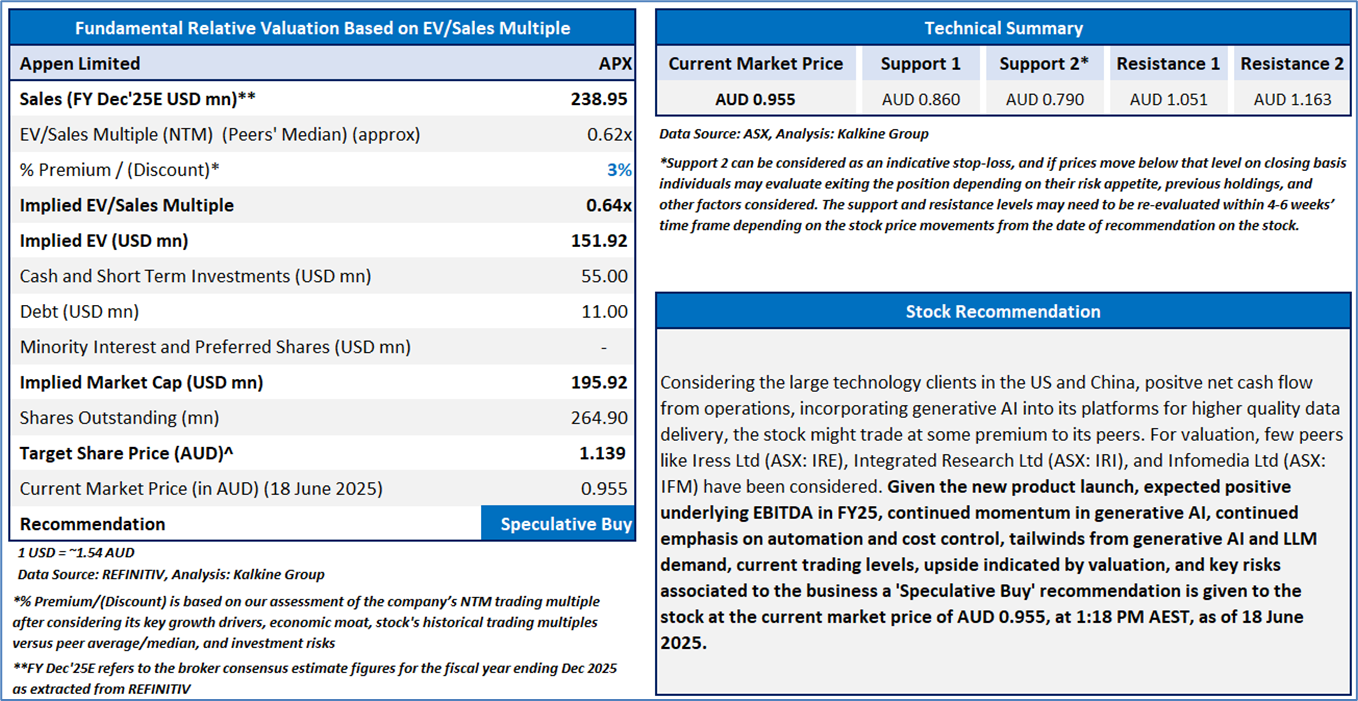
4.2 Valuation, Technical Summary & Stock Recommendation
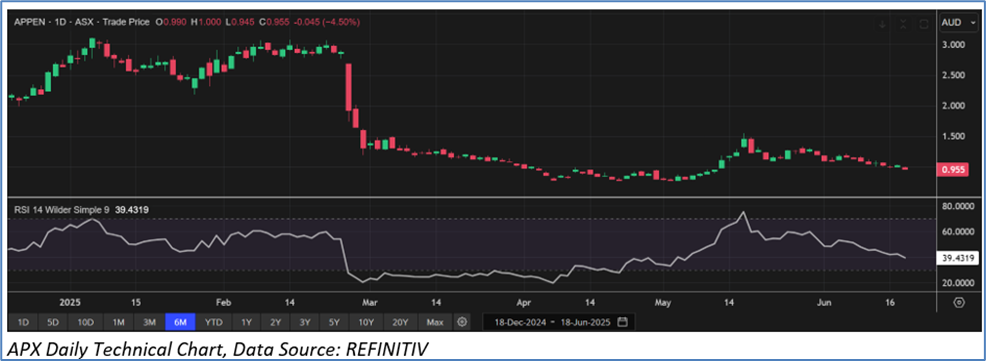
The stock has decreased by ~19.9% in last one month, and over the last three months, it has moved down by ~14.7%. The stock has a 52-week low and 52-week high of AUD 0.425 and AUD 3.11, respectively and is currently trading below the 52-week high-low average. APX was last covered in a report dated ’13 May 2025’.
Markets are trading in a highly volatile zone currently due to certain macro-economic issues and geopolitical issues prevailing geopolitical tensions. Therefore, it is prudent to follow a cautious approach while investing.
Note 1: Past performance is neither an Indicator nor a guarantee of future performance.
Note 2: The reference date for all price data, currency, technical indicators, support, and resistance levels is 18 June 2025. The reference data in this report has been partly sourced from REFINITIV.
Note 3: Investment decisions should be made depending on an individual’s appetite for upside potential, risks, holding duration, and any previous holdings. An ‘Exit’ from the stock can be considered if the Target Price mentioned as per the Valuation and or the technical levels provided has been achieved and is subject to the factors discussed above.
Note 4: Kalkine reports are prepared based on the stock prices captured either from REFINITIV or Trading View. Typically, REFINITIV or Trading View may reflect stock prices with a delay which could be a lag of 25-30 minutes. There can be no assurance that future results or events will be consistent with the information provided in the report. The information is subject to change without any prior notice.
Technical Indicators Defined: -
Support: A level at which the stock prices tend to find support if they are falling, and a downtrend may take a pause backed by demand or buying interest. Support 1 refers to the nearby support level for the stock and if the price breaches the level, then Support 2 may act as the crucial support level for the stock.
Resistance: A level at which the stock prices tend to find resistance when they are rising, and an uptrend may take a pause due to profit booking or selling interest. Resistance 1 refers to the nearby resistance level for the stock and if the price surpasses the level, then Resistance 2 may act as the crucial resistance level for the stock.
Stop-loss: It is a level to protect further losses in case of unfavourable movement in the stock prices.
Disclaimer-
This report has been issued by Kalkine Limited (Company number 07903332), a private limited company, incorporated in England and Wales ("Kalkine”). Kalkine.co.uk and associated pages are published by Kalkine. Kalkine is authorised and regulated by the Financial Conduct Authority under reference number 579414.
The information in this report and on the Kalkine website has been prepared from a wide variety of sources, which Kalkine, to the best of its knowledge and belief, considers accurate. Kalkine has made every effort to ensure the reliability of information contained in its reports, newsletters and websites. All information represents our views at the date of publication and may change without notice. The information in this report does not constitute an offer to sell securities or other financial products or a solicitation of an offer to buy securities or other financial products. Our reports contain non personalized recommendations to invest in securities and other financial products.
Kalkine does not offer financial advice based upon your personal financial situation or goals, and we shall not be held liable for any investment or trading losses you may incur by using the opinions expressed in our reports, publications, market updates, news alerts and corporate profiles. Kalkine does not intend to exclude any liability which it is not permitted to exclude under applicable law or regulation. Kalkine’s non-personalised advice does not in any way endorse or recommend individuals, investment products or services for your personal financial situation. You should discuss your portfolios and the risk tolerance level appropriate for your personal financial situation, with a professional authorised financial planner and adviser. You should be aware that the value of any investment and the income from it can go down as well as up and you may not get back the amount invested.
Please also read our Terms & Conditions for further information. Employees and/or associates of Kalkine and its related entities may hold interests in the securities or other financial products covered in this report or on the Kalkine website. Any such employees and associates are required to comply with certain safeguards, procedures and disclosures as required by law.
Kalkine Media Limited, an affiliate of Kalkine, may have received, or be entitled to receive, financial consideration in connection with providing information about certain entity(s) covered on its website including entities covered in this report.
Past performance is not a reliable indicator of future performance.
 Please wait processing your request...