Section 1: Company Overview and Fundamentals
1.1 Company Overview:
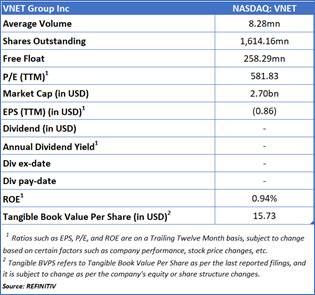
VNET Group Inc (NASDAQ: VNET) operates as a holding company primarily focused on delivering carrier- and cloud-neutral data center services. Its offerings span managed hosting, cloud solutions, and virtual private network (VPN) services.
Kalkine’s American Tech Report covers the Company Overview, Key positives & negatives, Investment summary, Key investment metrics, Top 10 shareholding, Business updates and insights into company recent financial results, Key Risks & Outlook, Price performance and technical summary, Target Price, and Recommendation on the stock.
Price Performance:
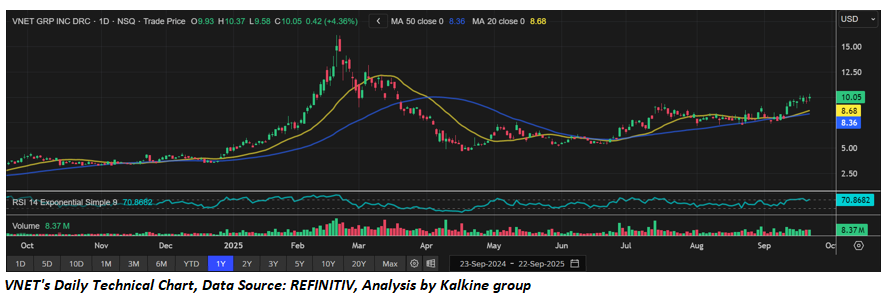
- The stock experienced a massive rally from late 2024 into early 2025, peaking above USD 14 in March before undergoing a steep correction, retracing nearly 60%. Since May, the price has been in a consolidation-to-recovery phase, establishing higher lows and recently breaking above USD 10. This indicates buyers are regaining control.
- Recent up-moves have been accompanied by relatively healthy volume (8.37M), confirming buying interest. Sustained higher volume on up days supports the bullish breakout.
- The 20-day MA (USD 8.68) has crossed above the 50-day MA (USD 8.36), forming a bullish crossover, which often signals the start of an uptrend. Current price (USD 10.05) is comfortably above both averages, reinforcing near-term bullish momentum.
- RSI is at 70.9, which is at the overbought threshold. This suggests strong momentum but also raises caution for potential short-term pullbacks or profit-taking.
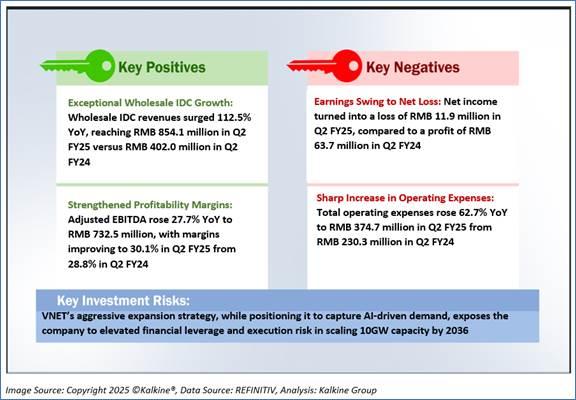
1.2 The Key Positives, Negatives, and Investment summary
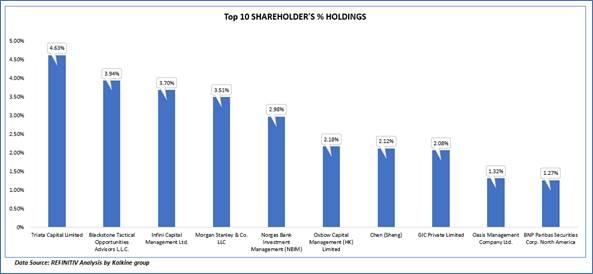
1.3 Top 10 shareholders:
The top 10 shareholders together form ~27.72% of the total shareholding, signifying concentrated shareholding. Triata Capital Limited, and Blackstone Tactical Opportunities Advisors L.L.C. are the biggest shareholders, holding the maximum stake in the company at ~4.63% and ~3.94%, respectively.
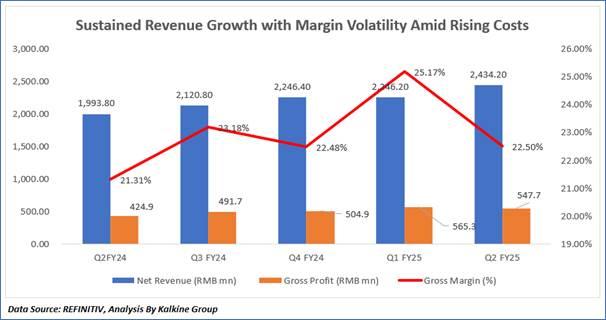
1.4 Key Metrics:
VNET illustrates a steady upward trajectory for net revenues over the last five quarters, rising from RMB 1,993.8 million in Q2 FY24 to RMB 2,434.2 million in Q2 FY25. This sustained growth was primarily driven by the wholesale IDC segment, which benefitted from strong customer move-ins and significant new capacity additions. Gross profit followed a similar trend, expanding from RMB 424.9 million in Q2 FY24 to RMB 547.7 million in Q2 FY25, reflecting not only top-line growth but also enhanced efficiency in data center operations. However, gross margin performance was more volatile. It climbed steadily through Q3 and Q4 FY24, reaching a peak of 25.2% in Q1 FY25, supported by strong wholesale utilization and operating leverage. Yet, in Q2 FY25, gross margin moderated to 22.5%, as higher operating costs, increased spending in general and administrative functions, and the relatively slower recovery in retail IDC utilization offset the positive wholesale momentum. Overall, while revenue and profit growth highlight the company’s robust business execution, the margin fluctuations underscore the impact of cost pressures and mixed performance across business segments.
Section 2: Business Updates and Financial Highlights
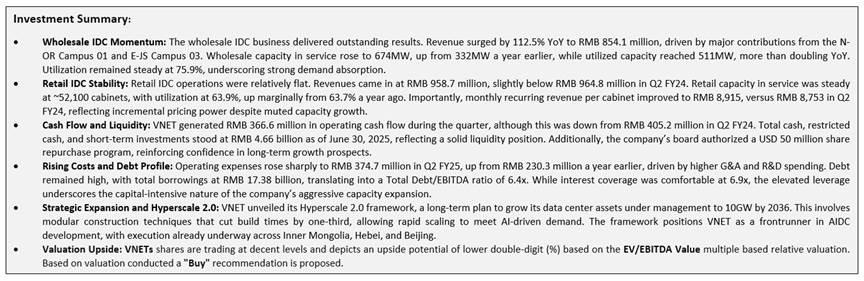
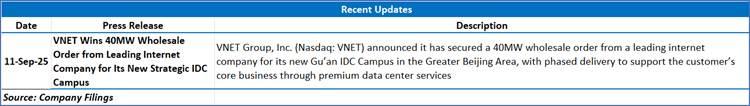
2.1 Recent Updates:
The below picture gives an overview of the recent updates:
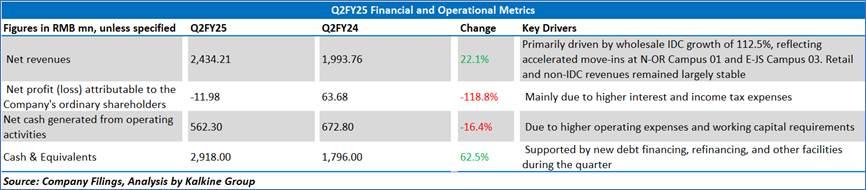
2.2 Insights of Q2FY25:
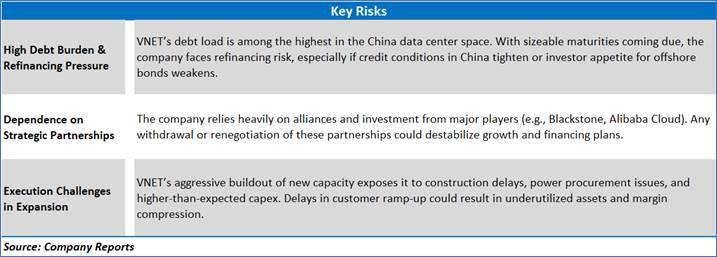
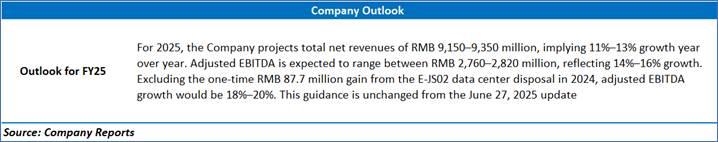
Section 3: Key Risks and Outlook:
Section 4: Stock Recommendation Summary:
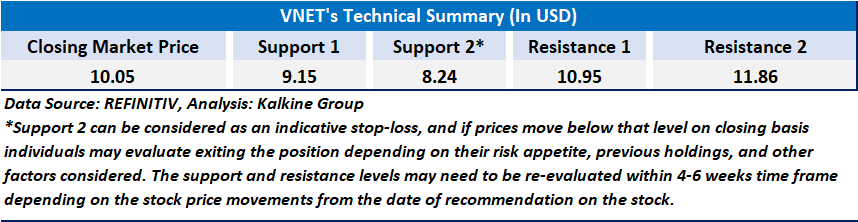
4.1 Technical Summary:
Price Performance:
- The stock experienced a massive rally from late 2024 into early 2025, peaking above USD 14 in March before undergoing a steep correction, retracing nearly 60%. Since May, the price has been in a consolidation-to-recovery phase, establishing higher lows and recently breaking above USD 10. This indicates buyers are regaining control.
- Recent up-moves have been accompanied by relatively healthy volume (8.37M), confirming buying interest. Sustained higher volume on up days supports the bullish breakout.
- The 20-day MA (USD 8.68) has crossed above the 50-day MA (USD 8.36), forming a bullish crossover, which often signals the start of an uptrend. Current price (USD 10.05) is comfortably above both averages, reinforcing near-term bullish momentum.
- RSI is at 70.9, which is at the overbought threshold. This suggests strong momentum but also raises caution for potential short-term pullbacks or profit-taking.
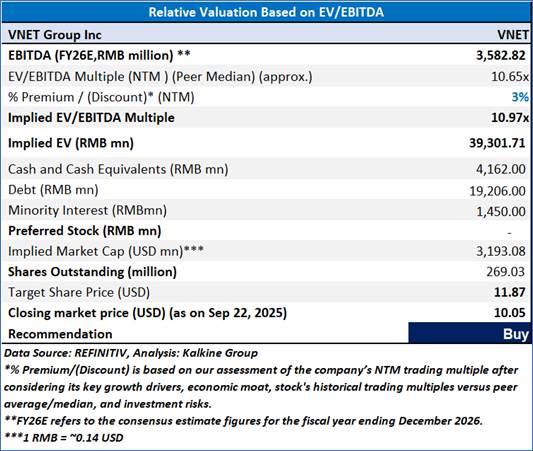
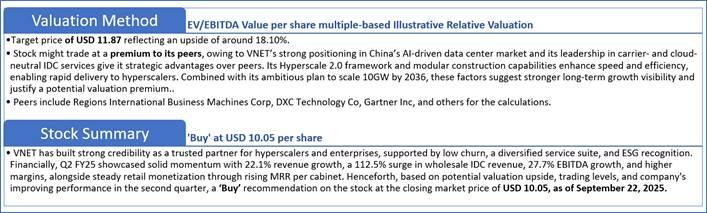
4.2 Fundamental Valuation
Valuation Methodology: EV/EBITDA Multiple Based Relative Valuation
Markets are trading in a highly volatile zone currently due to certain macroeconomic issues and geopolitical tensions prevailing. Therefore, it is prudent to follow a cautious approach while investing.
Note 1: Past performance is not a reliable indicator of future performance.
Note 2: The reference date for all price data, currency, technical indicators, support, and resistance levels is September 22, 2025. The reference data in this report has been partly sourced from REFINITIV.
Note 3: Investment decisions should be made depending on an individual's appetite for upside potential, risks, holding duration, and any previous holdings. An 'Exit' from the stock can be considered if the Target Price mentioned as per the Valuation and or the technical levels provided has been achieved and is subject to the factors discussed above.
Note 4: The report publishing date is as per the Pacific Time Zone.
Technical Indicators Defined: -
Support: A level at which the stock prices tend to find support if they are falling, and a downtrend may take a pause backed by demand or buying interest. Support 1 refers to the nearby support level for the stock and if the price breaches the level, then Support 2 may act as the crucial support level for the stock.
Resistance: A level at which the stock prices tend to find resistance when they are rising, and an uptrend may take a pause due to profit booking or selling interest. Resistance 1 refers to the nearby resistance level for the stock and if the price surpasses the level, then Resistance 2 may act as the crucial resistance level for the stock.
Stop-loss: It is a level to protect against further losses in case of unfavorable movement in the stock prices.
Disclaimer-
This report has been issued by Kalkine Limited (Company number 07903332), a private limited company, incorporated in England and Wales ("Kalkine”). Kalkine.co.uk and associated pages are published by Kalkine. Kalkine is authorised and regulated by the Financial Conduct Authority under reference number 579414.
The information in this report and on the Kalkine website has been prepared from a wide variety of sources, which Kalkine, to the best of its knowledge and belief, considers accurate. Kalkine has made every effort to ensure the reliability of information contained in its reports, newsletters and websites. All information represents our views at the date of publication and may change without notice. The information in this report does not constitute an offer to sell securities or other financial products or a solicitation of an offer to buy securities or other financial products. Our reports contain non personalized recommendations to invest in securities and other financial products.
Kalkine does not offer financial advice based upon your personal financial situation or goals, and we shall not be held liable for any investment or trading losses you may incur by using the opinions expressed in our reports, publications, market updates, news alerts and corporate profiles. Kalkine does not intend to exclude any liability which it is not permitted to exclude under applicable law or regulation. Kalkine’s non-personalised advice does not in any way endorse or recommend individuals, investment products or services for your personal financial situation. You should discuss your portfolios and the risk tolerance level appropriate for your personal financial situation, with a professional authorised financial planner and adviser. You should be aware that the value of any investment and the income from it can go down as well as up and you may not get back the amount invested.
Please also read our Terms & Conditions for further information. Employees and/or associates of Kalkine and its related entities may hold interests in the securities or other financial products covered in this report or on the Kalkine website. Any such employees and associates are required to comply with certain safeguards, procedures and disclosures as required by law.
Kalkine Media Limited, an affiliate of Kalkine, may have received, or be entitled to receive, financial consideration in connection with providing information about certain entity(s) covered on its website including entities covered in this report.
Past performance is not a reliable indicator of future performance.

 Please wait processing your request...