Softcat PLC
Softcat PLC (LSE: SCT) is an FTSE 250 listed IT infrastructure provider catering to the corporate and public sectors, with world-class customer service. The Company has around 200 of the best vendors worldwide to provide customers with the best solution to meet their needs. This report covers the key recommendation rationale and conclusion for the stock.
Key Recommendation Rationale – Sell at GBX 1,720.00
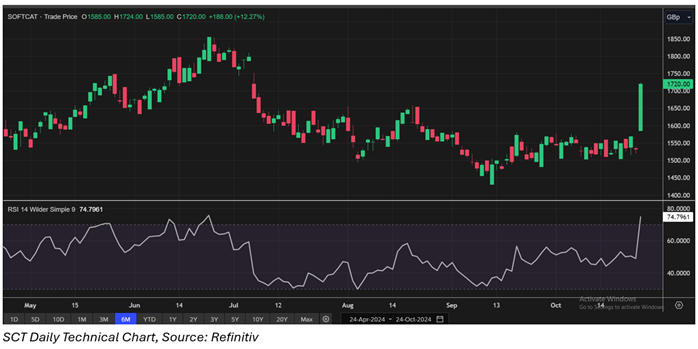
- Resistance near Current levels: SCT’s stock price has breached the Resistance (R1) which was stated in the previous report on 07 August 2024 therefore, there can be a possibility of a decline from resistance levels. Considering the market conditions and the price action, it is prudent to exit the stock.
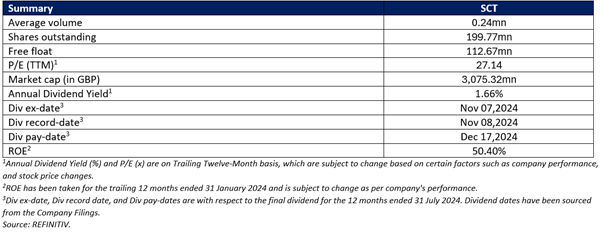
- Revenue Decline Raises Concerns: Despite strong growth in gross invoiced income and gross profit, Softcat's revenue experienced a decline of 2.3% year-on-year during FY24. This downturn may indicate challenges in maintaining sales momentum amidst a shifting market landscape, potentially raising concerns among investors about long-term sustainability.
- Economic Headwinds Affecting Demand: SCT highlights prolonged sales cycles and deferred spending due to adverse UK economic conditions. Such external pressures may hinder future growth prospects and reflect a vulnerability to macroeconomic fluctuations, which could impact Softcat's ability to capitalize on market opportunities effectively.
- Heavy Investment May Strain Resources: Softcat's significant headcount growth of 14.3% during FY24 indicates a strong commitment to expanding capabilities; however, this rapid scaling might lead to operational inefficiencies or strain existing resources. If not managed properly, these investments could affect overall productivity and profit margins in the short term.
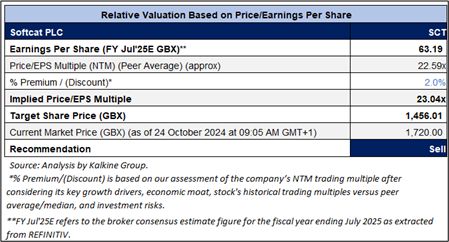
Valuation Methodology: Price/ Earnings Approach
Share Price Chart
Conclusion
SCT is expected to trade at a premium considering the lowering of inflation, cutting of the interest rates, given outlook and guidance, etc. For conducting the valuation, the following peers have been considered: Sage Group PLC (LSE: SGE), Computacenter PLC (LSE: CCC) and Bytes Technology Group PLC (LSE: BYIT).
Given its current trading levels, the recent rally in the share price, relative valuation, and risks associated, it is prudent to book profit at the current levels. Hence, a ‘Sell’ recommendation is given on the stock at the current market price of GBX 1,720.00, (as of 24 October 2024, at 09:05 AM GMT+1).
Note 1: Past performance is not a reliable indicator of future performance.
Note 2: The reference date for all price data, currency, technical indicators, support, and resistance level is 24 October 2024. The reference data in this report has been partly sourced from REFINITIV.
Note 3: Investment decisions should be made depending on an individual's appetite for upside potential, risks, holding duration, and any previous holdings. An 'Exit' from the stock can be considered if the Target Price mentioned as per the Valuation and or the technical levels provided has been achieved and is subject to the factors discussed above.
Note 4: Target Price refers to a price level which the stock is expected to reach as per the relative valuation method and/or technical analysis taking into consideration both short-term and long-term scenario.
Note 5: ‘Kalkine reports are prepared based on the stock prices captured either from the London Stock Exchange (LSE) and or REFINITIV. Typically, both sources (LSE and or REFINITIV) may reflect stock prices with a delay which could be a lag of 15-20 minutes. There can be no assurance that future results or events will be consistent with the information provided in the report. The information is subject to change without any prior notice.’
Note 6: Dividend Yield may vary as per the stock price movement.
Technical Indicators Defined: -
Support: A level at which the stock prices tend to find support if they are falling, and a downtrend may take a pause backed by demand or buying interest. Support 1 refers to the nearby support level for the stock and if the price breaches the level, then Support 2 may act as the crucial support level for the stock.
Resistance: A level at which the stock prices tend to find resistance when they are rising, and an uptrend may take a pause due to profit booking or selling interest. Resistance 1 refers to the nearby resistance level for the stock and if the price surpasses the level, then Resistance 2 may act as the crucial resistance level for the stock.
Stop-loss: It is a level to protect further losses in case of unfavourable movement in the stock prices.

 Please wait processing your request...