RTX Corporation
RTX Corporation (NYSE: RTX) is an aerospace and defence company, which provides advanced systems and services for commercial, military, and government customers worldwide. The Company operates through three segments: Collins Aerospace, Pratt & Whitney, and Raytheon.
Key Business and Financial Updates:
- Q3 FY2025 Snapshot: Growth, Margins, and Upgraded Outlook: RTX delivered Q3 sales of USD 22.5 billion (+12% YoY; +13% organic) and adjusted EPS of USD 1.70 (+17% YoY), marking the sixth consecutive quarter of adjusted segment margin expansion. GAAP EPS was USD 1.41 (including USD 0.29 acquisition accounting, USD 0.01 restructuring, and USD 0.01 other items). Management raised FY2025 guidance to adjusted sales of USD 86.5–87.0 billion (from USD 84.75–85.5 billion), organic growth of 8–9% (from 6–7%), adjusted EPS of USD 6.10–6.20 (from USD 5.80–5.95), and reaffirmed free cash flow of USD 7.0–7.5 billion.
Analysis: Robust top-line expansion and upward guidance highlight strong execution and sustained demand momentum across business segments.
- Cash Generation, Backlog, and Capital Deployment: Operating cash flow was USD 4.6 billion with free cash flow of USD 4.0 billion; RTX returned USD 0.9 billion to shareowners and reduced debt by USD 2.9 billion in the quarter. Total backlog reached USD 251 billion (USD 148 billion commercial / USD 103 billion defense), underpinned by USD 37 billion of new awards, supporting multi-year visibility across civil and defense programs. RTX also completed the divestiture of Collins’ actuation and flight control business, sharpening portfolio focus.
Analysis: Exceptional cash generation and disciplined capital deployment enhance balance sheet strength and future growth visibility.
- Collins Aerospace: Commercial Strength with Mix/Trade Headwinds Managed: Collins posted USD 7.62 billion in sales (+8%) with adjusted operating profit of USD 1.19 billion (+9%) and 15.7% ROS (+20 bps). Growth was led by commercial OE +16% (narrowbody volume), commercial aftermarket +13% (parts, repairs, retrofit), and defense +6% (including SAOC). Profit reflected drop-through on higher volumes and lower R&D, offset by unfavorable commercial OE mix and higher tariffs; reported profit (USD 1.26 billion) included the gain on the divested business.
Analysis: Solid commercial recovery continues to offset headwinds, reinforcing Collins as a key profitability driver.
- Pratt & Whitney: Aftermarket and Military Drive Upside: Pratt & Whitney delivered USD 8.42 billion in sales (+16%) and USD 751 million in adjusted operating profit (+26%), with 8.9% ROS (+70 bps). Growth drivers included commercial aftermarket +23%, military +15% (F135, Lot 18 award), and commercial OE +5% (large engines, favorable P&W Canada mix). Margin expansion came from aftermarket and military drop-through, partly offset by higher large-engine OE deliveries, higher SG&A, and tariff headwinds.
Analysis: Sustained military strength and aftermarket demand underpin Pratt & Whitney’s strong earnings momentum.
- Raytheon: Defense Momentum and Mix Benefits: Raytheon recorded USD 7.05 billion in sales (+10%) and USD 859 million in adjusted operating profit (+30%), with 12.2% ROS (+180 bps). Strength was broad-based across land and air defense (international Patriot) and naval programs (classified programs, SM-6, ESSM), with favorable program mix and productivity driving outsized profit growth. Management’s focus now centers on converting the USD 251 billion backlog, ramping output on critical programs, and continuing investment in next-generation products and services to sustain growth and shareholder returns.
Analysis: Expanding defense order flow and favourable mix position Raytheon as a core growth engine within RTX’s diversified portfolio.
Technical Observation (on the daily chart):
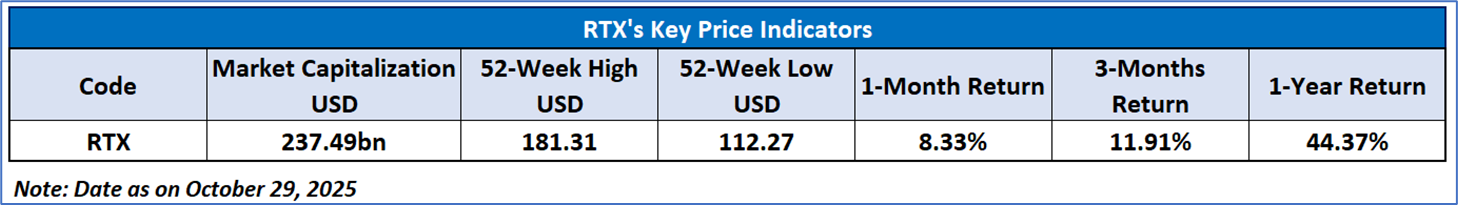
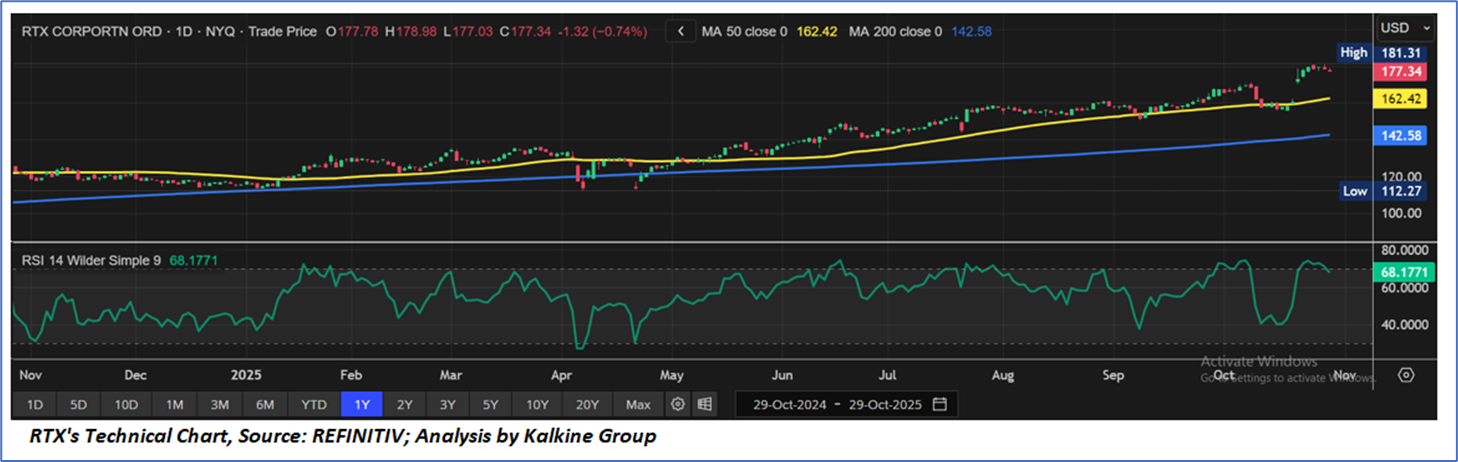
- Price Trend and Moving Averages: RTX Corporation (NYSE: RTX) trades at USD 177.34, sustaining a solid uptrend above its 50-day (USD 162.42) and 200-day (USD 142.58) moving averages. The consistent higher-high pattern underscores bullish momentum and investor confidence following strong Q3 results and raised FY2025 guidance.
- Momentum Indicators and Market Sentiment: The RSI at 68.18 indicates firm bullish momentum, nearing overbought territory. While a brief consolidation may occur, overall sentiment remains positive, supported by RTX’s steady performance, healthy backlog, and improving profitability.
- Technical Outlook and Key Levels: Key support lies near USD 162–165, with resistance around USD 181–183. A breakout above resistance could lead to USD 190, while maintaining levels above the 50-day average signals ongoing strength. The stock’s outlook remains constructively bullish, backed by robust fundamentals and resilient demand trends.
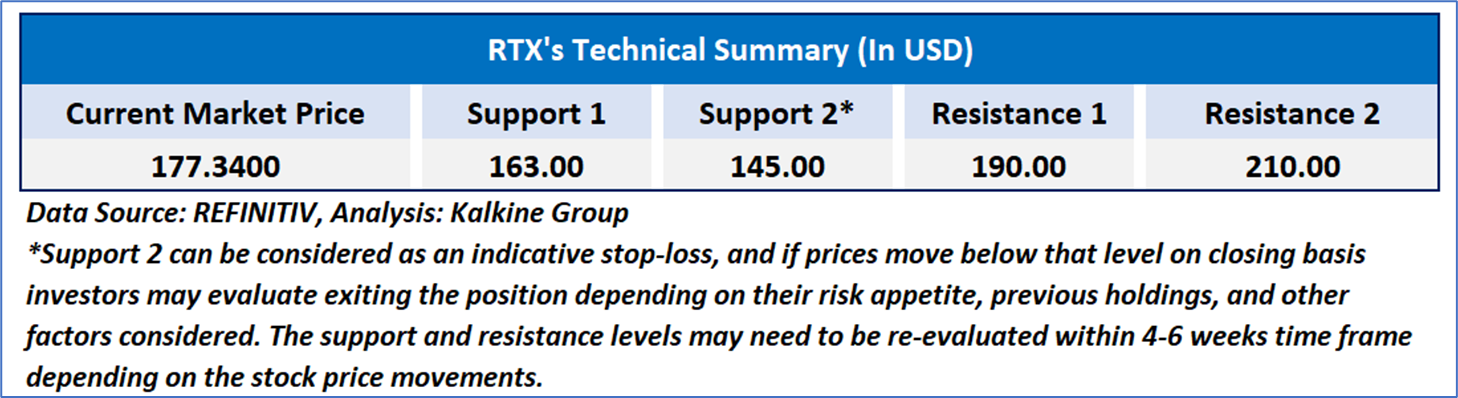
Individuals can evaluate the stock based on the support and resistance levels provided in the report in case of keen interest taking into consideration the risk-reward scenario.
Markets are trading in a highly volatile zone currently due to certain macro-economic issues and prevailing geopolitical tensions. Therefore, it is prudent to follow a cautious approach while investing.
Related Risk: This report may be looked at from a high-risk perspective, and a recommendation is provided for a short duration. This report is solely based on technical parameters, and the fundamental performance of the stocks has not been considered in the decision-making process. Other factors which could impact the stock prices include market risks, regulatory risks, interest rates risks, currency risks, social and political instability risks etc.
Note 1: Past performance is not a reliable indicator of future performance.
Note 2: The reference date for all price data, currency, technical indicators, support, and resistance level is October 29, 2025. The reference data in this report has been partly sourced from REFINITIV.
Note 3: Investment decisions should be made depending on an individual's appetite for upside potential, risks, holding duration, and any previous holdings. An 'Exit' from the stock can be considered if the Target Price mentioned as per the Valuation and or the technical levels provided has been achieved and is subject to the factors discussed above.
Note 4: Target Price refers to a price level that the stock is expected to reach as per the relative valuation method and or technical analysis taking into consideration both short-term and long-term scenarios.
Note 5: ‘Kalkine reports are prepared based on the stock prices captured either from the New York Stock Exchange (NYSE), NASDAQ Capital Markets (NASDAQ), and or REFINITIV. Typically, all sources (NYSE, NASDAQ, or REFINITIV) may reflect stock prices with a delay which could be a lag of 15-20 minutes. There can be no assurance that future results or events will be consistent with the information provided in the report. The information is subject to change without any prior notice.

 Please wait processing your request...