This report is an updated version of the report published on 27 February 2025 at 08:05 AM GMT
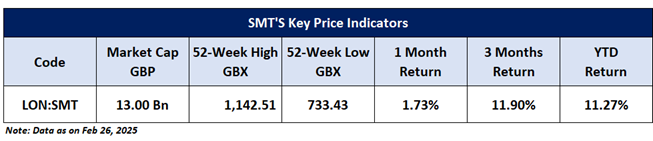
Company Overview: Scottish Mortgage Investment Trust PLC (LSE: SMT) is an FTSE 100 index listed investment trust that invests globally, looking for strong businesses with above-average returns. This Report covers the Price Action, Technical Indicators Analysis along with the Support Levels, Resistance Levels, and Recommendations on this stock.
H1 FY25 Results (for the six months ended 30 September 2024)
The interim financial report for the six months ending 30 September 2024 reveals a mixed performance for the company. While the net asset value (NAV) increased by 1.9%, it lagged behind the FTSE All-World Index's 3.6% rise during the same period. Over the past five years, however, the company outperformed the index with an 88.9% gain, compared to the index's 66.9%. The company’s focus on long-term capital appreciation continues, alongside a steady commitment to providing dividends. Key investments in AI, electrification, and Chinese companies reflect the company's strategy to position itself for future growth in transformative technologies, despite facing challenges with certain larger positions like Moderna and Northvolt. The appointment of Christopher Samuel as an independent non-executive director marks a shift in the board's composition, with plans for leadership changes in the coming years.
SMT’s Technical Observation:
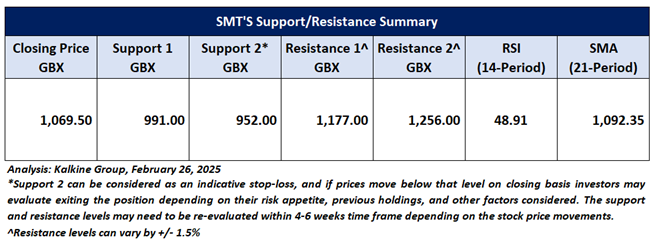
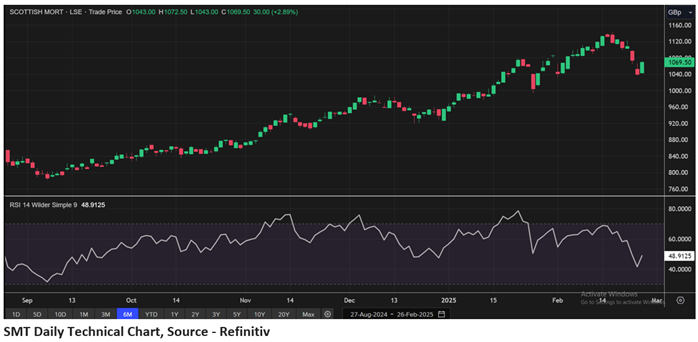
The stock is showing a robust upward trend, trading above a significant horizontal support level, indicating potential for continued growth. Bullish candlestick patterns further reinforce this positive outlook, suggesting possible gains ahead. The 14-day Relative Strength Index (RSI) is at 48.91, leaving room for further upward movement before reaching overbought territory. Additionally, the stock remains above the 50-period simple moving average (SMA), which provides support. These technical indicators and support levels together suggest that the stock's positive momentum could continue in the near term.
SMT’s Daily Chart
As per the above-mentioned price action and technical indicators analysis, a ‘Buy’ rating has been given on Scottish Mortgage Investment Trust PLC (LSE: SMT) at the closing Price of GBX 1,069.50, as of February 26, 2025. Individuals can evaluate the stock based on the support and resistance levels provided in the report in case of keen interest taking into consideration the risk-reward scenario.
Markets are trading in a highly volatile zone currently due to certain Macro & Micro-economic data and prevailing geopolitical tensions. Therefore, it is prudent to follow a cautious approach while investing.
Note 1: Past performance is not a reliable indicator of future performance.
Note 2: Investment decisions should be made depending on an individual’s appetite for upside potential, risks, and any previous holdings. This recommendation is purely based on technical analysis, and fundamental analysis has not been considered in this report. Individuals can consider exiting from the stock if the Target Price or Stop loss mentioned as per the technical analysis has been achieved and is subject to the factors discussed above.
Note 3: Related Risks: This report may be looked at from a high-risk perspective and recommendations are provided for a short duration. Recommendations provided in this report are solely based on technical parameters, and the fundamental performance of the stocks has not been considered in the decision-making process. Other factors which could impact the stock prices include market risks, regulatory risks, interest rate risks, currency risks, social and political instability risks etc.
Note 4: How to Read the Charts?
The Green colour line reflects the 21-period moving average while the red line indicates the 50- period moving average. SMA helps to identify existing price trends. If the prices are trading above the 21-period and 50-period moving average, then it shows prices are currently trading in a bullish trend.
The Black colour line in the chart’s lower segment reflects the Relative Strength Index (14-Period) which indicates price momentum and signals momentum in trend. A reading of 70 or above suggests overbought status while a reading of 30 or below suggests an oversold status.
The Blue colour bars in the chart’s lower segment show the volume of the stock. The volume is the number of shares that changed hands during a given day. Stocks with high volumes are more liquid than stocks with lesser volume as liquidity in stocks helps in easier and faster execution of the order.
The Orange colour lines are the trend lines drawn by connecting two or more price points and used for trend identification purposes. The trend line also acts as a line of support and resistance.
Technical Indicators Defined: -
Support: A level at which the stock prices tend to find support if they are falling, and a downtrend may take a pause backed by demand or buying interest. Support 1 refers to the nearby support level for the stock and if the price breaches the level, then Support 2 may act as the crucial support level for the stock.
Resistance: A level at which stock prices tend to find resistance when they are rising, and an uptrend may take a pause due to profit booking or selling interest. Resistance 1 refers to the nearby resistance level for the stock and if the price surpasses the level, then Resistance 2 may act as the crucial resistance level for the stock.
Stop-loss: It is a level to protect against further losses in case of unfavorable movement in the stock prices.
The reference date for all price data, currency, technical indicators, support, and resistance levels is February 26, 2025. The reference data in this report has been partly sourced from REFINITIV.
Abbreviations
CMP: Current Market Price
SMA: Simple Moving Average
GBP: British pound sterling
GBX: British pence sterling
RSI: Relative Strength Index
USD: United States dollar
Note: Trading decisions require a thorough analysis by individuals. Technical reports in general chart out metrics that may be assessed by individuals before any stock evaluation. The above are illustrative analytical factors used for evaluating stocks; other parameters can be looked at along with additional risks per se. Past performance is neither an indicator nor a guarantee of future performance.

 Please wait processing your request...