Company Overview: Jangada Mines Plc (LSE: JAN) is a United Kingdom-based exploration and development company. The Company is focused on developing a sediment-hosted copper and silver project in Morocco. Its operations include the Agadir Melloul project and the Igli project. This Report covers the Price Action, Technical Indicators Analysis along with the Support Levels, Resistance Levels, and Recommendations on this stock.
Fundamental Highlights:
Positive Exploration Update for Paranaíta Gold Project
Jangada Mines Plc (LSE: JAN) has reported decent progress on its exploration efforts at the Paranaíta Gold Project in Brazil, with plans to increase the current resource from 210,000 oz to approximately 350,000 oz Au. The company has completed 21 out of 31 planned trenches, identified a 700m vein with significant mineralisation, and sent samples for chemical analysis. A drilling contract for 1,800m of diamond drilling has also been signed, with results expected in the coming months as part of a broader plan to fast-track the development of a high-grade, open-pit gold mine.
JAN Technical Observation:
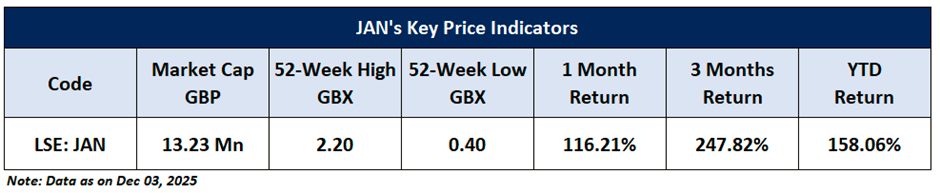
Jangada Mines Plc (LSE: JAN) is trading at GBX 1.80 after a sharp rise, with recent candles showing early consolidation and easing selling pressure. The RSI at 65.84 is situated in the bullish zone, indicating an improving short-term sentiment. While the broader trend remains weak, a sustained move above GBX 1.98 could open the way for a relief bounce toward GBX 2.34. Immediate support is placed near GBX 1.35, and a developing bullish RSI divergence further enhances the prospects of a near-term recovery.
JAN Daily Chart
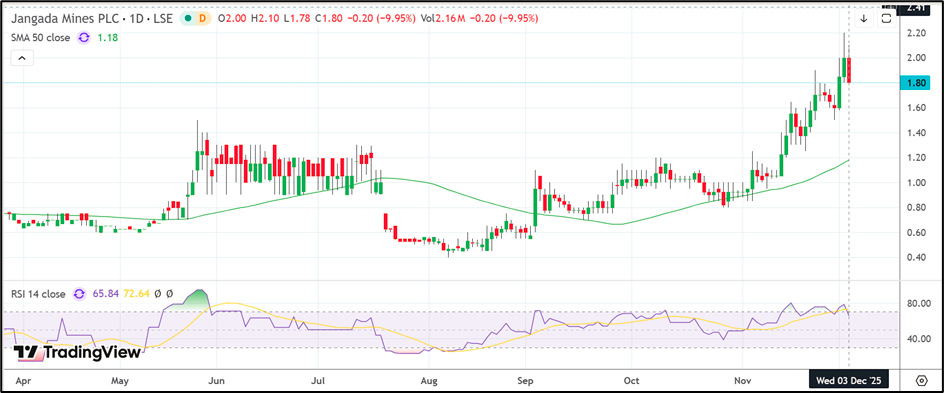
JAN Daily Technical Chart, Source – Refinitiv
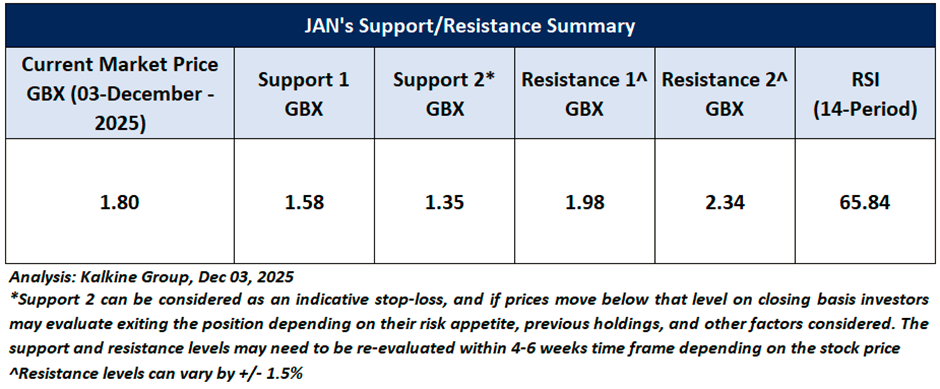

As per the above-mentioned price action and technical indicators analysis, a ‘Speculative Buy’ rating has been given on Jangada Mines Plc (LSE: JAN) at the Current Market Price of GBX 1.80, as of December 03, 2025, 08:40 AM, GMT.
Note 1: Past performance is not a reliable indicator of future performance.
Note 2: The reference date for all price data, currency, technical indicators, support, and resistance levels as on December 03, 2025. The reference data in this report has been partly sourced from REFINITIV.
Note 3: Investment decisions should be made depending on an individual's appetite for upside potential, risks, holding duration, and any previous holdings. An 'Exit' from the stock can be considered if the Target Price mentioned as per the Valuation and or the technical levels provided has been achieved and is subject to the factors discussed above.
Note 4: Dividend Yield may vary as per the stock price movement.
Note 5: Kalkine reports are prepared based on the stock prices captured either from REFINITIV or Trading View. Typically, REFINITIV or Trading View may reflect stock prices with a delay which could be a lag of 25-30 minutes. There can be no assurance that future results or events will be consistent with the information provided in the report. The information is subject to change without any prior notice.
Technical Indicators Defined: -
Support: A level at which the stock prices tend to find support if they are falling, and a downtrend may take a pause backed by demand or buying interest.
Resistance: A level at which the stock prices tend to find resistance when they are rising, and the uptrend may take a pause due to profit booking or selling interest.
Stop-loss: In general, it is a level to protect further losses in case of any unfavourable movement in the stock prices.

 Please wait processing your request...