This report is an updated version of the report published on 2 September 2025 at 12:15 PM AEST.
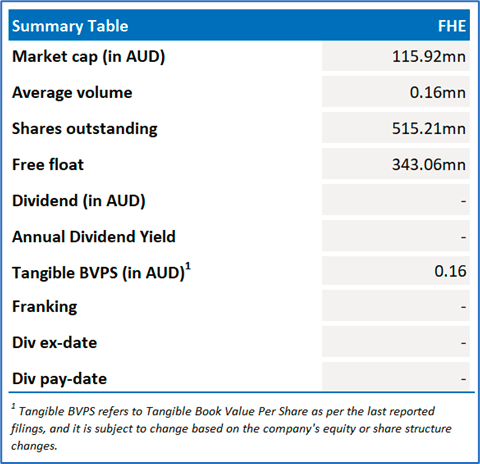
Frontier Energy Limited (ASX: FHE)
FHE is an Australia-based renewable energy company. The Company is developing the Waroona Renewable Energy Project, which is located strategically in the heart of the South-West of Western Australia. The Project is approximately 120 kilometers (km) south of the Perth, eight kilometers southwest of the Waroona townsite and five kilometers east of Forrest Highway, the traffic route linking Perth and Bunbury.
Recommendation Rationale – SELL at AUD 0.240
- Financial Highlights: FHE’s other income declined by 41.05% YoY to AUD 0.33mn in 1HFY25 vs AUD 0.56mn in 1HFY24. The company reported a net loss of AUD 0.21mn in 1HFY25. This loss was primarily due to ongoing operating expenses. FHE’s cash at banks reduced to AUD 5.29mn as on 30 June 2025 vs AUD 14.33mn as on 31 December 2024.
- Trading Near the Resistance: FHE stock has surpassed its R1 level recommended on 06 August 2025. Therefore, share price can face resistance at the current levels.
- Overvalued Multiples: On a Trailing 12-month basis – key trading multiple (EV/Sales) is higher than median of the Utilities Sector.
- Market Risk: The company’s projects must comply with strict environmental regulations and obtain necessary permits. Delays, changes in laws, or more stringent regulatory requirements could impact timelines and costs.
- Technical Commentary: While undergoing a rally, FHE’s stock price is approaching its previous peak, anticipating a potential correction. Moreover, the momentum oscillator RSI (14-period) is trading near its overbought territory, adding further evidence to the previous observation. Prices are trading above both trend-following indicators 21-day and 50-day SMAs, which might function as dynamic support levels for the stock; in contrast, the stock’s previous high may act as a resistance level.
FHE’s Daily Price Chart
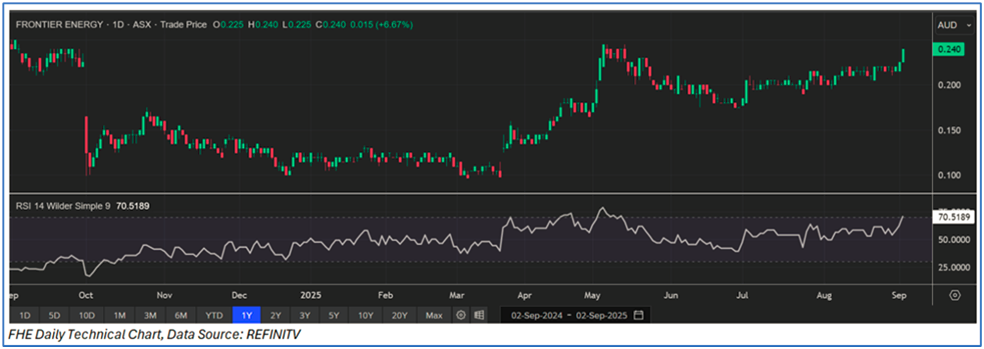
Considering that the stock has surpassed its R1 level, rally in share price, current trading level, and risks associated, the share price can face consolidation at the current levels. Hence, a ‘Sell’ recommendation is given on the stock at the current market price of AUD 0.240, as of 2 September 2025, at 11:15 AM AEST.
Frontier Energy Limited (ASX: FHE) is a part of Global Green Energy Portfolio.
Markets are trading in a highly volatile zone currently due to certain macro-economic issues and geopolitical issues prevailing geopolitical tensions. Therefore, it is prudent to follow a cautious approach while investing.
Note 1: Past performance is neither an indicator nor a guarantee of future performance.
Note 2: The reference date for all price data, currency, technical indicators, support, and resistance levels is 2 September 2025. The reference data in this report has been partly sourced from REFINITIV.
Note 3: Investment decisions should be made depending on an individual's appetite for upside potential, risks, holding duration, and any previous holdings. An 'Exit' from the stock can be considered if the Target Price mentioned as per the Valuation and or the technical levels provided has been achieved and is subject to the factors discussed above.
Note 4: Kalkine reports are prepared based on the stock prices captured either from REFINITIV or Trading View. Typically, REFINITIV or Trading View may reflect stock prices with a delay which could be a lag of 25-30 minutes. There can be no assurance that future results or events will be consistent with the information provided in the report. The information is subject to change without any prior notice.
Technical Indicators Defined: -
Support: A level at which the stock prices tend to find support if they are falling, and downtrend may take a pause backed by demand or buying interest.
Resistance: A level at which the stock prices tend to find resistance when they are rising, and uptrend may take a pause due to profit booking or selling interest.
Stop-loss: In general, it is a level to protect further losses in case of any unfavourable movement in the stock prices.
 Please wait processing your request...