This report is an updated version of the report published on 12 December 2025 at 11:19 AM AEDT.
Westgold Resources Ltd (ASX: WGX)
Westgold Resources Limited (ASX: WGX) is a Western Australia-based gold explorer, developer, and miner focused on the Murchison and Southern Goldfields regions. The company holds tenure over more than 3,200 km² and operates underground mines along with processing plants. With a focus on sustainable mining practices, Westgold is committed to maximising the potential of its extensive resource base while contributing to the local economy.
Recommendation Rationale – SELL at AUD 6.210
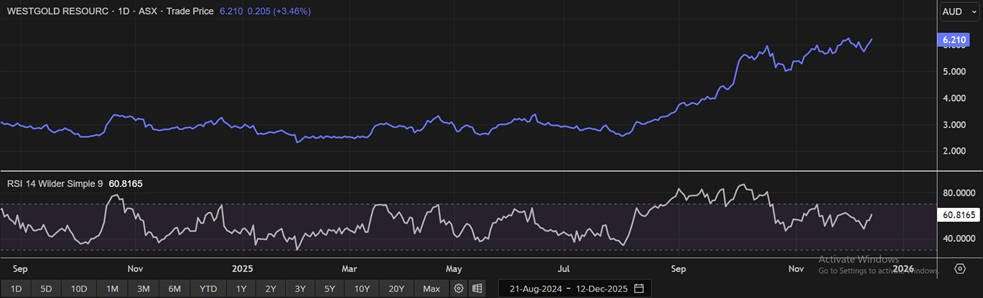
- Technical Standpoint: WGX share price has surpassed the R1 level recommended on 4 December 2025. This quick upward move raises the risk of short-term consolidation or downside retracement.
- Non-Core Spin-Out: WGX announced on 15 December 2025, a demerger of its non-core Reedy and Comet gold projects in Western Australia's Murchison region to a new entity, Valiant Gold Limited, via asset transfer and concurrent IPO targeting Q3 FY26. Demerger admits Reedy/Comet lack scale for Westgold's core high-grade focus, signaling portfolio streamlining amid execution challenges on smaller assets placed on care/maintenance in FY23 at lower gold prices.
- Quarterly Production Weaknesses: Group gold output fell to 83,937oz in Q1 FY26 from 88,022oz in Q4 FY25, driven by scheduled shutdowns, lower Murchison grades at Fortnum/Cue, and Bluebird-South Junction ramp-up delays from paste fill transitions.
- Elevated Costs and Cash Flow Strain: AISC rose to AU$2,861/oz (up 6% QoQ), pressured by third-party OPA ore, maintenance, and lower volumes. Murchison AISC hit AU$3,061/oz due to processing costs and recoveries dipping to 85% at Cue from Big Bell metallurgy issues.
Daily Price Chart
(Source: REFINITIV; Analysis by Kalkine Group)
Valuation Methodology: Price/Earnings Approach (FY June'26E) (Illustrative)
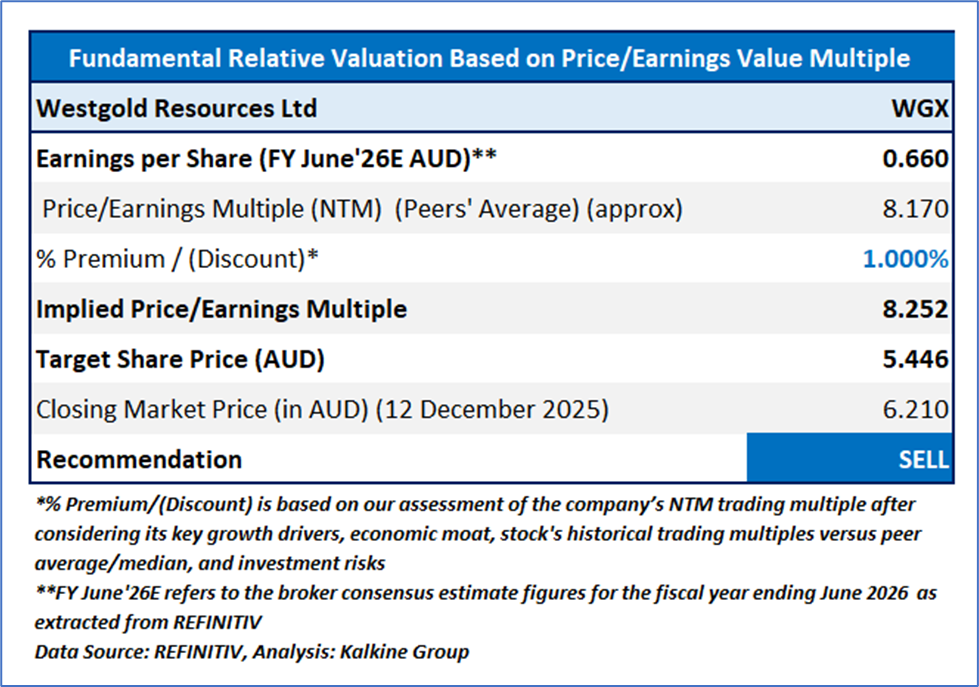
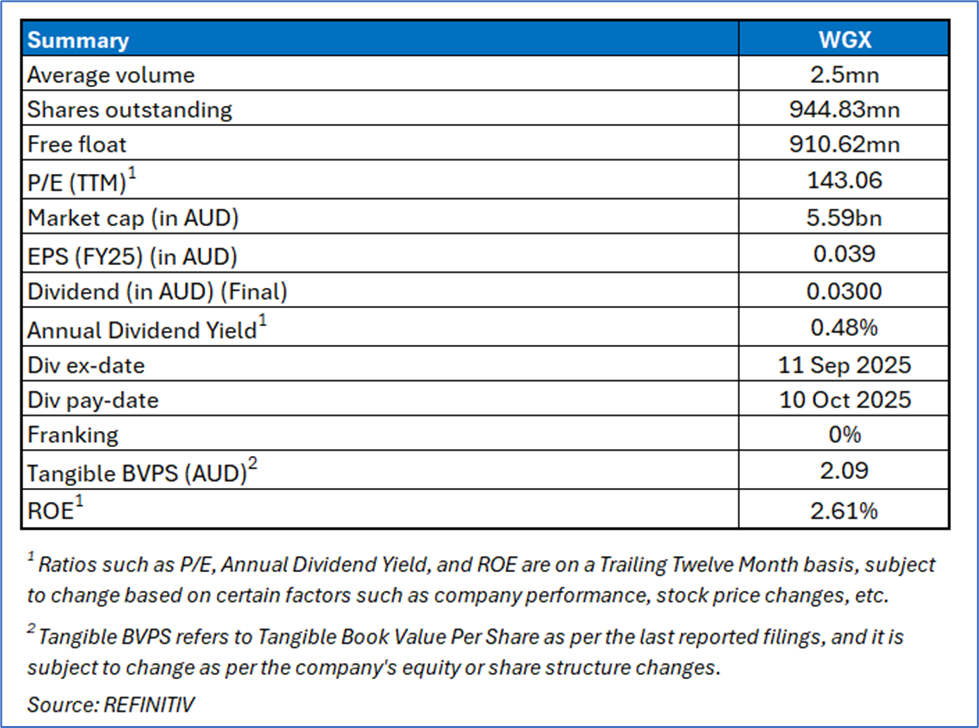
The stock may trade at a slight premium to peers given the record Q1 FY26 cash build of AU$180 Mn (total liquidity AU$472 Mn) funds growth capex internally, enabling dividends (3 cents per share FY25 final) and 3-year production outlook.
For valuation, the following peers have been considered - Regis Resources Ltd (ASX: RRL), Ora Banda Mining Ltd (ASX: OBM), and Kingsgate Consolidated Ltd (ASX: KCN).
Given the stock is approaching to its R2 level, recent rally in the share price, and risks associated, it is prudent to sell the stock at the current levels. Hence, a ‘Sell’ recommendation is given on the stock at the current market price of AUD 6.21, as of 12 December 2025, at 10:12 AM AEDT.
Markets are trading in a highly volatile zone currently due to certain macro-economic issues and geopolitical issues prevailing geopolitical tensions. Therefore, it is prudent to follow a cautious approach while investing.
Note 1: Past performance is neither an indicator nor a guarantee of future performance.
Note 2: The reference date for all price data, currency, technical indicators, support, and resistance levels is 12 December 2025. The reference data in this report has been partly sourced from REFINITIV.
Note 3: Investment decisions should be made depending on an individual's appetite for upside potential, risks, holding duration, and any previous holdings. An 'Exit' from the stock can be considered if the Target Price mentioned as per the Valuation and or the technical levels provided has been achieved and is subject to the factors discussed above.
Note 4: Kalkine reports are prepared based on the stock prices captured either from REFINITIV or Trading View. Typically, REFINITIV or Trading View may reflect stock prices with a delay which could be a lag of 25-30 minutes. There can be no assurance that future results or events will be consistent with the information provided in the report. The information is subject to change without any prior notice.
Note 5: Dividend Yield may vary as per the stock price movement.
Technical Indicators Defined: -
Support: A level at which the stock prices tend to find support if they are falling, and downtrend may take a pause backed by demand or buying interest.
Resistance: A level at which the stock prices tend to find resistance when they are rising, and uptrend may take a pause due to profit booking or selling interest.
Stop-loss: In general, it is a level to protect further losses in case of any unfavourable movement in the stock prices.

 Please wait processing your request...