This report is an updated version of the report published on 29 October 2025 at 09:34 AM GMT
Company Overview:
Mila Resources PLC (LSE: MILA)
Mila Resources PLC (LSE: MILA) is a mineral exploration company dedicated to developing promising gold and copper projects located within established mining districts.
This Report covers the Price Action, Technical Indicators Analysis along with the Support Levels, Resistance Levels, and Recommendations on this stock.
Fundamental Highlights:
- Strengthened Position Through Strategic Acquisition and Drilling Success: Mila Resources has made meaningful progress in advancing its post-discovery business model by securing and fast-tracking development of the Yarrol Gold Project in Queensland. The first-phase drilling delivered standout results, confirming the project’s decent potential with high-grade intercepts such as 17m @ 5.46g/t gold. The decision to exercise the EMX option and acquire 100% ownership of Yarrol and surrounding licences demonstrates confidence in the project’s long-term value and positions the company for significant resource growth.
- Enhanced Operational Capability and Technical Expertise: The appointment of Chief Operating Officer Alastair Goodship and the establishment of a dedicated in-house geological team mark a strategic shift toward greater operational efficiency and technical depth. By transitioning away from a consultancy-led model, Mila is building institutional knowledge and improving control over exploration activities. This internal capability is expected to accelerate the pace of discovery and deliver cost-effective progress across its Australian assets.
- Positive Market Outlook and decent Commodity Tailwinds: Mila’s focus on gold and copper is well-timed, with both commodities trading near record highs and investor sentiment improving across the sector. The company’s decent exploration results, coupled with robust market conditions and renewed capital market interest, create a favourable environment for shareholder value growth. The upcoming second-phase drilling and expected maiden mineral resource estimate at Yarrol represent potential near-term catalysts for further re-rating.
MILA’s Technical Observation:
From a technical-analysis vantage point, the stock of Mila Resources Plc (LSE: MILA) is showing short-term bullish momentum, with the share price trading above multiple key moving averages and several indicators (such as MACD and moving-averages) generating buy signals. However, caution is warranted: the Relative Strength Index (RSI) is elevated (suggesting potential overbought conditions) and some longer-term moving averages (e.g., the 200-day) continue to point to weaker support, signalling that a pull-back or consolidation could be imminent.

MILA’s Daily Price Chart
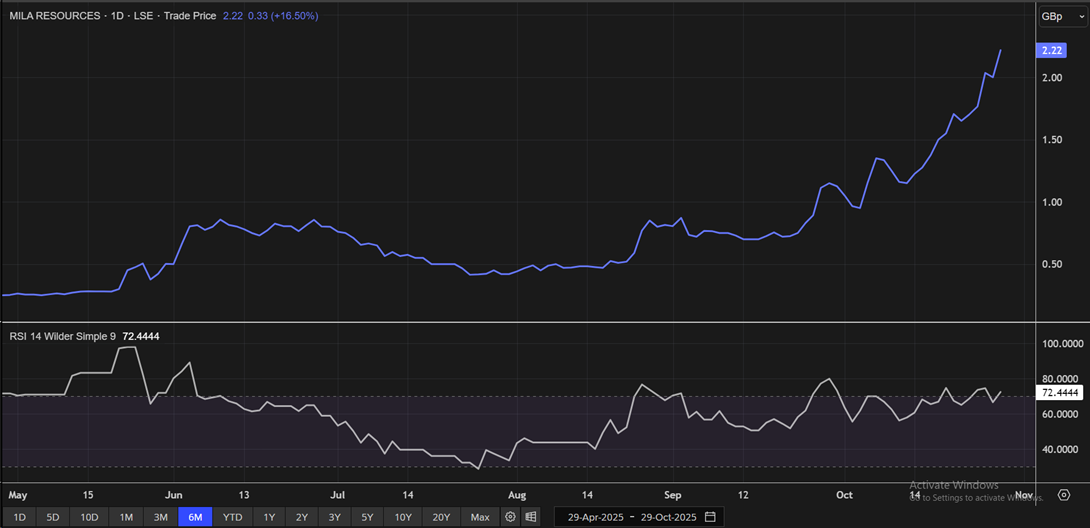
MILA Daily Technical Chart, Source - Refinitiv
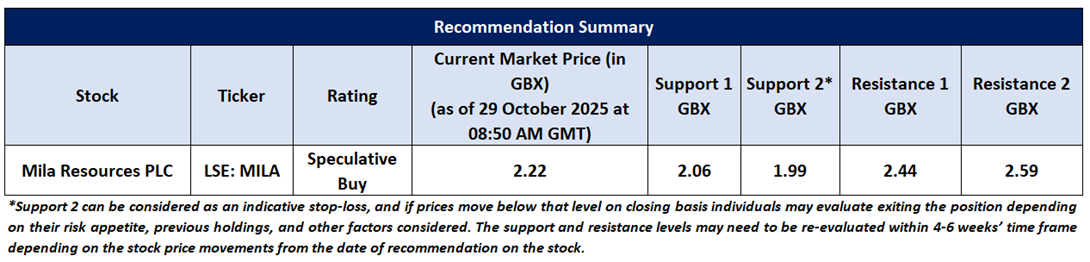
As per the above-mentioned price action and technical indicators analysis, a ‘Speculative Buy’ rating has been given Mila Resources (LSE: MILA) at the Current market Price of GBX 2.22, as on 29 October 2025 at 08:50 AM GMT.
Individuals can evaluate the stock based on the support and resistance levels provided in the report in case of keen interest taking into consideration the risk-reward scenario.
Markets are trading in a highly volatile zone currently due to certain Macro & Micro-economic data and prevailing geopolitical tensions. Therefore, it is prudent to follow a cautious approach while investing.
Note 1: Past performance is not a reliable indicator of future performance.
Note 2: Investment decisions should be made depending on an individual’s appetite for upside potential, risks, and any previous holdings. This recommendation is purely based on technical analysis, and fundamental analysis has not been considered in this report. Individuals can consider exiting from the stock if the Target Price or Stop loss mentioned as per the technical analysis has been achieved and is subject to the factors discussed above.
Note 3: Related Risks: This report may be looked at from a high-risk perspective, and recommendations are provided for a short duration. Recommendations provided in this report are solely based on technical parameters, and the fundamental performance of the stocks has not been considered in the decision-making process. Other factors which could impact the stock prices include market risks, regulatory risks, interest rate risks, currency risks, social and political instability risks etc.
Note 4: How to Read the Charts?
The Yellow color line reflects the 20-period moving average. SMA helps to identify existing price trends. If the prices are trading above the 20-period moving average, then it shows prices are currently trading in a bullish trend.
The Purple color line in the chart’s lower segment reflects the Relative Strength Index (14-Period) which indicates price momentum and signals momentum in trend. A reading of 70 or above suggests overbought status while a reading of 30 or below suggests an oversold status.
The Ink Blue color lines are the trend lines drawn by connecting two or more price points and used for trend identification purposes. The trend line also acts as a line of support and resistance.
Technical Indicators Defined: -
Support: A level at which stock prices tend to find support if they fall, and a downtrend may take a pause backed by demand or buying interest. Support 1 refers to the nearby support level for the stock and if the price breaches the level, then Support 2 may act as the crucial support level for the stock.
Resistance: A level at which stock prices tend to find resistance when they are rising, and an uptrend may take a pause due to profit booking or selling interest. Resistance 1 refers to the nearby resistance level for the stock and if the price surpasses the level, then Resistance 2 may act as the crucial resistance level for the stock.
Stop-loss: It is a level to protect against further losses in case of unfavorable movement in the stock prices.
The reference date for all price data, currency, technical indicators, support, and resistance levels is 29 October 2025. The reference data in this report has been partly sourced from REFINITIV.
Abbreviations
CMP: Current Market Price
SMA: Simple Moving Averages
RSI: Relative Strength Index
USD: United States dollar
Note: Trading decisions require a thorough analysis by individuals. Technical reports in general chart out metrics that may be assessed by individuals before any stock evaluation. The above are illustrative analytical factors used for evaluating stocks; other parameters can be looked at along with additional risks per se. Past performance is neither an indicator nor a guarantee of future performance.

 Please wait processing your request...