Nebius Group NV
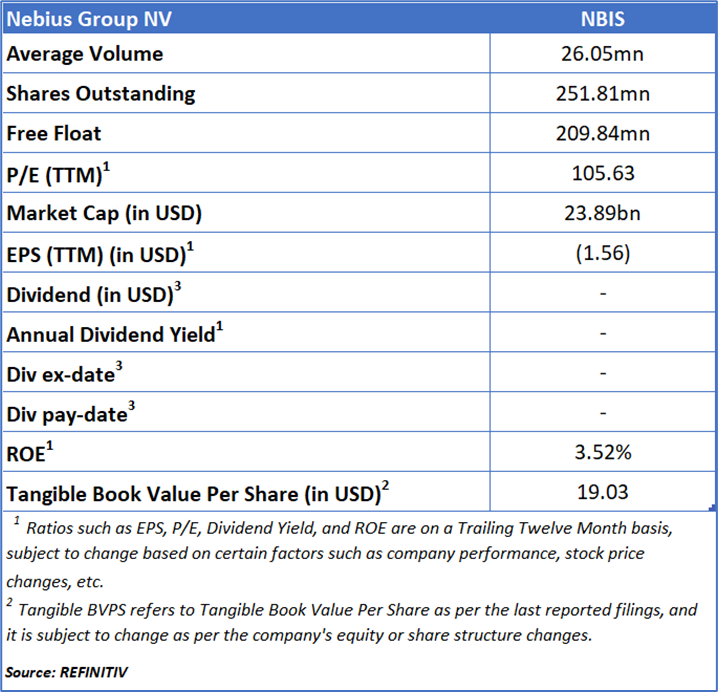
Nebius Group NV (NASDAQ: NBIS) is a Netherlands-based technology infrastructure provider specializing in the development and operation of assets that support artificial intelligence. The company’s objective is to create a globally scaled, AI-first platform that integrates core elements of the AI ecosystem — such as compute infrastructure, data capabilities, and advisory services — into a unified offering.
As per previous Kalkine’s Diversified Opportunities Report published on ‘NBIS’ on Nov 13, 2025, Kalkine provided an ‘Buy’ stance on the stock at USD 84.88 based on fundamental analysis and the stock price has now moved up by ~ 11.77% since then.
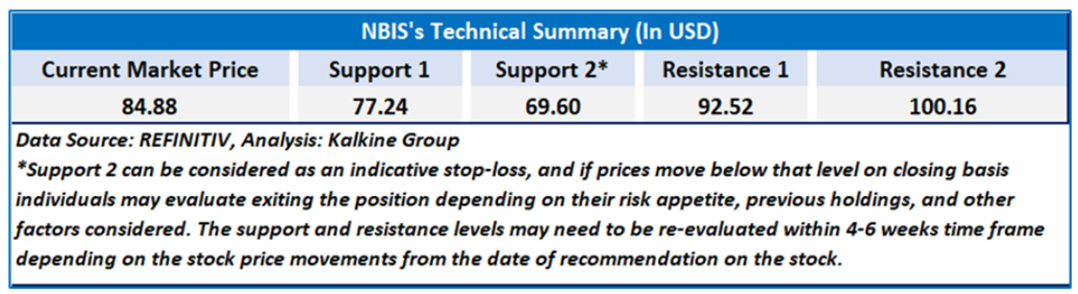
Noted below are the details of support and resistance levels provided in our previous report:
Rationale:
- High Cost Structure and Margin Pressure: Nebius continues to face significant cost pressures, as total operating expenses rose sharply to USD 276.3 million in Q3 2025, up 145% year over year. Cost of revenues increased by 333% as the company expanded data center operations, reflecting heavy reliance on co-location and leasing arrangements. Despite revenue growth, depreciation and amortization also surged to USD 99.0 million, driven by accelerated investments in GPU hardware and related infrastructure. These elevated expenses have kept profitability under strain, limiting near-term margin expansion.
- Heavy Capital Expenditure Requirements and Financing Dependence: The company’s growth trajectory requires exceptionally high capital intensity, with Q3 2025 capital expenditures reaching USD 955.5 million, primarily for GPUs and data center expansion. This dependency necessitates ongoing access to external financing, as evidenced by the USD 4.3 billion raised through convertible notes and equity offerings during the quarter. Management’s plan to introduce an at-the-market equity program underscores continued dilution risk for shareholders and illustrates the company’s reliance on debt and equity to sustain expansion.
- Capacity Constraints Limiting Revenue Realization: Despite strong demand, Nebius acknowledges that its primary limitation to revenue growth in 2025 has been the inability to bring sufficient capacity online. The company repeatedly sold out of available capacity during the year, highlighting a structural bottleneck in scaling data center operations. Although efforts are underway to increase contracted and connected power, these limitations have restricted the company’s ability to fully capitalize on customer demand, including major enterprise contracts.
- Loss Contributions from Non-Core Businesses: While the core AI infrastructure segment generated positive adjusted EBITDA in Q3 2025, the overall group still reported an adjusted EBITDA loss of USD 5.2 million. This loss was attributed to ongoing investments in Avride and TripleTen, whose contributions remain negative despite revenue growth in certain areas. These non-core segments continue to weigh on consolidated profitability and introduce operational complexity as the company scales.
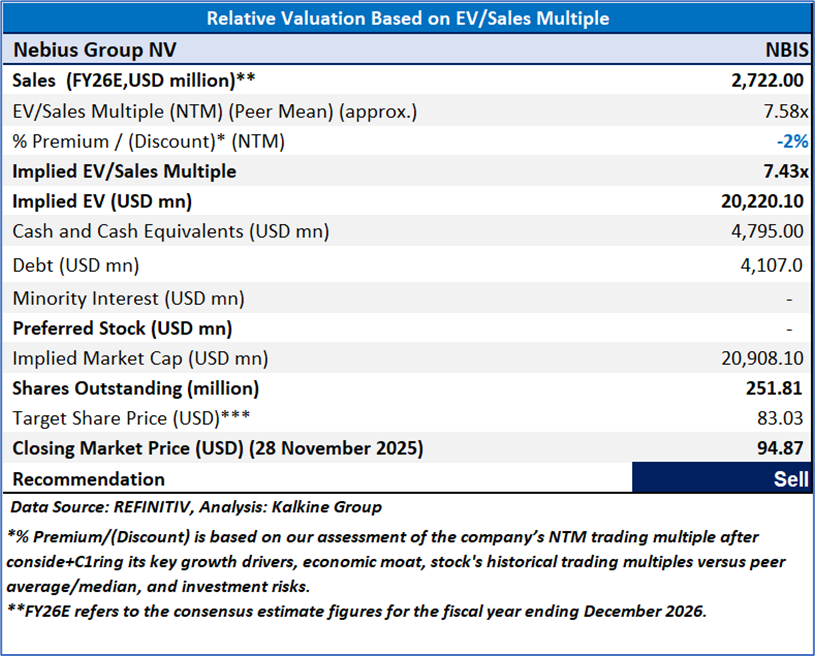
Valuation (Using EV/Sales Multiple)
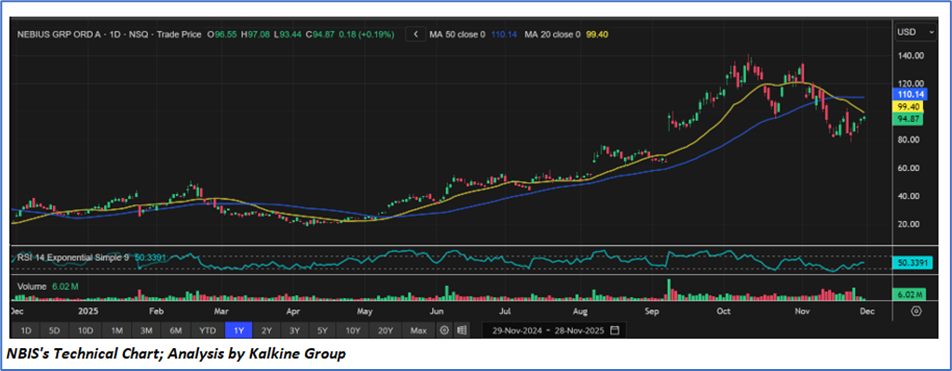
Share Price Chart
Conclusion
Nebius faces several structural challenges that weigh on its financial profile, including a sharply rising cost base driven by heavy infrastructure spending, substantial depreciation from accelerated GPU investments, and persistent reliance on external financing to support its capital-intensive growth model. Capacity constraints continue to limit its ability to fully capture strong market demand, while losses from non-core businesses such as Avride and TripleTen further dilute profitability. Together, these factors highlight meaningful execution, financing, and scalability risks for the company.
Based on the notional gains, valuation downside and price action stance, a "Sell" recommendation on Nebius Group NV (NASDAQ: NBIS) has been given at the closing market price of USD 94.87 as on 28 November 2025.
Note 1: Past performance is not a reliable indicator of future performance.
Note 2: The reference date for all price data, currency, technical indicators, support, and resistance level is 28 November 2025. The reference data in this report has been partly sourced from REFINITIV.
Note 3: Investment decisions should be made depending on an individual's appetite for upside potential, risks, holding duration, and any previous holdings. An 'Exit' from the stock can be considered if the Target Price mentioned as per the Valuation and or the technical levels provided has been achieved and is subject to the factors discussed above.
Note 4: Target Price refers to a price level which the stock is expected to reach as per the relative valuation method and/or technical analysis taking into consideration both short-term and long-term scenario.
Note 5: ‘Kalkine reports are prepared based on the stock prices captured either from the London Stock Exchange (LSE) and or REFINITIV. Typically, both sources (LSE and or REFINITIV) may reflect stock prices with a delay which could be a lag of 15-20 minutes. There can be no assurance that future results or events will be consistent with the information provided in the report. The information is subject to change without any prior notice.’
Note 6: Dividend Yield may vary as per the stock price movement.

 Please wait processing your request...