This report is an updated version of the report published on 17 September 2025 at 01:17 PM AEST
Coast Entertainment Holdings Limited (ASX: CEH)
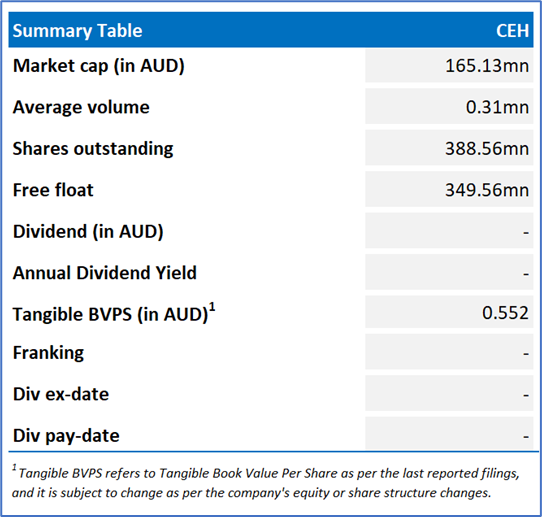
CEH is an Australia-based company, which invests and operates leisure and entertainment businesses. The company's theme parks and attractions business include Dreamworld and WhiteWater World in Coomera, Queensland and the SkyPoint observation deck and climb in Surfers Paradise, Queensland.
Recommendation Rationale – SELL at AUD 0.430
- Financial Highlights: CEH reported a net loss after tax of AUD 0.1mn in FY25, compared with a profit of AUD 2.6mn in FY24, primarily due to higher depreciation from recent capital investments and lower interest income amid reduced cash balances. Current assets stood at AUD 41.5mn as of 30 June 2025, down from AUD 97.0mn as of 30 June 2024. In March 2025, operations at Dreamworld, WhiteWater World, and SkyPoint were disrupted by Ex-Tropical Cyclone Alfred, resulting in temporary closures and lower attendance during peak holiday periods.
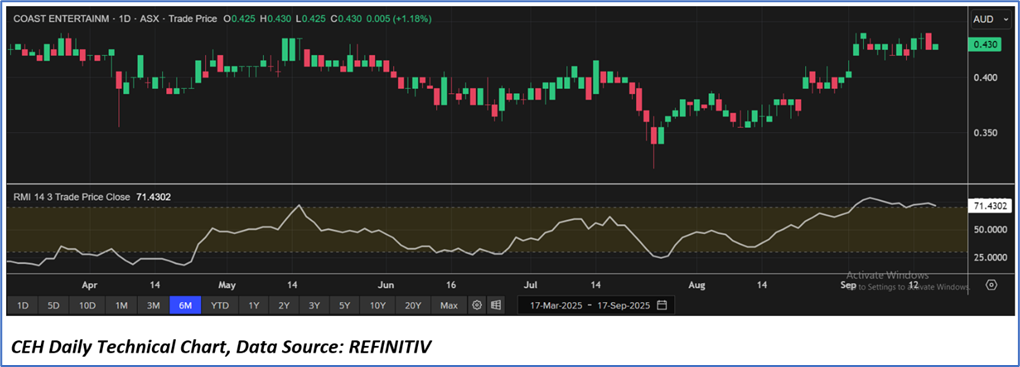
- Trading Near Resistance: CEH stock is approaching its R2 level recommended on 21 August 2025. Therefore, share price can face resistance at the current levels.
- Overvalued Multiples: On a forward 12-month basis – key trading multiples (EV/Sales, EV/EBITDA, P/E, Price/Cash Flow) are higher than the median of Consumer Cyclicals sector.
- Market Risk: Operating in the leisure and entertainment sector, CEH faces risks from economic uncertainty, inflation, extreme weather, and weak international tourism recovery. Compliance, safety, and seasonal attendance fluctuations could affect operations, while competition and shifting customer preferences may constrain growth and profitability.
CEH’s Daily Price Chart
Valuation Methodology: EV/Sales Multiple Approach (FY June'26E) (Illustrative)
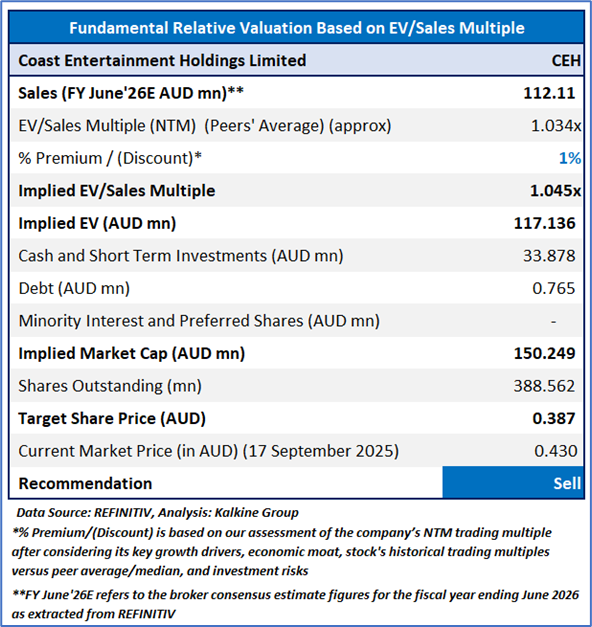
Stock might trade at a slight premium to its peers considering the YoY revenue growth from operating activities in FY25, an increase in EBITDA (excl. specific items), higher operating cash flow, and improvements in both ticket sales value and visitation. For conducting valuation, the following peers have been included: Betmakers Technology Group Ltd (ASX: BET), Experience Co Ltd (ASX: EXP), betr Entertainment Ltd (ASX: BBT), and others.
Considering that the stock is approaching its R2 level, macroeconomic uncertainty, share price movement, current trading level, and risks associated, the share price can face consolidation at the current levels. Hence, a ‘Sell’ recommendation is given on the stock at the current price of AUD 0.430 (as of 17 September 2025, at 12:20 PM AEST).
Markets are trading in a highly volatile zone currently due to certain macro-economic issues and geopolitical issues prevailing geopolitical tensions. Therefore, it is prudent to follow a cautious approach while investing.
Note 1: Past performance is neither an indicator nor a guarantee of future performance.
Note 2: The reference date for all price data, currency, technical indicators, support, and resistance levels is 17 September 2025. The reference data in this report has been partly sourced from REFINITIV.
Note 3: Investment decisions should be made depending on an individual's appetite for upside potential, risks, holding duration, and any previous holdings. An 'Exit' from the stock can be considered if the Target Price mentioned as per the Valuation and or the technical levels provided has been achieved and is subject to the factors discussed above.
Note 4: Kalkine reports are prepared based on the stock prices captured either from REFINITIV or Trading View. Typically, REFINITIV or Trading View may reflect stock prices with a delay which could be a lag of 25-30 minutes. There can be no assurance that future results or events will be consistent with the information provided in the report. The information is subject to change without any prior notice.
Technical Indicators Defined: -
Support: A level at which the stock prices tend to find support if they are falling, and downtrend may take a pause backed by demand or buying interest.
Resistance: A level at which the stock prices tend to find resistance when they are rising, and uptrend may take a pause due to profit booking or selling interest.
Stop-loss: In general, it is a level to protect further losses in case of any unfavourable movement in the stock prices.

 Please wait processing your request...