Company Overview: Orchard Funding Group PLC (LSE: ORCH) is an FTSE AIM All-Share index listed UK-based financial services company that, along with its subsidiaries, offers funding solutions and support systems to insurance brokers and professional firms. The company focuses on insurance premium financing, professional fee funding, financing for other service-related fees, and secured property lending. Its operations are divided into two segments: standard lending and Toyota-related products.
Fundamental Highlights:
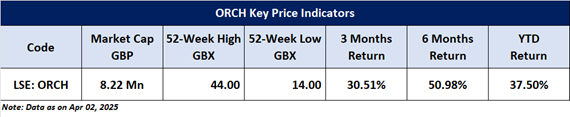
In the first half of FY25, the group delivered strong financial performance despite global economic uncertainties. Lending for non-Toyota products increased by 9.94% to GBP 54.86 million, while Toyota-related lending declined by 38.90% to GBP 5.20 million, in line with expectations. Profit before tax rose significantly by 94.42% to GBP 2.10 million, driven by increased turnover, improved lending rates, and a substantial reduction in impairment charges, which fell from GBP 0.49 million to GBP 0.06 million. Net financial assets grew by 14.70% to GBP 22.16 million, and liquidity increased by 1.20% to GBP 21.90 million. The gross interest margin improved to 16.76% from 11.80%, while net interest margin rose to 13.17%. Return on average equity nearly doubled to 15.44%. In recognition of strong performance, the board reinstated a 1p interim dividend and declared a special 1p dividend, both payable on 25 June 2025. Despite ongoing challenges, the group remains optimistic about continued growth in the next half-year.
ORCH’s Technical Observation:
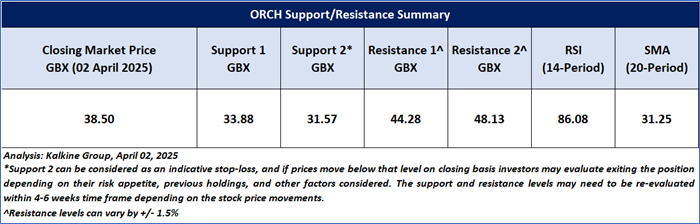
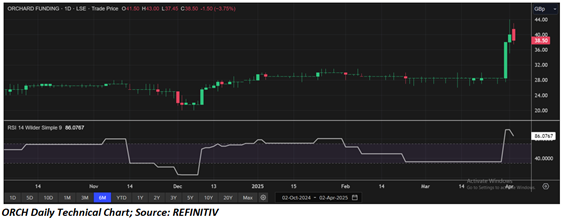
On the daily chart, ORCH trades at GBX 38.50, maintaining strong support at GBX 31.57, signalling a positive short-term trend. The RSI at 86.08 suggests room for further upside before reaching overbought conditions. The stock is also above the 50 SMA, supporting upward momentum. Recently, it broke out from a prolonged consolidation phase with strong volume and higher highs. As long as it holds above key support levels at GBX 31.57 and GBX 33.88, the broader momentum remains bullish. If buying interest continues, ORCH may soon retest recent highs around GBX 44.28 and GBX 48.13.

ORCH’s Daily Chart
As per the above-mentioned price action and technical indicators analysis, a ‘Speculative Buy’ rating has been given on Orchard Funding Group PLC (LSE: ORCH) at the closing market price of GBX 38.50, as of 2 April 2025. Individuals can evaluate the stock based on the support and resistance levels provided in the report in case of keen interest taking into consideration the risk-reward scenario.
The stock has not started trading on 03 April 2025 as of 12:35 PM GMT+1.
Markets are trading in a highly volatile zone currently due to certain Macro & Micro-economic data and prevailing geopolitical tensions. Therefore, it is prudent to follow a cautious approach while investing.
Note 1: Past performance is not a reliable indicator of future performance.
Note 2: Investment decisions should be made depending on an individual’s appetite for upside potential, risks, and any previous holdings. This recommendation is purely based on technical analysis, and fundamental analysis has not been considered in this report. Individuals can consider exiting from the stock if the Target Price or Stop loss mentioned as per the technical analysis has been achieved and is subject to the factors discussed above.
Note 3: Related Risks: This report may be looked at from a high-risk perspective and recommendations are provided for a short duration. Recommendations provided in this report are solely based on technical parameters, and the fundamental performance of the stocks has not been considered in the decision-making process. Other factors which could impact the stock prices include market risks, regulatory risks, interest rate risks, currency risks, social and political instability risks etc.
Note 4: How to Read the Charts?
The Green colour line reflects the 21-period moving average while the red line indicates the 50- period moving average. SMA helps to identify existing price trends. If the prices are trading above the 21-period and 50-period moving average, then it shows prices are currently trading in a bullish trend.
The Black colour line in the chart’s lower segment reflects the Relative Strength Index (14-Period) which indicates price momentum and signals momentum in trend. A reading of 70 or above suggests overbought status while a reading of 30 or below suggests an oversold status.
The Blue colour bars in the chart’s lower segment show the volume of the stock. The volume is the number of shares that changed hands during a given day. Stocks with high volumes are more liquid than stocks with lesser volume as liquidity in stocks helps in easier and faster execution of the order.
The Orange colour lines are the trend lines drawn by connecting two or more price points and used for trend identification purposes. The trend line also acts as a line of support and resistance.
Technical Indicators Defined: -
Support: A level at which the stock prices tend to find support if they are falling, and a downtrend may take a pause backed by demand or buying interest. Support 1 refers to the nearby support level for the stock and if the price breaches the level, then Support 2 may act as the crucial support level for the stock.
Resistance: A level at which stock prices tend to find resistance when they are rising, and an uptrend may take a pause due to profit booking or selling interest. Resistance 1 refers to the nearby resistance level for the stock and if the price surpasses the level, then Resistance 2 may act as the crucial resistance level for the stock.
Stop-loss: It is a level to protect against further losses in case of unfavorable movement in the stock prices.
The reference date for all price data, currency, technical indicators, support, and resistance levels is 02 April 2025. The reference data in this report has been partly sourced from REFINITIV.
Abbreviations
CMP: Current Market Price
SMA: Simple Moving Average
GBP: British pound sterling
GBX : British pence sterling
RSI: Relative Strength Index
USD: United States dollar
Note: Trading decisions require a thorough analysis by individuals. Technical reports in general chart out metrics that may be assessed by individuals before any stock evaluation. The above are illustrative analytical factors used for evaluating stocks; other parameters can be looked at along with additional risks per se. Past performance is neither an indicator nor a guarantee of future performance.

 Please wait processing your request...