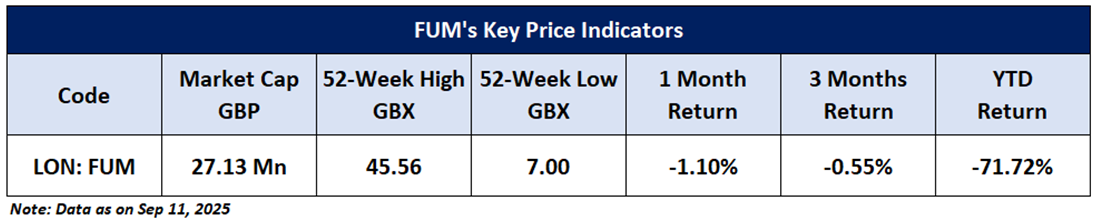
Company Overview: Futura Medical PLC (FUM) is a consumer healthcare company that specializes in the development and global commercialization of sexual health products. The Company is a developer of sexual health products, including the lead product, Eroxon, and two products in development, including WSD4000 and Eroxon Intense. Eroxon is a clear gel used for the treatment of erectile dysfunction (ED) available over the counter and without prescription and addresses significant unmet needs in the ED market. This Report covers the Price Action, Technical Indicators Analysis along with the Support Levels, Resistance Levels, and Recommendations on this stock.
Fundamental Highlights:
Strategic Review in Progress Amid Slower Sales - The company has acknowledged that Eroxon’s market uptake has been slower than initially expected, with variable performance across different regions. In response, a comprehensive review of commercial strategy and cost structure is underway, with an update expected alongside interim results later this month. Futura Medical has confirmed the formal appointment of Alex Duggan as interim CEO, bringing significant sector experience at a time when the company is reassessing its commercial direction. The planned departure of Finance Director and COO Angela Hildreth signals further executive change as the Group navigates this transitional phase.
FUM’s Technical Observation:
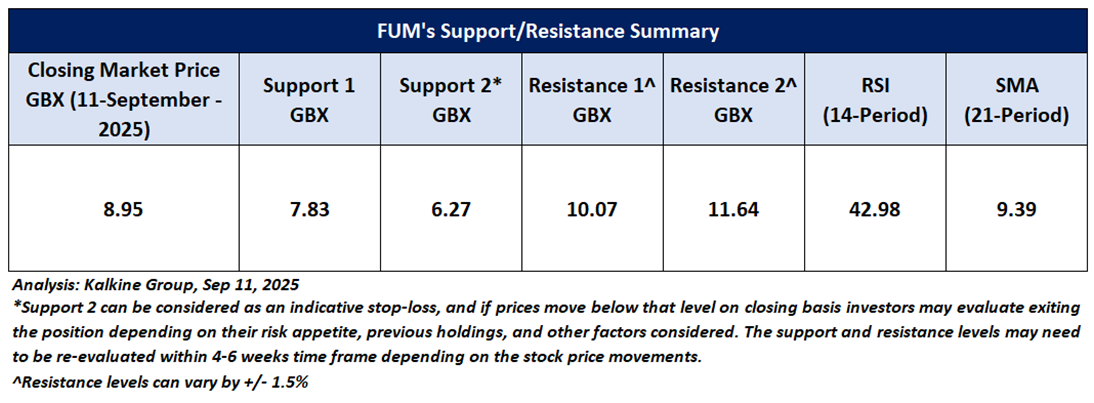
FUM closed at GBX 8.95, down 10.28%, with higher volumes providing support and stability from a base near GBX 6.27. The stock’s ability to hold above this level underscores resilience. The RSI at 42.98 is in neutral territory but showing signs of stabilising, suggesting scope for recovery if momentum strengthens. In the near term, sustaining above GBX 7.83 and GBX 6.27 will be key to preserving a constructive outlook. On the upside, resistances are placed at GBX 10.07 and GBX 11.64, which remain important reference levels for any potential advance.

FUM’s Daily Chart
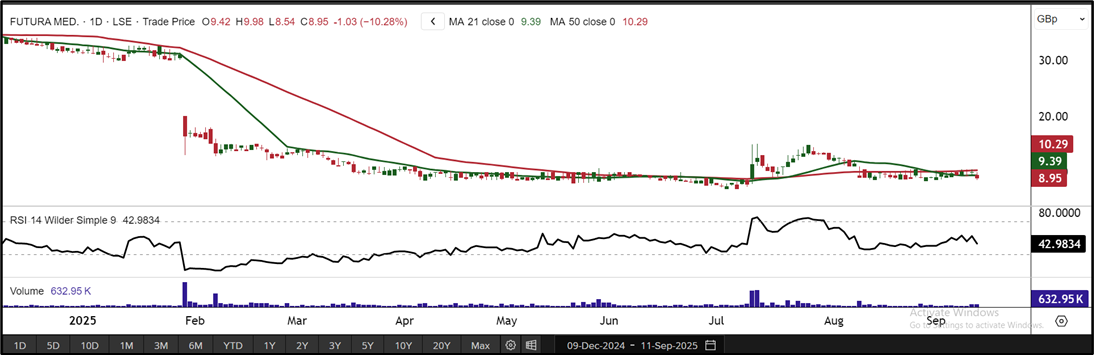
FUM Daily Technical Chart, Source – Refinitiv
As per the above-mentioned price action and technical indicators analysis, a ‘Speculative Buy’ rating has been given on Futura Medical PLC (FUM) at the Closing Market Price of GBX 8.95, as of September 11, 2025. Individuals can evaluate the stock based on the support and resistance levels provided in the report in case of keen interest taking into consideration the risk-reward scenario.
Markets are trading in a highly volatile zone currently due to certain Macro & Micro-economic data and prevailing geopolitical tensions. Therefore, it is prudent to follow a cautious approach while investing.
Note 1: Past performance is not a reliable indicator of future performance.
Note 2: Investment decisions should be made depending on an individual’s appetite for upside potential, risks, and any previous holdings. This recommendation is purely based on technical analysis, and fundamental analysis has not been considered in this report. Individuals can consider exiting from the stock if the Target Price or Stop loss mentioned as per the technical analysis has been achieved and is subject to the factors discussed above.
Note 3: Related Risks: This report may be looked at from a high-risk perspective and recommendations are provided for a short duration. Recommendations provided in this report are solely based on technical parameters, and the fundamental performance of the stocks has not been considered in the decision-making process. Other factors which could impact the stock prices include market risks, regulatory risks, interest rate risks, currency risks, social and political instability risks etc.
Note 4: How to Read the Charts?
The Green colour line reflects the 21-period moving average while the red line indicates the 50- period moving average. SMA helps to identify existing price trends. If the prices are trading above the 21-period and 50-period moving average, then it shows prices are currently trading in a bullish trend.
The Black colour line in the chart’s lower segment reflects the Relative Strength Index (14-Period) which indicates price momentum and signals momentum in trend. A reading of 70 or above suggests overbought status while a reading of 30 or below suggests an oversold status.
The Blue colour bars in the chart’s lower segment show the volume of the stock. The volume is the number of shares that changed hands during a given day. Stocks with high volumes are more liquid than stocks with lesser volume as liquidity in stocks helps in easier and faster execution of the order.
The Orange colour lines are the trend lines drawn by connecting two or more price points and used for trend identification purposes. The trend line also acts as a line of support and resistance.
Technical Indicators Defined: -
Support: A level at which the stock prices tend to find support if they are falling, and a downtrend may take a pause backed by demand or buying interest. Support 1 refers to the nearby support level for the stock and if the price breaches the level, then Support 2 may act as the crucial support level for the stock.
Resistance: A level at which stock prices tend to find resistance when they are rising, and an uptrend may take a pause due to profit booking or selling interest. Resistance 1 refers to the nearby resistance level for the stock and if the price surpasses the level, then Resistance 2 may act as the crucial resistance level for the stock
Stop-loss: It is a level to protect against further losses in case of unfavorable movement in the stock prices.
The reference date for all price data, currency, technical indicators, support, and resistance levels is September 11, 2025. The reference data in this report has been partly sourced from REFINITIV.
Abbreviations
CMP: Current Market Price
SMA: Simple Moving Average
GBP: British pound sterling
GBX: British pence sterling
RSI: Relative Strength Index
USD: United States dollar
Note: Trading decisions require a thorough analysis by individuals. Technical reports in general chart out metrics that may be assessed by individuals before any stock evaluation. The above are illustrative analytical factors used for evaluating stocks; other parameters can be looked at along with additional risks per se. Past performance is neither an indicator nor a guarantee of future performance.

 Please wait processing your request...