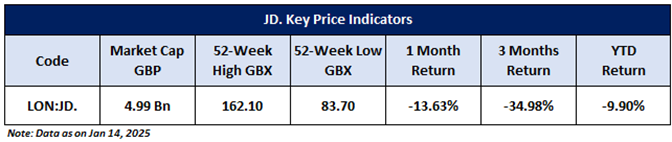
JD Sports Fashion PLC (LON: JD.) is an FTSE 100 listed international retailer specializing in sports fashion brands. The company primarily focuses on selling a variety of multi-branded sports and outdoor clothing, footwear, accessories, and equipment. Its business is divided into three segments: JD, Complementary Concepts, and Sporting Goods & Outdoor. This Report covers the Price Action, Technical Indicators Analysis along with the Support Levels, Resistance Levels, and Recommendations on this stock.
Trading Update for 9 weeks ended 9 January 2025:
JD Sports Fashion Plc delivered a resilient performance in a challenging market, achieving organic revenue growth of 3.4% during the nine weeks to 4 January 2025, with December like-for-like (LFL) revenue growth of 1.5%, driven by strong footwear sales and outperformance in Sporting Goods and Outdoor segments. Despite market volatility and increased promotional activity, gross margins remained robust, expected at 48% for the year, supported by disciplined pricing and cash management. The Group now forecasts full-year profit before tax and adjusting items to be between £915 million and £935 million, with a small net debt position anticipated by year-end.
JD.’s Technical Observation:
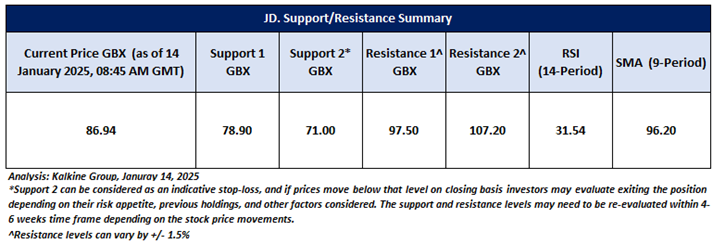
JD Sports is currently trading at GBX 86.94, down -9.72%, with bearish momentum persisting as the price remains below the 9-day moving average. However, the RSI at 31.54 signals oversold conditions, suggesting potential for a technical rebound. The stock is approaching a key support zone around GBX 78.9, which, if held, could serve as a base for recovery, with an upside resistance near GBX 97.5. While the broader trend remains downward, the combination of oversold conditions and proximity to support highlights a potential opportunity for a rebound, especially if accompanied by increased buying volume.
JD.’s Daily Chart
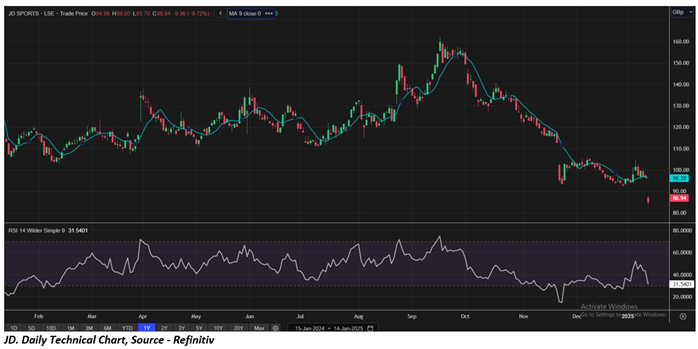
As per the above-mentioned price action and technical indicators analysis, a ‘Buy’ rating has been given on JD Sports Fashion PLC (LON: JD.) at the current market Price of GBX 86.94, as of January 14, 2025, 08:45 AM GMT. Individuals can evaluate the stock based on the support and resistance levels provided in the report in case of keen interest taking into consideration the risk-reward scenario.
Markets are trading in a highly volatile zone currently due to certain Macro & Micro-economic data and prevailing geopolitical tensions. Therefore, it is prudent to follow a cautious approach while investing.
Note 1: Past performance is not a reliable indicator of future performance.
Note 2: Investment decisions should be made depending on an individual’s appetite for upside potential, risks, and any previous holdings. This recommendation is purely based on technical analysis, and fundamental analysis has not been considered in this report. Individuals can consider exiting from the stock if the Target Price or Stop loss mentioned as per the technical analysis has been achieved and is subject to the factors discussed above.
Note 3: Related Risks: This report may be looked at from a high-risk perspective and recommendations are provided for a short duration. Recommendations provided in this report are solely based on technical parameters, and the fundamental performance of the stocks has not been considered in the decision-making process. Other factors which could impact the stock prices include market risks, regulatory risks, interest rate risks, currency risks, social and political instability risks etc.
Note 4: How to Read the Charts?
The Green colour line reflects the 21-period moving average while the red line indicates the 50- period moving average. SMA helps to identify existing price trends. If the prices are trading above the 21-period and 50-period moving average, then it shows prices are currently trading in a bullish trend.
The Black colour line in the chart’s lower segment reflects the Relative Strength Index (14-Period) which indicates price momentum and signals momentum in trend. A reading of 70 or above suggests overbought status while a reading of 30 or below suggests an oversold status.
The Blue colour bars in the chart’s lower segment show the volume of the stock. The volume is the number of shares that changed hands during a given day. Stocks with high volumes are more liquid than stocks with lesser volume as liquidity in stocks helps in easier and faster execution of the order.
The Orange colour lines are the trend lines drawn by connecting two or more price points and used for trend identification purposes. The trend line also acts as a line of support and resistance.
Technical Indicators Defined: -
Support: A level at which the stock prices tend to find support if they are falling, and a downtrend may take a pause backed by demand or buying interest. Support 1 refers to the nearby support level for the stock and if the price breaches the level, then Support 2 may act as the crucial support level for the stock.
Resistance: A level at which stock prices tend to find resistance when they are rising, and an uptrend may take a pause due to profit booking or selling interest. Resistance 1 refers to the nearby resistance level for the stock and if the price surpasses the level, then Resistance 2 may act as the crucial resistance level for the stock.
Stop-loss: It is a level to protect against further losses in case of unfavorable movement in the stock prices.
The reference date for all price data, currency, technical indicators, support, and resistance levels is January 14, 2025. The reference data in this report has been partly sourced from REFINITIV.
Abbreviations
CMP: Current Market Price
SMA: Simple Moving Average
GBP: British pound sterling
GBX: British pence sterling
RSI: Relative Strength Index
USD: United States dollar
Note: Trading decisions require a thorough analysis by individuals. Technical reports in general chart out metrics that may be assessed by individuals before any stock evaluation. The above are illustrative analytical factors used for evaluating stocks; other parameters can be looked at along with additional risks per se. Past performance is neither an indicator nor a guarantee of future performance.

 Please wait processing your request...