Company Overview: Kodal Minerals PLC (LON: KOD) is a United Kingdom-based company, which is engaged in the exploration and development of mineral assets. It operates through three segments: the West African Gold projects, the West African Lithium projects, and the UK administration operations. Its projects include Bougouni Lithium Project and Gold Project. This Report covers the Price Action, Technical Indicators Analysis along with the Support Levels, Resistance Levels, and Recommendations on this stock.
Fundamental Highlights:
The principal operational focus has been the development of the Stage 1 Dense Media Separation (DMS) processing plant at the Bougouni Lithium Project in southern Mali, with production expected to begin in Q1 2025. Despite minor delays due to heavy rainfall and logistical challenges, significant progress has been made, including the completion of civil construction and ongoing installation of critical equipment. Open pit mining continues ahead of schedule, with over 150,000 tonnes of ore already mined for the commissioning phase. Meanwhile, an extensive drilling program at the Boumou prospect has enhanced resource estimates, revealing extended pegmatite veins and potential exploration opportunities. Financially, the company reported a loss of £1.49 million for the six months ending 30 September 2024, with cash balances significantly higher than the previous year, totalling £18.1 million.
KOD’s Technical Observation:
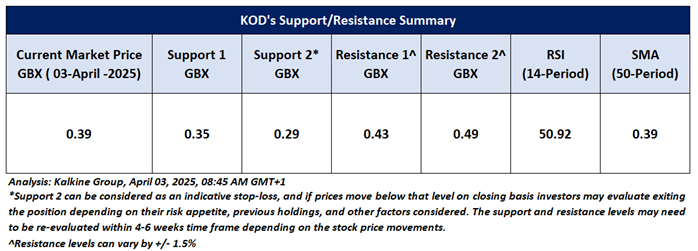
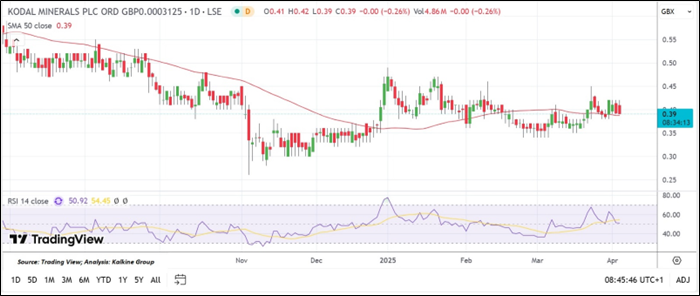
On the daily chart, KOD trades at GBX 0.39, maintaining strong support at GBX 0.29, signalling a positive short-term trend. The RSI at 50.92 suggests room for further upside before reaching overbought conditions. The stock is also above the 50 SMA, supporting upward momentum. Recently, it broke out from a prolonged consolidation phase with strong volume and higher highs. As long as it holds above key support levels at GBX 0.29 and GBX 0.35, the broader momentum remains bullish. If buying interest continues, KOD may soon retest recent highs around GBX 0.43 and GBX 0.49.

KOD’s Daily Chart
As per the above-mentioned price action and technical indicators analysis, a ‘Speculative Buy’ rating has been given on Kodal Minerals PLC (LON: KOD) at the Current Market Price of GBX 0.39, as of April 03, 2025, at (08:45 AM GMT+1). Individuals can evaluate the stock based on the support and resistance levels provided in the report in case of keen interest taking into consideration the risk-reward scenario.
Markets are trading in a highly volatile zone currently due to certain Macro & Micro-economic data and prevailing geopolitical tensions. Therefore, it is prudent to follow a cautious approach while investing.
Note 1: Past performance is not a reliable indicator of future performance.
Note 2: Investment decisions should be made depending on an individual’s appetite for upside potential, risks, and any previous holdings. This recommendation is purely based on technical analysis, and fundamental analysis has not been considered in this report. Individuals can consider exiting from the stock if the Target Price or Stop loss mentioned as per the technical analysis has been achieved and is subject to the factors discussed above.
Note 3: Related Risks: This report may be looked at from a high-risk perspective and recommendations are provided for a short duration. Recommendations provided in this report are solely based on technical parameters, and the fundamental performance of the stocks has not been considered in the decision-making process. Other factors which could impact the stock prices include market risks, regulatory risks, interest rate risks, currency risks, social and political instability risks etc.
Note 4: How to Read the Charts?
The Green colour line reflects the 21-period moving average while the red line indicates the 50- period moving average. SMA helps to identify existing price trends. If the prices are trading above the 21-period and 50-period moving average, then it shows prices are currently trading in a bullish trend.
The Black colour line in the chart’s lower segment reflects the Relative Strength Index (14-Period) which indicates price momentum and signals momentum in trend. A reading of 70 or above suggests overbought status while a reading of 30 or below suggests an oversold status.
The Blue colour bars in the chart’s lower segment show the volume of the stock. The volume is the number of shares that changed hands during a given day. Stocks with high volumes are more liquid than stocks with lesser volume as liquidity in stocks helps in easier and faster execution of the order.
The Orange colour lines are the trend lines drawn by connecting two or more price points and used for trend identification purposes. The trend line also acts as a line of support and resistance.
Note 5: Kalkine reports are prepared based on the stock prices captured either from the London Stock Exchange (LSE) and or REFINITIV. Typically, both sources (LSE and or REFINITIV) may reflect stock prices with a delay which could be a lag of 15-20 minutes. There can be no assurance that future results or events will be consistent with the information provided in the report. The information is subject to change without any prior notice.
Technical Indicators Defined: -
Support: A level at which the stock prices tend to find support if they are falling, and a downtrend may take a pause backed by demand or buying interest. Support 1 refers to the nearby support level for the stock and if the price breaches the level, then Support 2 may act as the crucial support level for the stock.
Resistance: A level at which stock prices tend to find resistance when they are rising, and an uptrend may take a pause due to profit booking or selling interest. Resistance 1 refers to the nearby resistance level for the stock and if the price surpasses the level, then Resistance 2 may act as the crucial resistance level for the stock.
Stop-loss: It is a level to protect against further losses in case of unfavorable movement in the stock prices.
The reference date for all price data, currency, technical indicators, support, and resistance levels is April 03, 2025, at (08:45 AM GMT+1). The reference data in this report has been partly sourced from REFINITIV.
Abbreviations
CMP: Current Market Price
SMA: Simple Moving Average
GBP: British pound sterling
GBX: British pence sterling
RSI: Relative Strength Index
USD: United States dollar
Note: Trading decisions require a thorough analysis by individuals. Technical reports in general chart out metrics that may be assessed by individuals before any stock evaluation. The above are illustrative analytical factors used for evaluating stocks; other parameters can be looked at along with additional risks per se. Past performance is neither an indicator nor a guarantee of future performance.

 Please wait processing your request...