Company Overview: London & Associated Properties PLC (LSE: LAS) is an LSE listed, UK-based property investment firm that focuses on acquiring, managing, and developing industrial and retail properties across the country. Its core assets include the Manor Portfolio and Orchard Square. The Manor Portfolio consists of nine industrial units leased to eight tenants, strategically positioned in the commercial hub of Runcorn, Cheshire. This Report covers the Price Action, Technical Indicators Analysis along with the Support Levels, Resistance Levels, and Recommendations on this stock.
Fundamental Highlights:
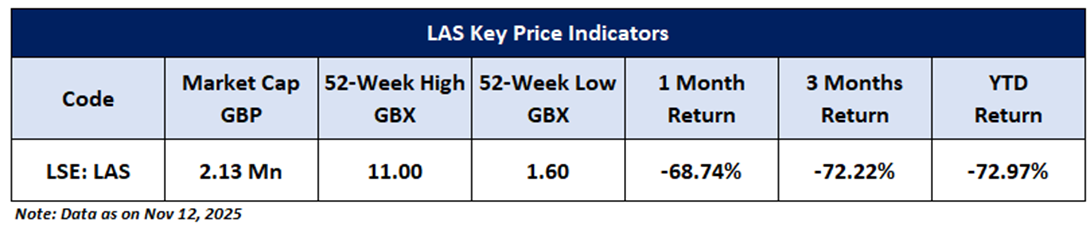
LAS reports portfolio occupancy at 94.4% by rental income (Jun-2024: 95.5%), with voids at 5.6%, alongside group revenue of £26.1 mn (H1-2024: £24.8 mn). Liquidity improved during the half, with cash and equivalents at £1.55 mn (up £0.87 mn), investing cash flow of +£0.75 mn driven by £1.50 mn of disposals, and finance expense easing to £1.13 mn (H1-2024: £1.53 mn). Borrowings stood at £24.38 mn (Dec-2024: £25.09 mn); management notes falling rates have aided property earnings and hedging remains under review. Cost actions are progressing—including London head-office options in Q4-2025—with selective disposals considered for redeployment into higher-potential assets. Development and JV updates include full consent at West Ealing (56 flats, 4 retail units), a replacement tenant at Dragon, and Bisichi’s planned 3p interim dividend, implying £133k income to LAP.
LAS Technical Observation:
London & Associated Properties (LSE: LAS) is trading at GBX 1.60 after a steep decline, but the recent candlestick pattern shows some signs of price consolidation, which may hint at near-term exhaustion in selling pressure. The RSI stands at 20.57, placing the stock deep in oversold territory, suggesting potential for a technical rebound if sentiment improves. While the downtrend remains dominant, any sustained move above GBX 1.80 could open the door for a relief rally toward the GBX 2.05. Near-term support is seen around GBX 1.40, and a bullish divergence in RSI could further validate recovery chances in the sessions ahead.

LAS Daily Chart
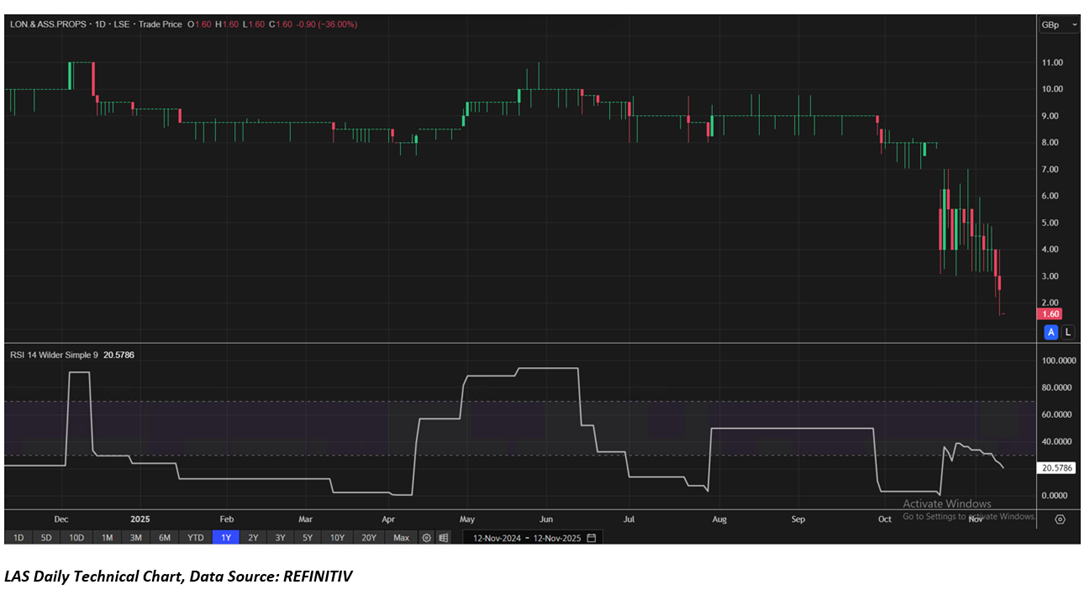
LAS Daily Technical Chart, Source – Refinitiv
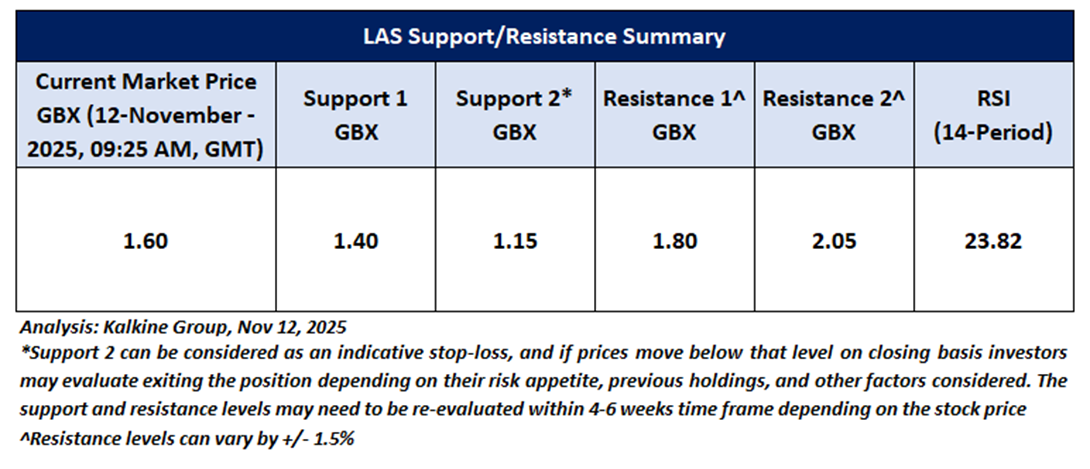
As per the above-mentioned price action and technical indicators analysis, a ‘Speculative Buy’ rating has been given on London & Associated Properties (LSE: LAS) at the Current Market Price of GBX 1.60, as of November 12, 2025, 09:25 AM, GMT. Individuals can evaluate the stock based on the support and resistance levels provided in the report in case of keen interest taking into consideration the risk-reward scenario.
Markets are trading in a highly volatile zone currently due to certain Macro & Micro-economic data and prevailing geopolitical tensions. Therefore, it is prudent to follow a cautious approach while investing.
Note 1: Past performance is not a reliable indicator of future performance.
Note 2: Investment decisions should be made depending on an individual’s appetite for upside potential, risks, and any previous holdings. This recommendation is purely based on technical analysis, and fundamental analysis has not been considered in this report. Individuals can consider exiting from the stock if the Target Price or Stop loss mentioned as per the technical analysis has been achieved and is subject to the factors discussed above.
Note 3: Related Risks: This report may be looked at from a high-risk perspective and recommendations are provided for a short duration. Recommendations provided in this report are solely based on technical parameters, and the fundamental performance of the stocks has not been considered in the decision-making process. Other factors which could impact the stock prices include market risks, regulatory risks, interest rate risks, currency risks, social and political instability risks etc.
Note 4: How to Read the Charts?
The Green colour line reflects the 21-period moving average while the red line indicates the 50- period moving average. SMA helps to identify existing price trends. If the prices are trading above the 21-period and 50-period moving average, then it shows prices are currently trading in a bullish trend.
The Black colour line in the chart’s lower segment reflects the Relative Strength Index (14-Period) which indicates price momentum and signals momentum in trend. A reading of 70 or above suggests overbought status while a reading of 30 or below suggests an oversold status.
The Blue colour bars in the chart’s lower segment show the volume of the stock. The volume is the number of shares that changed hands during a given day. Stocks with high volumes are more liquid than stocks with lesser volume as liquidity in stocks helps in easier and faster execution of the order.
The Orange colour lines are the trend lines drawn by connecting two or more price points and used for trend identification purposes. The trend line also acts as a line of support and resistance.
Technical Indicators Defined: -
Support: A level at which the stock prices tend to find support if they are falling, and a downtrend may take a pause backed by demand or buying interest. Support 1 refers to the nearby support level for the stock and if the price breaches the level, then Support 2 may act as the crucial support level for the stock.
Resistance: A level at which stock prices tend to find resistance when they are rising, and an uptrend may take a pause due to profit booking or selling interest. Resistance 1 refers to the nearby resistance level for the stock and if the price surpasses the level, then Resistance 2 may act as the crucial resistance level for the stock.
Stop-loss: It is a level to protect against further losses in case of unfavorable movement in the stock prices.
The reference date for all price data, currency, technical indicators, support, and resistance levels is November 12, 2025. The reference data in this report has been partly sourced from REFINITIV.
Abbreviations
CMP: Current Market Price
SMA: Simple Moving Average
GBP: British pound sterling
GBX: British pence sterling
RSI: Relative Strength Index
USD: United States dollar
Note: Trading decisions require a thorough analysis by individuals. Technical reports in general chart out metrics that may be assessed by individuals before any stock evaluation. The above are illustrative analytical factors used for evaluating stocks; other parameters can be looked at along with additional risks per se. Past performance is neither an indicator nor a guarantee of future performance.

 Please wait processing your request...