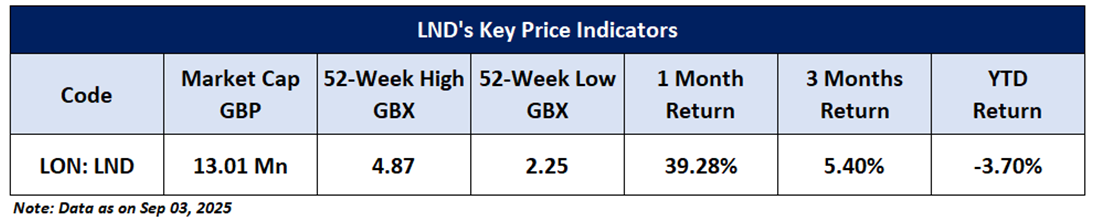
Company Overview: Landore Resources Limited (LON: LND), through its wholly owned subsidiary, Landore Resources Canada Inc., is engaged in mineral exploration and development in Canada. The Company is the 100% owner of the highly prospective BAM Gold Project in Northwestern Ontario, Canada, which has an NI 43-101 compliant resource estimate of 1.5m oz Au. This Report covers the Price Action, Technical Indicators Analysis along with the Support Levels, Resistance Levels, and Recommendations on this stock.
Fundamental Highlights:
Landore Resources Limited advanced its BAM Gold Project in 2024, which holds a compliant resource of 1.5Moz Au (1.03Moz indicated, 467koz inferred). The company raised £3.68m to fund exploration and broaden its institutional investor base, while completing a 14-hole, 3,549m drill programme aimed at upgrading resources, with results feeding into a new mineral resource estimate and Prefeasibility Study in 2025. Cash rose to £2.10m from £0.56m, supported by equity placements and divestments, while administrative expenses as a percentage of assets improved to 89% from 209%, reflecting better cost discipline. Portfolio focus was sharpened through divestment of non-core assets and the acquisition of adjacent claims, positioning BAM for further growth against a supportive gold price environment.
LND’s Technical Observation:
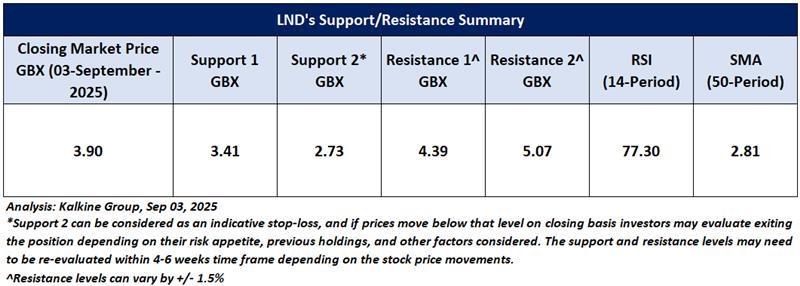
LND closed at GBX 3.90, up 21.87%, supported by higher volumes and stability from a base near GBX 2.73. The stock’s ability to hold above this level highlights resilience. The RSI at 77.30 signals bullish momentum, indicating strength in the ongoing move. In the near term, sustaining levels above GBX 3.41 and GBX 2.73 will be important to maintain a constructive outlook. On the upside, resistance is placed at GBX 4.39 and GBX 5.07, which may act as reference points for the next potential advance if upward momentum continues to build.

LND’s Daily Chart
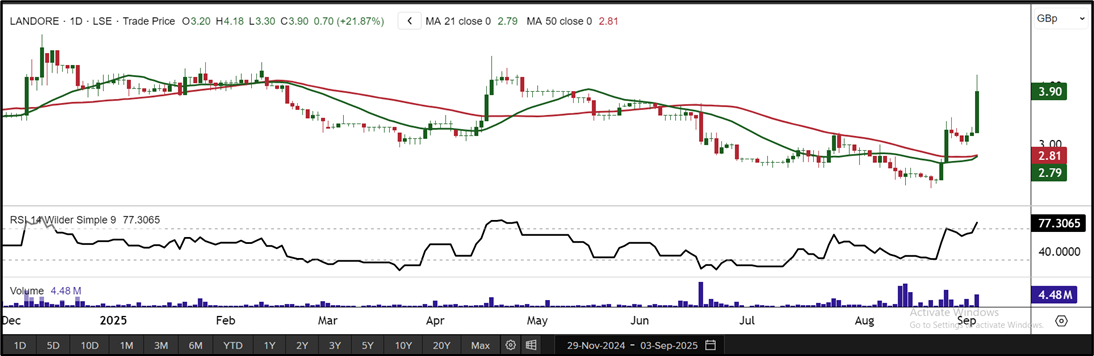
LND Daily Technical Chart, Source – Refinitiv
As per the above-mentioned price action and technical indicators analysis, a ‘Speculative Buy’ rating has been given on Landore Resources Limited (LON: LND) at the Closing Market Price of GBX 3.90, as of September 03, 2025. Individuals can evaluate the stock based on the support and resistance levels provided in the report in case of keen interest taking into consideration the risk-reward scenario.
Markets are trading in a highly volatile zone currently due to certain Macro & Micro-economic data and prevailing geopolitical tensions. Therefore, it is prudent to follow a cautious approach while investing.
Note 1: Past performance is not a reliable indicator of future performance.
Note 2: Investment decisions should be made depending on an individual’s appetite for upside potential, risks, and any previous holdings. This recommendation is purely based on technical analysis, and fundamental analysis has not been considered in this report. Individuals can consider exiting from the stock if the Target Price or Stop loss mentioned as per the technical analysis has been achieved and is subject to the factors discussed above.
Note 3: Related Risks: This report may be looked at from a high-risk perspective and recommendations are provided for a short duration. Recommendations provided in this report are solely based on technical parameters, and the fundamental performance of the stocks has not been considered in the decision-making process. Other factors which could impact the stock prices include market risks, regulatory risks, interest rate risks, currency risks, social and political instability risks etc.
Note 4: How to Read the Charts?
The Green colour line reflects the 21-period moving average while the red line indicates the 50- period moving average. SMA helps to identify existing price trends. If the prices are trading above the 21-period and 50-period moving average, then it shows prices are currently trading in a bullish trend.
The Black colour line in the chart’s lower segment reflects the Relative Strength Index (14-Period) which indicates price momentum and signals momentum in trend. A reading of 70 or above suggests overbought status while a reading of 30 or below suggests an oversold status.
The Blue colour bars in the chart’s lower segment show the volume of the stock. The volume is the number of shares that changed hands during a given day. Stocks with high volumes are more liquid than stocks with lesser volume as liquidity in stocks helps in easier and faster execution of the order.
The Orange colour lines are the trend lines drawn by connecting two or more price points and used for trend identification purposes. The trend line also acts as a line of support and resistance.
Technical Indicators Defined: -
Support: A level at which the stock prices tend to find support if they are falling, and a downtrend may take a pause backed by demand or buying interest. Support 1 refers to the nearby support level for the stock and if the price breaches the level, then Support 2 may act as the crucial support level for the stock.
Resistance: A level at which stock prices tend to find resistance when they are rising, and an uptrend may take a pause due to profit booking or selling interest. Resistance 1 refers to the nearby resistance level for the stock and if the price surpasses the level, then Resistance 2 may act as the crucial resistance level for the stock.
Stop-loss: It is a level to protect against further losses in case of unfavorable movement in the stock prices.
The reference date for all price data, currency, technical indicators, support, and resistance levels is September 03, 2025. The reference data in this report has been partly sourced from REFINITIV.
Abbreviations
CMP: Current Market Price
SMA: Simple Moving Average
GBP: British pound sterling
GBX: British pence sterling
RSI: Relative Strength Index
USD: United States dollar
Note: Trading decisions require a thorough analysis by individuals. Technical reports in general chart out metrics that may be assessed by individuals before any stock evaluation. The above are illustrative analytical factors used for evaluating stocks; other parameters can be looked at along with additional risks per se. Past performance is neither an indicator nor a guarantee of future performance.

 Please wait processing your request...