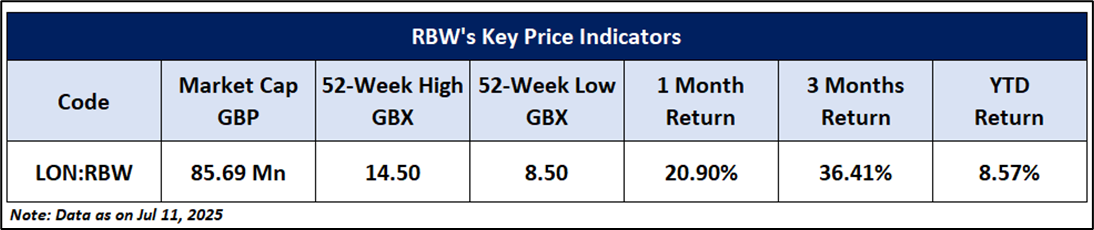
Company Overview: Rainbow Rare Earths Limited (LON: RBW) is a Guernsey-based mining company. The company’s principal activity is the development of a rare earth minerals project in South Africa and the opportunity to utilize the associated processing technology at other global rare earth opportunities, including but not limited to opportunities in Brazil. This Report covers the Price Action, Technical Indicators Analysis along with the Support Levels, Resistance Levels, and Recommendations on this stock.
Fundamental Highlights:
Rainbow and Mosaic Begin Economic Assessment for Rare Earth Recovery at Uberaba Project
Rainbow Rare Earths and The Mosaic Company have initiated an Economic Assessment (EA) to evaluate the viability of recovering rare earth elements (REE) from phosphogypsum at the Uberaba site in Brazil. The assessment, based on an annual feed rate of 4.3 Mtpa and average grades of 0.58% TREO, aims to explore a potential long-term, low-cost REE supply chain, building on similarities with Rainbow’s Phalaborwa project in South Africa.
RBW’s Technical Observation:
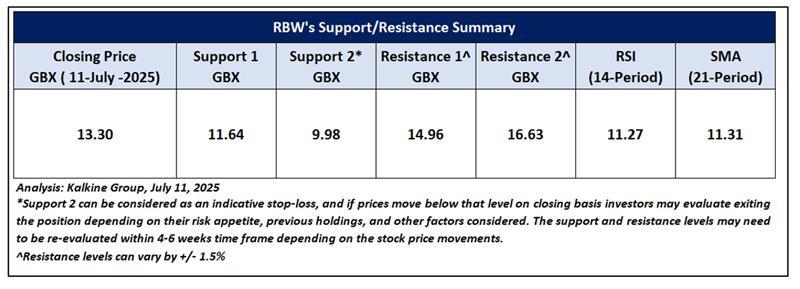
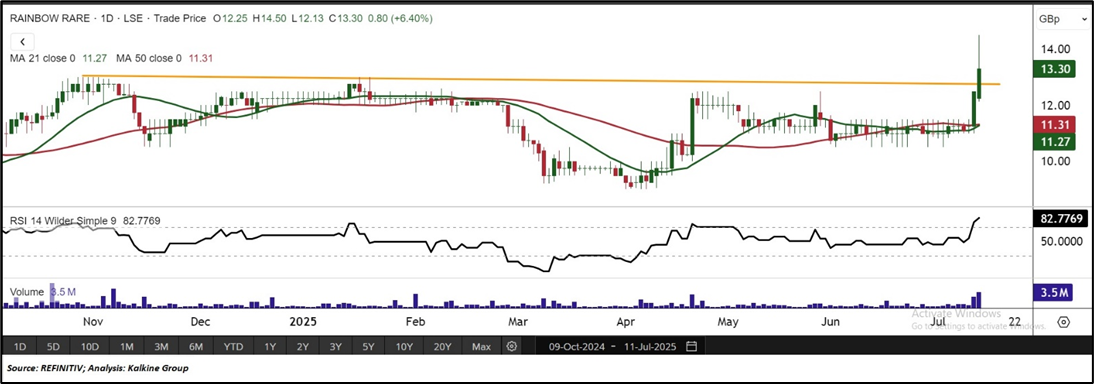
On the daily chart, RBW is trading at GBX 13.30, up 6.40%, maintaining strength above a key support level at GBX 11.27, which reflects a positive short-term trend. The RSI at 82.76 has entered overbought territory, indicating strong momentum with the potential for further upside. The stock recently broke out from a prolonged consolidation phase, supported by robust volume and the formation of higher highs. As long as RBW holds above support levels at GBX 11.64 and GBX 9.98, the broader trend remains constructive, with near-term upside levels seen around GBX 14.96 and GBX 16.63.

RBW's Daily Chart
As per the above-mentioned price action and technical indicators analysis, a ‘Speculative Buy’ rating has been given on Rainbow Rare Earths Limited (LON: RBW) at the closing Price of GBX 13.30, as of July 11, 2025. Individuals can evaluate the stock based on the support and resistance levels provided in the report in case of keen interest taking into consideration the risk-reward scenario.
Markets are trading in a highly volatile zone currently due to certain Macro & Micro-economic data and prevailing geopolitical tensions. Therefore, it is prudent to follow a cautious approach while investing.
Note 1: Past performance is not a reliable indicator of future performance.
Note 2: Investment decisions should be made depending on an individual’s appetite for upside potential, risks, and any previous holdings. This recommendation is purely based on technical analysis, and fundamental analysis has not been considered in this report. Individuals can consider exiting from the stock if the Target Price or Stop loss mentioned as per the technical analysis has been achieved and is subject to the factors discussed above.
Note 3: Related Risks: This report may be looked at from a high-risk perspective and recommendations are provided for a short duration. Recommendations provided in this report are solely based on technical parameters, and the fundamental performance of the stocks has not been considered in the decision-making process. Other factors which could impact the stock prices include market risks, regulatory risks, interest rate risks, currency risks, social and political instability risks etc.
Note 4: How to Read the Charts?
The Green colour line reflects the 21-period moving average while the red line indicates the 50- period moving average. SMA helps to identify existing price trends. If the prices are trading above the 21-period and 50-period moving average, then it shows prices are currently trading in a bullish trend.
The Black colour line in the chart’s lower segment reflects the Relative Strength Index (14-Period) which indicates price momentum and signals momentum in trend. A reading of 70 or above suggests overbought status while a reading of 30 or below suggests an oversold status.
The Blue colour bars in the chart’s lower segment show the volume of the stock. The volume is the number of shares that changed hands during a given day. Stocks with high volumes are more liquid than stocks with lesser volume as liquidity in stocks helps in easier and faster execution of the order.
The Orange colour lines are the trend lines drawn by connecting two or more price points and used for trend identification purposes. The trend line also acts as a line of support and resistance.
Technical Indicators Defined: -
Support: A level at which the stock prices tend to find support if they are falling, and a downtrend may take a pause backed by demand or buying interest. Support 1 refers to the nearby support level for the stock and if the price breaches the level, then Support 2 may act as the crucial support level for the stock.
Resistance: A level at which stock prices tend to find resistance when they are rising, and an uptrend may take a pause due to profit booking or selling interest. Resistance 1 refers to the nearby resistance level for the stock and if the price surpasses the level, then Resistance 2 may act as the crucial resistance level for the stock.
Stop-loss: It is a level to protect against further losses in case of unfavorable movement in the stock prices.
The reference date for all price data, currency, technical indicators, support, and resistance levels is July 11, 2025. The reference data in this report has been partly sourced from REFINITIV.
Abbreviations
CMP: Current Market Price
SMA: Simple Moving Average
GBP: British pound sterling
GBX: British pence sterling
RSI: Relative Strength Index
USD: United States dollar
Note: Trading decisions require a thorough analysis by individuals. Technical reports in general chart out metrics that may be assessed by individuals before any stock evaluation. The above are illustrative analytical factors used for evaluating stocks; other parameters can be looked at along with additional risks per se. Past performance is neither an indicator nor a guarantee of future performance.

 Please wait processing your request...